How much money has the world wasted because of some tree ring studies?
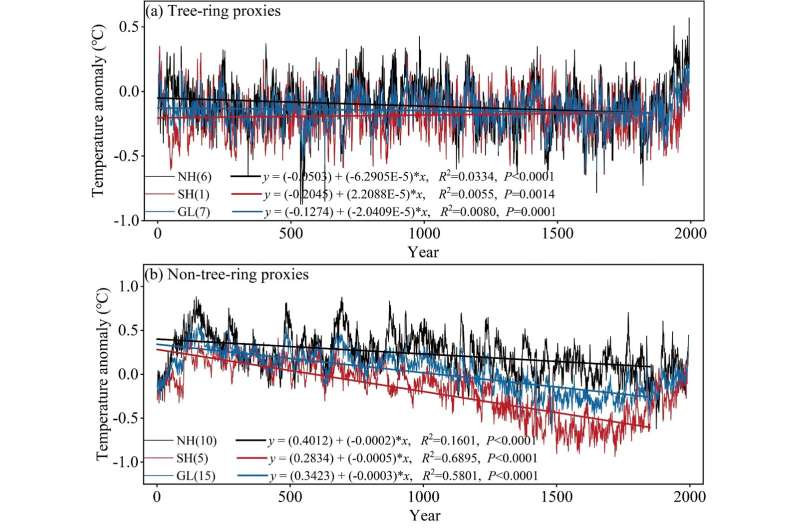
A Chinese group has looked at all the different kinds of 2,000 year long proxies in the PAGES dataset and found that history looks quite different depending on which proxy you pick. Only the tree rings show the HockeyStick shape that matches the climate models. In other proxies, temperatures have fallen for most of the last 2,000 years, especially in the Southern half of the world. And even after the recent warming, we are not yet back to the temperatures the Romans lived through.
So yet again, we see that that current temperatures are not unusual except according to tree rings, which we know are affected by rising levels of CO2. (The paper does not mention CO2 or carbon or fertilizer).
“All the evidence points out that we are still far from a complete understanding of the Common Era temperature variability at hemispheric and global scales,” says Professor Yang.”
“We show that the millennial cooling of annual mean temperatures is likely a global phenomenon.”
The world according to tree-rings is at the top, and other proxies, below:
The map showing that the proxies are spread around the world. There are not that many proxies stretching back 2,000 years:
Figure 1 Locations of the proxy data used for the temperature reconstructions over the past 2000 years.
The paper looked closely at how all the proxies responded to volcano eruptions, and tree rings do seem to be useful. But without acknowledging that trees love carbon dioxide and grow faster with the fertilization effect of extra CO2, it feels like they are dancing around the point. They said tree rings capture the variability of shorter periods (less than 200 years) but that non tree ring proxies were better for variations longer than 200 years. The news that matters the most to mum and dad voters is that they found a significant long term cooling trend, but that information is buried in the text.
And as so many proxies have shown, global warming started back in the late 1600s, long before human emissions of CO2 started.
UPDATE: Look at the non-tree-ring proxy — the warming began in the Southern Hemisphere before 1700AD. See also the 120 proxies of Christiansen and Ldundqvist, and the signal in China. What started that? Climate modelers have no idea. It wasn’t cars and coal power. It wasn’t man-made CO2. We don’t understand the big forces that drive our climate, yet we make you pay for your imaginary sins anyway.
Study finds temperature reconstructions during the Common Era are affected by the selection of paleoclimate data
PhysOrg: “… we wanted to know how our understanding of climate in the past is dependent on proxies,” says Professor Bao Yang. A paper on this topic is published in the journal Science China Earth Sciences.
To do so, the research team led by Professor Yang integrated the longest millennial paleoclimate data in the PAGES proxy network into new versions of global and hemispheric reconstructions of annual temperatures. The results show that the rate of pre-industrial millennial cooling in global and hemispheric temperatures varies according to proxy combination, with the strongest cooling revealed by non-tree-ring proxies.
Yang and colleagues compared the volcanic responses and spectral characteristics of tree-ring and non-tree-ring records. They found that the properties of tree-ring and non-tree-ring data differ significantly.
REFERENCE
Bao Yang et al, (2024) The influence of proxy selection on global annual mean temperature reconstructions during the Common Era, Science China Earth Sciences. DOI: 10.1007/s11430-024-1348-3


A tree ring circus?
590
I remain amazed that people think a change in an average of 1C, either way, makes any difference at all to chemistry, biology,survival, crop growth, climate. No plant or animal could tell the difference. It was hotter 2,000 years ago. What exactly is the problem with a few degrees change in average temperature? And for the naked ape, why isn’t a warmer world a better one?
640
And please not the drowned world. The 4 metre thin floating ice at the North Pole could all melt and the sea would not rise. The 3.5km high (average) ice block at -25C(summer) or -50C(Winter) the size of South America which is Antarctica is not going anywhere.
Which particular group of humans have a problem with a slightly warmer world? Where? Most people holiday in warmer climes.
We didn’t have a problem until politicians decided they are weather Gods. It’s not science.
561
Australia is drowning in massive carbon taxes crippling the country.
Can anyone name a politician who openly disagrees with Al Gore’s Climate Change?
No politician dares disagree. Indoctrination is complete. It’s not even a topic in the US election?
All we have is Trump and his drill,baby,drill. Because it’s the only way for America to survive.
Australia is in the same boat, trying to ban all our own exports.
550
Tdef… Matt Canavan may be one.
Source Wiki: Canavan is a climate change denier and a prominent supporter of fossil fuels, particularly coal, and has strongly opposed investment in renewable energy.
In November 2018, when high school students walked out of class to protest the Australian government’s inaction on climate change,
Canavan responded: “I want kids to be at school to learn about how you build a mine, how you do geology, how you drill for oil and gas”.
“The best thing you’ll learn by going to a (climate change) protest is how to join the dole queue.”
540
Tdef – Senator Malcom Roberts is another who openly disagrees with Al Gore’s Climate Change!
John
290
When politicians go on their fake “fact finding tours” (taxpayer funded vacations) do they go to warm areas or cold areas…?
390
David,
The Establishment claims that all groups of people are warming, not just warming a little, but all warming faster than the global average. Geoff S
https://quadrant.org.au/opinion/doomed-planet/2024/08/when-every-temperature-is-above-average/
132
Yes, as the UK MET announced May 2024 was the hottest May in recorded history in Britain. Except it was a lie.
After the outrage they admitted that only the Scottish highlands were 3.5C warmer at night because of persistent cloud cover, so it raised the minimum. May was actually cold.
In Australia the BOM adjusts all the temperatures, even the historical ones, with undocumented homogenization.
This is quite apart from the fact that Roman Britain was much warmer.
331
And I don’t know how someone calculated +6C from 596ppm. The leading atmospheric physicists in America would totally disagree. Take Prof William Happer.
Atmospheric physicists can reproduce the observed spectrum precisely from the individual spectra of the molecules involved. Then they can just double CO2 to 840ppm. The difference in reflectivity is 1.1%. QED.
240
Plus averages will rise if either the lower or upper values increase, a point missed by the pro-CAGW crowd.
110
Easy to do when no group of people (apart from some nomads) live on the feature which covers 70% of the surface of the earth, and you pretty well make up the temperatures of that 70% as well as large chunks of the land surface.
100
Cold ones, but in summertime. That is because of culture, not weather. The weather just chooses when to go
30
So far we’ve wasted trillions of $ in the OECD countries on the toxic W & S BS and fraud and Aussies can be certain that Labor, the Greens and Teals loonies will destroy up to 28,000 klms of our environments if we don’t change our votes at the next election.
But have we got the good sense and understanding to do so?
Rusted on Labor, Greens and Teals are too stupid to understand the data, but surely enough swingers will now change and follow the latest evidence?
381
Thanks again Jo for linking to the latest study and the HS nonsense should be dead and buried forever.
Again, only a few million hunter gatherer Humans during the previous Eemian inter-glacial and yet temps were 8 c warmer and SLs were 6 to 9 metres higher.
That’s the real evidence that counts, not some stupid “tree ring circus”.
260
“How much money has the world wasted because of some tree ring studies?”
Here are some calculations:
https://www.climatedollars.org/full-study/us-govt-funding-of-climate-change/
That’s probably double the amount nowadays.
90
28,000km of power lines at 100m of easement is 700,000 acres (I think!). That’s a lot of farmland and/or natural bush.
60
The world cools.
The world warms.
And goes through cycles.
This is something that the warmists and the Left, who are what I call staticists, believing in a never-changing world (like Aristotle), are unable to comprehend.
291
Unable or unwilling?
30
As I wrote on Tony Heller’s site yesterday, with reference to this ‘tree ring circus’ big-top proxy comparison, “the most effluent climate scientist in the world” will be sharpening his knives whilst contacting his lawyers and shouting childish obscenities.
O, how the mighty [tree ring] hath fallen!
Three decades of mumbo-jumbo make-believe seance evaporated just like that. No wonder the Romans wore togas and not much else. Salut!
280
Trousers were introduced for horse riding, mainly by the Mongols. Scotsmen never rode horses.
160
Glacier Bay (southern Alaska) was surveyed from 1780 and showed ice loss by the next survey in 1794, large ice loss by 1860, and minimal ice left by 1892.
That arctic ice would rapidly disappear is confirmed from Sir Joseph Banks, as President of the Royal Society, sent an official letter to the Admiralty in 1817 about sea ice disappearing on the east coast of Greenland, and suggesting it might open up the NW Passage.
Jacobshavn glacier in Greenland was melting from 1875 (initial survey in 1851) until there was little left after 1964. Most of the rest melted until about 2003, when it became the “settled science” that Arctic ice would melt away.
This might not happen as the latest report (2024) notes that arctic sea ice extent has been stable (no downward trend) since 2007.
Moreover, the sea ice off Greenland showed an unusual summer growth of more than 2 billion tons at the end of July 2024 (in the middle of their summer).
260
There is science.
And then there is Science.
Unassuming science toils quietly in the background.
Science bloviates and makes big messes that science is left to clean up.
Climate and Global Health Science have made big historic messes that science is going to have a tough go sorting out.
Science has probably set science back by about 50 years.
280
But didn’t the final “kick up” in the Hockey Stick come from “Mike’s Nature trick”, substituting actual temperature data for the proxy, because the proxy went in the wrong direction?
290
And the truncation of Keith Briffa’s inconvenient data.
110
Yes, that is true. I didn’t even try to re-encapsulate the scientific tragedy that was Mann’s HockeyStick. With the wrong kind of tree, the wrong kind of maths, and splicing two different types of data. He could have used bus timetables to find a rising crisis.
See https://joannenova.com.au/2010/08/zombie-hockey-stick-dies-again/
230
Nonsense. The “hockey stick” shape has been independently verified by dozens of studies since Mann wrote his original paper 30 years ago.
126
Funny how you don’t give any links to justify this.
120
I didn’t because there are too many papers to consider. Here is a sample:
https://en.wikipedia.org/wiki/List_of_large-scale_temperature_reconstructions_of_the_last_2,000_years
It’s bizarre that climate change deniers concentrate on a debate about a solitary paper that was settled 25 years ago. Move on, and start reading more contemporary literature.
121
His own paper has been exposed as statistical junk and all those so called replication papers use the same problem which is why it sticks out like a sore thumb.
There are many disciplines that shows a consistently different picture that shows significant changes from MWP to the LIA that to the MWP of today on a 900-1,000-year cycle that started with the Minoan peak.
GISP2 Ice Core data shows the large temperature swings:
LINK
Ljungquist science paper
LINK
140
GISP2 is one proxy that finishes around 1850. It is considered in many temperature reconstructions.
Maybe you should actually read the papers you quote, the Ljungquist abstract says:
115
I was referring to Mann 1998 paper and you didn’t see the chart on page 7 in Ljungquist which you ignored shows large swings from MWP to the LIA back up to the MWP we enjoy today.
The chart in the GISP2 LINK shows the same large temperature swings from Minoan warm period time frame onwards to our current warm period.
Both of these charts don’t show any form of a hockey Stick paper, but they clearly show a distinct 1,000 peak to peak cycle since the Minoan peak 3,500 years ago thus you are being profoundly dishonest here.
Manns 2008 paper had errors in it that had to be corrected but it still had some laughable proplems that shows he is a poor researcher, you seem to have forgotten the upside down Tilander proxy goof,
More Upside-Down Mann
LINK
Mann Et al 2008 archives
LINK
You flopped badly here.
120
That is not an accurate representation of tree rings. Willis E did a good analysis of how Mann created his hockey stick. The process was:
1. You find all the proxies that show a correlation with recent temperature measurement.
2. You choose the ones that show a positive correlation. (or it could be negative but must be one or the other; not both)
3. You then combine the results into an average and extend back in time beyond the temperature correlation period.
4. Voila you have a hockey stick.
As I recall, Willis produced 600 random sequences for his proxies. He found those that exhibited a positive correlation with the recent temperature record and combined them to produce his longer record. They invariably produced a hockey stick. Sort of obvious when you think about it. He also did it with those having negative correlation and got a similar hockey stick.
210
I think I heard about a study where the last 50 years of input data from the Mannster’s model was cut off and spliced to the start of the time period. Unsurprisingly, the kick up of the hockey schtick remained in place at the end of the time period, instead of moving to the start. And the flat part of the schtick was incredibly transformed into the sharp uptick. Its was a feature of the model and not the data.
Anyone else encountered this or know where it is found?
Or is this my mining engineer “how the hell do you test this?” wildest fantasy……
90
Rick, obviously it was Steve McIntyre, with years of work, who broke the HockeyStick, and several times. I was merely commenting that in the graphs above the tree rings resembled the hockeystick, even without “Principle Component Analysis” trickery.
I wrote so much about the HockeyStick, so long ago.
Dean, Steve McIntyre came from the mining industry like you. He writes at Climate Audit. The sorry tale of the Hockey Stick is summarized here, but the details and links to papers you really want are here. See refs 5, 6, 7. See also “How to create a hockey stick with just 12 trees in Yamal”.
See also Hockeysticks don’t die, they just get more corrupt.
Also that famous quote from Phil Jones:
230
BTW Ken Stringer called the much warmer earlier Holocene the world’s biggest thermometer.
And he used the real measurable data of much higher SLs around Australia during the warmer Holocene climate optimum.
BTW even their ABC linked to the Narrabeen man Catalyst story and told us that SLs at Sydney were 1.5 metres higher just 4,000 years ago.
Ken Stewart links to many studies that prove his point.
https://kenskingdom.wordpress.com/2021/08/23/the-worlds-biggest-thermometer/
150
Here is a recent paper which proves beyond reasonable doubt that CO2 has naught to do with temperature.
https://notrickszone.com/2024/08/15/new-study-warmest-carpathian-temperatures-of-the-last-2000-years-were-2c-warmer-than-today/
171
Carpathian temperatures cooled between 1970 – 2000 and a negative AMO appears to be the main driver on that occasion.
https://chaac.meteo.plus/en/climate/amo-index.png
101
When during the natural “global warming” of the Minoan, Egyptian, Roman and Medieval warm periods when civilisation thrived, was a bit of warmth a bad thing?
Perhaps warmists/Leftists would prefer a return to the Little Ice Age, which we will enivitably return to anyway, followed by full-on glaciation?
How will civilisation survive the forthcoming cold without coal, gas, real hydro (not SH2) and nuclear power?
210
Thanks to RickWill for reminding me about Eschenbach’s “Mining for Hockeysticks” article at WUWT in June 2024.
Here’s the link to the study and the huge response from the comments.
IOW the straight handle and the sharp blade uptick are just more laughable lunacy.
https://wattsupwiththat.com/2024/06/29/mining-for-hockeysticks/
110
You read my mined.
see question abotu this below….
60
The thing that annoys me most about being labelled a climate denier is that very often that accusation is accompanied by the allegation you don’t believe in global warming. Which is simply not true. All the best climate realists know global warming exists and started sometime within the last 300 years. It’s one of the main reasons the world’s human population has greatly increased in that time. The weather got better and life got easier!
180
Any world in the Goldilocks zone,
Must to temperature changes be prone,
So a few degrees change,
Up or down is in range,
And no reason for warmists to moan.
220
That’s a good one Ruairi 🙂
130
See-saw, Marjorie Dawe,
60
A tisket, a tasket, a green and yellow ——–.
30
This is a nice paper that confirms that tree rings are really good as isolating annual variability, but in the long-run there are other factors that affect tree growth. Non-tree ring proxies help set the trend, tree ring proxies tune the fine scale variability. A good Principal Components Analysis benefits from a range of proxies.
Spatial resolution and interpretation is important too. Jo interprets the warming starting in the late 1600’s, but that was the coolest period of the ‘Little Ice Age’ in northern Europe.
623
At least you are talking Europe. I would offer the graph of real themometer data for six European cities as summarized by Prof Carl Otto Wiess. And you can see the minimum was in fact in the 1870s.
And I wonder about tree rings when there are no tree rings in the ocean which covers 72% of the planet. 74% if you include Antarctica which has no trees.
Call me a skeptic but I have real concerns about how anyone worked out the temperature of the many oceans before 1500 AD. Yet all these numbers are quoted as proven fact.
250
Humans did not reach the North Pole or South Pole until the 20th century but we are supposed to believe someone can measure the temperature hundreds, even thousands of years later? How do they verify their conclusions? We know it was warm in Roman times as the Romans could run around Scotland in short skirts without being Scotsmen.
170
Doh. If it was “the coolest” then that’s when the warming started. What part of “the trend started going up” don’t you get?
In other proxies, it’s pretty clear the coldest spot was in the 1600s.
China: https://joannenova.com.au/2011/12/chinese-2485-year-tree-ring-study-shows-shows-sun-controls-climate-temps-will-cool-til-2068/
See also Christiansen and Lundqvist and 120 proxies: https://joannenova.com.au/2012/07/medieval-warm-period-found-in-120-proxies-roman-era-similar-to-early-20th-century/
In these long proxies (Yang et al) the warming started in the Southern Hemisphere. What caused that Simon? What force started the warming in the 1600s in the South? It wasn’t CO2.
200
Maunder minimum 1645-1715.
68
Congratulations. You are getting the gist…
190
The winter of 1683-84 was a shocker.
‘One of the four or five coldest winters over the British Isles (& large parts of Europe), and the coldest in the CET record.’
The European climate became a little warmer from then on.
121
There are two parts to man made CO2 driven Global Warming.
The first part says that mankind has increased CO2. That is not true.
The second part is that the increase results in substantial warming, which is also not true. Especially when you consider the Roman period was warmer without a single combustion engine.
But warming is totally irrelevant. It’s whether we humans control CO2. We don’t.
Basically the world is in equilibrium at least on a human time scale. Nothing changes. There are cycles. Peaceful days and hurricanes. Cold years and hot years. Dry years and wet years. But the average hardly changes.
Whether CO2 causing warming. Whether warming is harmful. Are secondary issues.
The proposition that a very slow CO2 increase of 50% in 250 years is man made should have to be proven. And it has not been proven.
But we are being robbed by massive carbon taxes. And when you read the laws, they do not quote any science, only international ‘obligations’ created under vague agreements.
Our problem is that Liberal leader Scott Morrison validated the Paris agreement. So all sides, Greens, Labor and Liberal run with utterly unproven conjecture. The only things real are the rivers of cash and political power.
250
Fact check: False, false, false, false, false, true (there are cycles), tautology, false, false, false, false, false, false, false (The Turnbull government ratified the Paris Agreement in November 2016), false, false.
224
The treaty which came into force in 2016 has a lot of options and stages. These have a UN register.
At any time they can file with the Depository “their instruments of ratification, acceptance, approval or accession”
What Scott Morrison did was sign us up for Nett Zero by 2050. That was completely optional and unnecessary. And betrayed the people who voted for him in the obvious hope that he could pick up the Climate Change vote in the coming election.
As for the first one, “mankind has increased CO2”, which you have declared false.
So why do you personally believe mankind has (substantially) increased CO2. Do you have any evidence other than the ice hockey stick?
140
The summary of transactions as Australia slowly cedes Sovereignty to the United Nations is
29/04/2024 Nomination XXI-6
7/3/2024 Acceptance of amendments XIX-37
24/11/2023 Acceptance XII-1-i
20/09/2023 Signature XXI-10
7/12/2021 Ratification XXVII-17
10/9/2021 Signature XXII-4
17/09/2020 Ratification XXII-3
21/01/2020 Nomination XXI-6
14/12/2018 Withdrawal of reservation IV-8
21/12/2017 Ratification IV-9-b
27/10/2017 Acceptance XXVII-2-f
18/07/2017 Signature XXII-3
8/6/2017 Notification XI-B-16-143
11/4/2017 Nomination XXI-6
9/11/2016 Acceptance XXVII-7-c
9/11/2016 Ratification XXVII-7-d
This is all done by the gnomes of Canberra who are slowly signing away our rights. Prime Ministers make a big show when they travel overseas. But all the time we are being reduced to a mendicant state by the UN. And treated like mushrooms.
200
I am genuinely interested.
It would have to be convincing evidence for the world to spend $1.8Tn a year to ‘fix’ the problem.
If you can declare my statement false, what is your story of man made CO2 accumulating in the atmosphere? For example, why doesn’t all CO2 accumulate in the atmosphere? All living things breathe, for example. Why is there any oxygen left after billions of years? Why is there so little CO2?
140
Simon…
If humans are causing the climate to change, via CO2, then that change must be able to be measured. Yes?
If so, then you must be able to provide the numbers which show exactly how much our CO2 is affecting the climate, and by what percentage. Unless you believe that ALL of our CO2 is affecting ALL of our climate now, and none of the ‘change’ is natural variance?
So, please provide those numbers.
20
Sixty years ago our local Geology professor was aware that the evidence on our foreshore showed that the ocean had fallen four foot in the previous two thousand years.
Oceans can only remain “down” if the missing 1.2 metres of sea water is locked up as ice.
Ice forms at Lowe temperature.
Similarly the oceans are known have fallen at least 4.2 metres in total over the last six thousand years.
It has been cooling , irregularly, for the last 6,000 years.
Little bumps like the medieval blip are of minor significance.
90
Which foreshore was that? Open ocean?
40
Rock platform at Susan Gilmore beach Novocastria.
Similar rock platforms along the coast going south.
20
The harbour access at Ephesus in Turkey has a similar story.
40
Ephesus is a bit different. I visited only a few years ago. The harbour is silted up, like so many. It was shallow and dug out for the Romans to provide safe shelter, not in the ocean. The ships were much smaller and shallow draft. Perhaps the port of Ceasarea was the best actually in the ocean. Like Rhodes.
But also Ephesus was mostly destroyed by an earthquake, which accidentally preserved so much which is only now being excavated on the hillside. More modern than Pompeii. But earthquakes often create apparent sea level changes by moving land up and down. As with the vanishing city of Sybarus off the cost of Italy or the underwater parts of Alexandria.
The port of Ostia is also amazing, silted up. It’s the reason Catholics eat fish on Friday as the pope wanted to keep the port going. It is now better value and better preserved than Pompeii. And excavated by Mussolini.
The problem for the whole mediterranean in fact is the sand from Africa brought on the hot Sirocco. Rome grows about 1cm a year! Much of Nero’s Golden house Domus Aurea is 20 metres down. You can walk the old streets of Rome under the Vatican, with permission. The old cemetery. Teams of archeologists are really speleologists who know how to get to the old streets and buildings. Two thousand years of rebuilding. So I do wonder why some of the oldest buildings like the Parthenon are on the original level. Places like the forum had to be excavated, preserved only because they were buried. And when I first saw the colosseum, it was partly buried too and used as a roundabout.
Beijing has the same problem with 1cm a year dumped with winds off the Gobi, dirty air which most people think is exhaust pollution but is in fact just dirt.
However the coast of NSW is different. I would first eliminate volcanic activity. In Melbourne we have major geological uplift areas along the yarra valley. You can see the tilted strata at Dight’s Falls with the lava flow on one side of the Yarra and uplifted sandstone layers on the other as the river follows the lava flow edge. Volcanic activity was only 30,000 years ago.
But I would have thought the Newcastle coast was geologically stable, but it only takes one earthquake and there was that massive earthquake in 1989.
As the Government site warns “However, they can also occur within stable tectonic regions, like Australia. It is important to remember that large earthquakes can occur anywhere in Australia, and without warning, even in regions of low levels historical seismicity.”
90
Scientists were measuring levels of CO2, or “carbon emissions,” in the atmosphere in the 1800s at much higher rates than are being touted now. These measurements can be found in published historical records that you can look up very easily if you have a device that connects to the internet. There is no need to try to sort out the “divergence problem” in tree-ring proxies.
Simply go to books.google.com. Enter “carbonic acid, atmosphere” into the search field. (Carbonic acid was used synonymously for carbon dioxide, back in the day. I’ll give you a reference for this later on.) Click on “Search Tools.” Then, under “Any View” click on “Full View.” You have now entered into the fabulous library of historical literature that Google has digitized and which you are allowed to read and download for free! The 2nd listing is a good place to start: “Air and Rain: The Beginnings of a Chemical Climatology” by Robert Angus Smith, published in 1872.
Right off the bat in the section “Carbonic Acid of the Atmosphere,” Smith quotes Théodore de Saussure (p. 43): “after many years of observation, the mean quantity of carbonic acid in the month of January in 10,000 [parts] of air is 4.23 [423 parts per million (ppm); the measurement at Mauna Loa in March of this year was 425.38]; but the quantity of carbonic acid in the month of January 1828, which was extraordinary for the mildness of its temperature, rises to 5.1 [510 ppm].” 1828.
Smith offers pages and pages and pages of CO2 measurements—outdoors, indoors, at night, at mid-day, on land, over lakes, in mines… Numbers like (I’ve converted all to ppm): 568, 445, 581, 623, 561, 475, 506, 539, 565, 583, 522, 606, 582, 491, 481, 493, 534, 600, 500, 800, 734, 727… “In a bed-room at night with closed windows, 2,300.”
In the very first chart of 18 measurements that Smith offers (again from the work of de Saussure), none are below 425 ppm.
Page 52: “There is less after rain, and less during high winds.”
Mr. Smith is still on the same subject on page 72, when he offers an example of how to convert the numbers: “Thus .0314 [percent] will mean 314 in a million.”
In the book “Chemistry, Inorganic and Organic” by Bloxam, also published in 1872, at the top of page 69 the formula for carbonic acid is given as CO2. And immediately, we read:
“It has been already mentioned that carbonic acid is a component of the atmosphere, which usually contains about four volumes of carbonic acid in 10,000 volumes of air [400 ppm].”
100
Jo,
Nice article to show the dreadful unscientific work of PAGES2K and related. Have you sent a copy to perpetrators of David Karoly and Joelle Gergis? Some of their work was shonky and retracted, only to rise from the dead later on.
Note that there is no study from the Australian mainland. The Tasmanian dot on the map is a flawed study because there was no appropriate weather station available to give temperatures to calibrate tree ring studies at Mt Read.
I have been unable to discover why the mainland has failed to produce a study we can see. Does anyone know if studies have been done, but not reported? Perhaps unreported because they failed to show any warming to suit the preconceptions?
Geoff S
70
Each of the ups and downs in those very jagged graphs looks like they represent around 50 years. And each of the peaks and troughs look like they represent about 0.5 C.
Seriously? The claimed resolution tests incredulity.
I don’t have nearly as much confidence of trees as thermometers as some do. I don’t have nearly as much confidence in the other proxies presented here as thermometers as some do.
My challenge? Come visit my house and tell me what the average temperature was 50 years ago on this plot of land. Or if that resolution is too fine tell me what it was 1000 years ago. For bonus points tell me the average maxima and minima.
60
At last we are seeing mainstream publication of papers which delve in detail into the proxies behind Hockey stick temperature charts.
That sparse and cherry-picked data set of Mann’s (MBH98) original would have been laughed out of the room in a sensible, non-agenda driven time.
Maybe the tide is just starting to turn, bringing back some real science.
60
“ . . . it is these ocean state changes that are
1:02:28 correlated with the great disasters of the past impact can cause extinction but
1:02:35 it did so in our past only wants[once] that we can tell whereas this has happened over
1:02:40 and over and over again we have fifteen evidences times of mass extinction in the past 500 million years
1:02:48 so the implications for the implications the implications of the carbon dioxide is really dangerous if you heat your
1:02:55 planet sufficiently to cause your Arctic to melt if you cause the temperature
1:03:01 gradient between your tropics and your Arctic to be reduced you risk going back
1:03:07 to a state that produces these hydrogen sulfide pulses . . . “
https://www.youtube.com/watch?v=Ako03Bjxv70
10
I would like to thank all the contributors here. Incredible amount of hidden info which is no doubt deliberately buried. I’ve been following this topic since I read Heaven & Earth by Prof Plimer. So much info there but the above is easily understood. I just wonder about the thousands of bought scientists supporting the IPCC. They can’t all be satanists; but they must be aware of much of the above evidence. By constant denial they make themselves pathological liars. They need to read Revelation 21:8 “All liars shall have their part in the lake which burns with fire and brimstone, which is the second death.”
20
Just finished watching the golf from Scotland.
The telecast was littered many times by pictures of wind turbines way out of context.
There was one where viewers were forced to watch the screen completely covered by the turning monster.
Turning the lights out on the poor.
Turning the middle class into the poor
Turning millionaires into billionaires
Turning Democracies into military Dictatorships
That is their purpose.
60
There are lies built on lies and surrounded by lies in this whole scam to centrally control the global economy. One of the biggest ones is this ludicrous mantra about “carbon storage”, and “carbon sequestration”.
Supposedly in order to make up for all this carbon animals are emitting into the atmosphere we need to capture and store carbon.
The simple obvious truth they fail to tell you is that animals like cattle pigs and sheep (which apparently they think are the only ones that emit carbon) do just that! They store carbon! If animals did not take in more carbon than they released, then the animals could not grow or reproduce! Pretty simple undeniable fact. Yet they have built a whole fake industry around the opposite of the truth!
20
cross posted at World was cooling for most of the last 2,000 years
00