A new paper (like so many before it) shows that the sea started warming half a century before the first coal fired power plant was ever built, demonstrating yet again, the skeptics are right, and CO2 is irrelevant. Despite that, the world’s supposedly top science journal lauded it in excitement because it showed the world had warmed “more than we thought”, and somehow, in their brains, ipso delerium, all warming was caused by man-made CO2 even if it occurred when there were no flights, no cars, and no electricity.
Life in 1820 was the ultimate “Net Zero” world: literally every flight was grounded and all petrol stations were closed for 80 years yet the world warmed.
Absurdly, evangelistic headlines decreed the world was “hotter than we thought”, had breached 1.5C earlier than we thought and three hundred year old sea sponges were telling us to hurry up and install solar panels. The point that the geniuses who are 99% certain didn’t know how hot the 1800s were until last week isn’t exactly inspiring. But the political activists at Nature felt that breaching the Paris Agreement (before it was even made) was big news and said so in their first paragraph. All the major nations are failing to meet their Paris targets anyway, and if the targets were expired before they were even set, that only makes the UN look stupid. And to top that off, somehow a thousand thermometers, ship buckets and tree rings have just been superseded by some old Puerto Rican sponges.
As it happens the team at Nature also seem to have forgotten they already announced in 2016 that global warming started 180 years ago. Perhaps they don’t read their own papers? (That was Abram et al).
Really, this new paper makes a great study in just how bad current science communication is — every single person in the chain of nonsense failed to see the bleeding obvious. The academics, the journal, the press release team and the “media” all missed the most important message the corals were shouting from the bottom of the ocean. Humans don’t control the climate.
[Nature] The world has warmed 1.5 °C, according to 300-year-old sponges
By the time that official temperature records began, global temperatures had already risen by half a degree.
The planet has already passed 1.5 °C of warming, according to a new measuring technique that goes back further in time than current methods. At the 2015 Paris Climate Accords, nations agreed not to exceed 1.5 °C, a guardrail of climate change.
“We have an alternate record of global warming,” says coral-reef geochemist Malcolm McCulloch at the University of West Australia Oceans Institute in Crawley, who is lead author of the study. “It looks like temperatures were underestimated by about half a degree.”
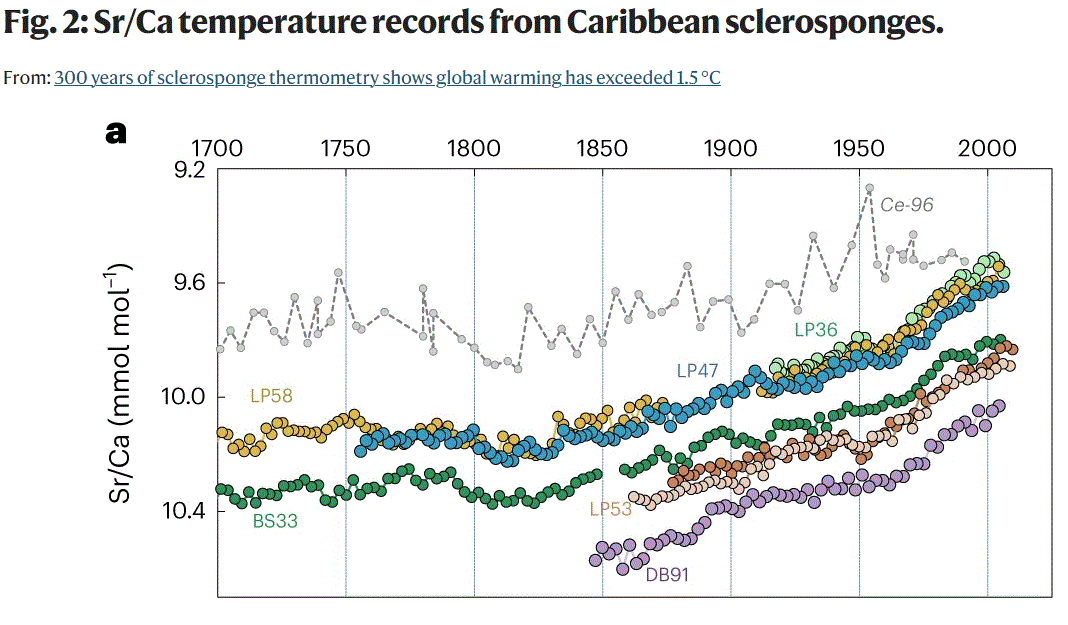
Even though the paper says the warming started in 1860, the data shows it started earlier, more like 1820. Apparently the Sr/Ca ratio is a good proxy for the temperature they say.
But 90% of human emissions have been emitted since World War II.
Source: OWID
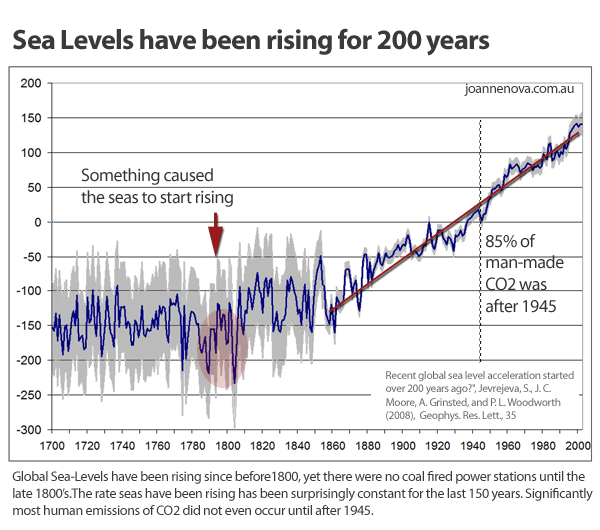
It does however look similar to graphs of rising sea levels that we’ve known about for years.
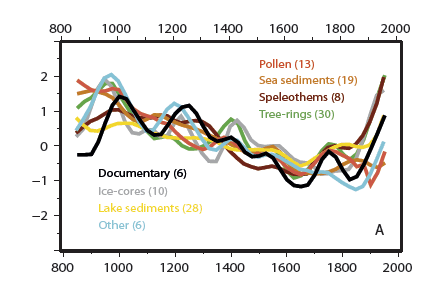
And a lot like graphs of 120 proxies from the Northern Hemisphere:
Ljungqvist et al.
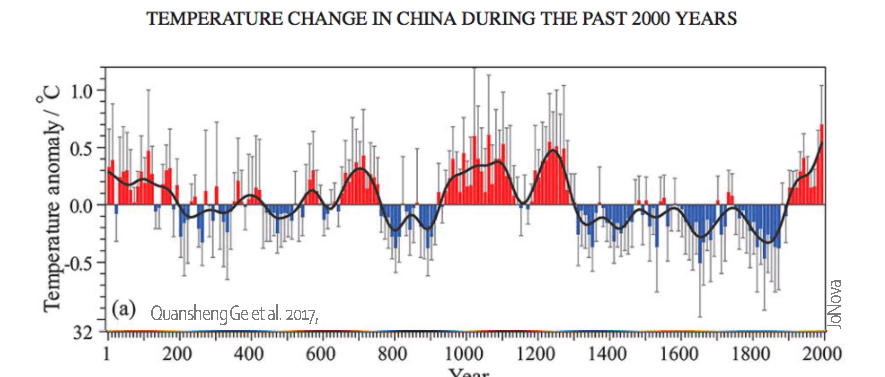
And other proxies from China
Absurdities of the modern era — that newspapers all over the world tell us CO2 is even more dangerous than we thought because of some sponges in the Caribbean.
REFERENCES
McCulloch, M.T., Winter, A., Sherman, C.E. et al. 300 years of sclerosponge thermometry shows global warming has exceeded 1.5 °C. Nat. Clim. Chang. 14, 171–177 (2024). https://doi.org/10.1038/s41558-023-01919-7
Abram, et al (2016) Early onset of industrial-era warming across the oceans and continents, Nature, VOL 536, p 415
Christiansen, B. and Ljungqvist F. C. (2012). The extra-tropical Northern Hemisphere temperature in the last two millennia: reconstructions of low-frequency variability. Climate of the Past, 8(2):765–786, 2012. [abstract] [PDF] [NASA copy] [Discussion on CA noted a lack of complete archives and code]
Jevrejeva, S., A. Grinsted, J. C. Moore, and S. Holgate (2006), Nonlinear trends and multiyear cycles in sea level records, J. Geophys. Res., 111,
Jevrejeva, S., J. C. Moore, A. Grinsted, and P. L. Woodworth (2008), Recent global sea level acceleration started over 200 years ago?, Geophys. Res. Lett., 35, L08715, doi:10.1029/2008GL033611. [PDF]
Ljungqvist, F. C., Krusic, P. J., Brattström, G., and Sundqvist, H. S (2012).: Northern Hemisphere temperature patterns in the last 12 centuries, Clim. Past, 8, 227-249, doi:10.5194/cp-8-227-2012, 2012. [abstract] [PDF] or try this [PDF] [CO2science discussion]
Quansheng Ge et al, Characteristics of temperature change in China over the last 2000 years and spatial patterns of dryness/wetness during cold and warm periods, Advances in Atmospheric Sciences (2017). DOI: 10.1007/s00376-017-6238-8
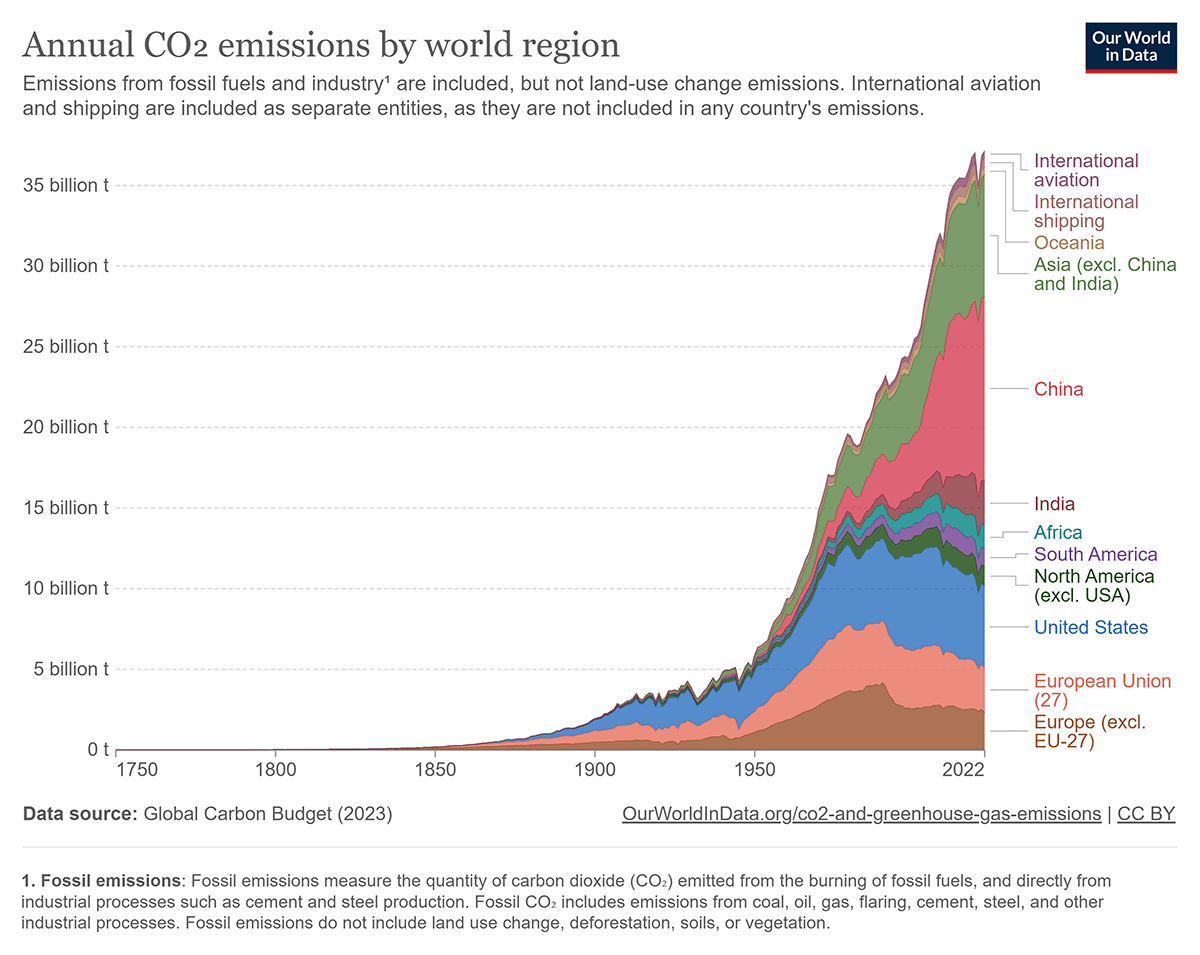


That second chart – but, but… Where is Austraya??
110
In with the tiny Oceania section at the top?
120
Exactly.
100
The population of India has overtaken that of China – but you would not now that from the Our World in Data Graph
India’s CO2 emissions must increase substantially to catch up with China
20
Every new “climate change” “discovery” involves some new revelation that is “more (or worse) than we thought”.
You can immediately tell it’s a lie because we know these anti-science activists who identify as “scientists” don’t actually think.
They have to keep an endless supply of increasingly worse scary stories arriving to keep the highly lucrative and easy to get research $$$$ flowing.
300
“You can immediately tell it’s a lie because we know these anti-science activists who identify as “scientists” don’t actually think.
They have to keep an endless supply of increasingly worse scary stories arriving to keep the highly lucrative and easy to get research $$$$ flowing.”
Those statements are perilously close to meeting the Illinois Law definitions of defamatory statements
Imputing that a person is unable or lacks the integrity to perform one’s employment duties;
Imputing that a person lack ability or otherwise prejudices one in one’s profession;
222
‘ … otherwise prejudices one in one’s profession.’
AGW is accepted as scientific reality and there are careers to be had, so the system has become corrupted.
160
It seems to this uneducated 78 yo that the scare must be weakening. Even young people that I know understand that the climate is pretty good right now and that what storms, fires and floods are pretty much like others that they have either experienced or their parents have told them about. At school pickup ( I am an honorary mum) the weather bureau is seen as a joke. They are concerned about power prices however and they are quite acceptable to the notion that wind and solar are expensive, unreliable and leading us to a very poor future. It is a pity that the media are so reluctant to present all the news including that which is not part of the decades of the GW meme. You would think that good news would be well received. The trouble is that good news for the many is bad news for the few and the few see their golden goose about to fly away.
70
So scientists get it wrong again. It’s always worse than they thought and now the warming started earlier than the Industrial Revolution. Quelle horreur!! All of the pretty charts and graphs they produce as evidence serve only to fill in the lack of proper scientific input – rather like a childs colouring in book.
220
The Industrial Revolution started in Britain in about 1760.
10
Check the annual emissions of CO2 graph.
20
What was the lag indicated by ice core data, in which co2 increases lagged behind temp increases again?
110
Carbon dioxide levels follow the temperature by about 800 years. The Medieval Warm period peaked 800 years ago, so that proves (1) That most of the increase was natural CO2 from the deep Ocean which has a 275 to 1 ratio mixing with the Atmosphere over a period of 800 years. (2) Independently confirmed by Isotopic evidence which shows that a maximum 4 percent of the 415ppm of CO2 is man-made and volcanic, which is 6ppm for Man-made CO2 emissions and 11ppm for volcanic emissions. So that means that 115ppm of the increase since 1888 was natural, and 6ppm was Man-made. So most man-made emissions are adsorbed by the Oceans and most of the increase in CO2 is natural outguessing caused by the Medieval warm Period.
Although Climate scientists “have” to be “Corrupt” to be allowed on the mainstream Media. 800 years is confirmed by Ice Core Data and the study of Thermal Inertia in Oceanography
50
They need to look further back than 300 years. That is recent in terms of the geological history of our planet – even in our human history its recent. They should take these so-called studies back to the last interglacial – that would put it into context.
140
you appear unaware of thousands of other studies that do just this.
216
Everyone that watches the BBC where you learn science and history, understands that the the 1800s
were a magical time that we must aspire to return to ASAP, ignoring of course, the bad parts.
https://www.britishtv.com/29-great-british-period-dramas-set-in-the-victorian-era/
Men were men (which we can now correct), and women were virtuous until scurrilously tempted by a rouge.
There were no nasty climate change causing cars, and transportation in carriages was a marvelous experience except when the horses occasionally pooped in your face whilst jaunting.
The BBC correctly does not depict that happenstance as to not dampen the romance and public demand to return non-anthropogenic weather.
190
That should read ‘rogue’ … spell check and dyslexia, an unfortunate combination.
100
The BBC also skims over life expectancy, disease, social conditions – and the relatively primitive state of pain control in dentistry back in about 1850.
Oddly.
Auto
30
I have read that CO2 stays in the atmosphere for about 10 years. If the 10 year estimate (guesstimate) is like everything else associated with climate change the 10 years is an average.
Perhaps then, CO2 emissions at and near ground level, such as from burning fossil fuels for transport, are available to plants for conversion to carbon (the element carbon) and oxygen, last only a few months and up to a year. So to get the 10 year average, the CO2 emitted by the elite travellers while flying from climate conference to climate conference, or to concerts and sports events for example would stay in the atmosphere for about 20 years
90
Surely not related to the Maunder Minimum – Little Ice Age ending around 1850, and warming from coldest peak period during that cycle.
sarc
130
Is that sponge a distant relative or ancestor of UN IPCC Officials?
130
No. It’s a bit brighter than that!
160
relative. That is basic phylogenetics.
013
Have a look at the timeline of the terminus of the glacier in Glacier Bay Alaska
It started to retreat between 1760 and 1780 and was well underway by 1800 and the main section was ice free by 1860.
https://pubs.usgs.gov/of/2002/0391/images/GlacierBayTerminus.gif
80
It’s just confirmation bias. Grant confirmation bias
130
The proponents of “Climate Change” should come clean and admit they are sponging of everyone else ….
140
Ahh, the end of the Little Ice Age – “It was the best of times, it was the worst of times”, as Charles Dickens wrote (1812-1870). He penned this phrase in his book ” Tale of Two Cities”, but I’m sure he was referring to Climate Change, even back then.
90
This corresponds with the end of the “Little Ice Age” around 1850 which would allowed more snow to melt
The Little Ice Age was a period of wide-spread cooling from around 1300 to around 1850 CE when average global temperatures dropped by as much as 2°C (3.6°F), particularly in Europe and North America.
90
What happened in 1300 AD to make sea level fall so dramatically?
40
Ice and snow accumulation
30
A mechanism for the dramatic snow and ice accumulation and sea level fall.
‘In 1300 Hekla had a VEI-4 eruption, which started on 11 July and lasted for a year, was the second largest tephra eruption of Hekla since Iceland was settled, covering 30,000 km2 (12,000 sq mi) of land with 0.31 km3 (0.074 cu mi) of tephra.’ (wiki)
40
In a world where millions earn their living from man made CO2 driven rapid tipping point Armageddon Global Warming, things getting warmer here and there, there and then provide a living to so many.
It’s not that anyone said the temperature had to stay constant given that it varies 10-20C every day anyway, but we are still a very long way from drowning and the hell fires are not noticeable this year and there seem to be a few downsides from blowing up your coal power stations.
Not to quibble but surely the people without gas or wood or coal or petrol/diesel/oil as an alternative are a bit inconvenienced if all they have is electric refrigeration, electric lights, electric airconditioning, electric heating and get around in electric cars. Or want to work with machinery or fork lifts or make metal or anything else. There are always books to read, by candlelight.
But they can always wait until the sun comes up. Or the wind begins to blow enough to get the windmills working and not so much that they stop. Or that trees come down and bring down the power lines.
Still we are saving the whole planet and can sleep easy. The spongers tell us so.
150
Almost half a century ago scientists were concerned about a series of observations indicating that sun’s photosphere temperature had dropped by close to 0.5%, and suggested that if the change persisted we would see an increase in glaciation around our planet.
The argument was that the surface temperature of the Earth was highly sensitive to the temperature of the sun’s surface.
These days, NASA assures us that variations in irradiance over the 11-year solar cycle are less than 0.1%, even if some spectral components such as UV can vary by up to 10%, and solar irradiance variation plays no part in the longer term rate of warming of the Earth’s surface.
20
NASA’s statement does not accord with the best fit to European temperatures I have ever seen or could imagine, Prof Carl Otto Weiss and his team. The link opens at the graph, 744 seconds in.
I am staggered at the quality of the fit. 12 inflexion points from just two sine waves, the 250 year De Vries Solar cycle (the one NASA says does not matter?) and the ocean 65 year PDA (multi decadal oscillation). And they did this by blind Fourier transform! So they did not pick the cycles, the quality of the fit did. And CO2 was not needed in any part.
(Fourier transform is mathematically fitting a curve with sine waves, regular cycles and there are many observed of which two and only two fitted the data perfectly)
There is also the point that the data came from 6 European cities from the start of the industrial revolution, which started nowhere else and at no other time.
Now their graph is very different to the traditional hockeystick. It shows a plummet to a deep minimum 1860 which may explain why everyone else starts their graphs at 1860.
It also raises the question of why the European temperatures, the only ones take by direct measurement, give a different result to say those at the South Pole or bottom third of the planet. And makes you wonder whether the proxies are any good because the NASA graph is wrong for Europe according to temperature data by direct measurement at the time.
So we have an answer, at least for Europe. And it is very simple and startlingly good. For example it predicted the plateau at 2010-2020 and a steep fall thereafter. No one else is predicting this.
I am not convinced that the whole Global Climate Warming industry has the data right. And I suspect they are now desperately trying to manufacture warming from a cooling planet. Hiding the decline, again.
70
Thank you. Bad news indeed for the cretins in climate science. It will not take hold until the temperature drops some more, that crops are affected by reduced growing seasons and/or declining cropping area( for every degree of cooling the wheat line in Canada moves South by 100 miles) and people start dying due to cold weather and expensive power.
10
As Oceans dry from water loss t space and astroid and meteor impacts, the brine of chemicals get more concentrated.
01
This paper has been overhyped in the news media, it is geographically limited. It is a interesting addition to the evidence though.
The chart showing almost no fossil fuel emissions prior to 1850 neglects the significant land use change and deforestation that was occurring at the time. CO2 concentration started rising slightly sometime in the late 1700’s.
116
The deforestation stopped with the discovery of coal/coke instead of wood/charcoal. And steel replaced cast iron.
Prior to the discovery of fossil fuels other than wood, most of Finland had been stripped of trees. And a single timber galley could take 3,000 oak trees. They like all boats were held together with wooden pegs. It is held that no tree in Finland is over 200 years old.
Iron started as iron cladding and then the transition was made to iron plates. And steel.
The reforestation of Europe began with the industrial revolution, restoring the forests. This is the opposite of the common story.
This reforestation has accelerated with the growth of CO2. As I have pointed out, NASA reported 14% more trees between 1988 and 2014 and CO2 went 14%.
So the whole story of change of land use and deforestation in the modern age is the reverse of the truth. With fertilizers the yields soared and the world is growing more from less land. Cities are going up, not out. The limit is the transit time and the cost of services, except perhaps in Australia. 80% of most people live in the country. Melbourne, Victoria is extreme with 83% of the state in Greater Melbourne. (Compare Germany 83 million and only 3.6million live in Greater Berlin)
Anyway, the real story of industrialization is the complete opposite of the official one. It saved the countryside.
More CO2 means more trees. More CO2 and fertilizer means less land is needed, less work. But fundamentally the idea of trees sequestering CO2 and so lowering CO2 is proven wrong. Simply because CO2 is in rapid world wide equilibrium with the oceans which maintain it to within 1% of the value across the planet, no matter what humans do.
Which means carbon farming and carbon credits are complete rubbish. As for whether CO2 dramatically increases temperatures, if it really takes 250 years to notice any change, what is the problem? And 50% increase in CO2 in 250 years is very slow and natural. Until we can do something about the 98% of CO2 freely dissolved in the vast oceans, the world decides how much CO2 is in the air.
210
“Anyway, the real story of industrialization is the complete opposite of the official one. It saved the countryside.”
+1…
Grimms fairy Tales… The axe man, the charcoal burners, wasn’t long before England’s forests were depleted, Robin Hood
wood’ve had a hard time hiding in Nottingham Forest, a century r two anon.
80
Yes, from the many documentaries I have watched, much of England was stripped of trees for agriculture even in Neolithic times, 3,000 years BC. I loved time team. If you have a sense of history, it is thrilling stuff to find Roman coins or even buildings in your backyard. (All we get in Australia are sacred rubbish heaps, if you are lucky.) But the hills of Cornwall for example, Dartmoor in particular and being poor soil, poor rainfall, exposed particularly to salt and wind, the area remains blasted heath.
60
I live close to dartmoor. It is a good place to measure climate. To this day you can see a medieval village which was the epicentre of farming at a height not possible today. There is also a bronze age village which again supported humanity high above current levels.
The domesday book recorded villages, farms, oxen and ploughshares in dartmoor villages during the MWP before the population was forced lower by climate change.
The official web site for Dartmoor mentions it being warmer in medieval times.
80
Puerto Rican sponges eh… nice place for a holiday, or a 6-month research study, diving & swimming & tequilas at sunset…
60
I saw this in Tahiti. American ‘researchers’ supervising very young women in bikinis on the beach measuring acidity in fish tanks with various crabs and the like while they bubbled CO2 in. All this on Bora Bora, an beautiful and idyllic island you could drive around in 20 minutes. I wonder what they discovered? Climate change probably. Yep. For sure.
40
Chart b shows a strong correlation with CO2 emissions.
https://www.nature.com/articles/s41558-023-01919-7/figures/2
Hockey sticks everywhere you look. Mann was right, no fraudulent activity here.
118
Good catch, it shows that temperatures began to rise around 1820, while CO2 remained relatively flat for a couple of decades.
As the Northern Hemisphere warmed the oceans released more CO2 into the atmosphere. My correlation is more believable than yours.
90
If you look without bias CO2 follows…
90
The Tambora eruption in 1815 had a momentous impact on world weather and when the dust eventually settled, global warming began.
60
Yes, data tells any story you want if you look hard enough.
30
The Law Dome ice cores show CO2 concentration rising from 285 ppm in 1850 to 296 in 1900, and 313 in 1950.
50
Degassinmg from a warmer ocean
40
Yes, but is the Carribean representative of the planet? It is a pot boiler which creates the Gulf Stream which in turn heats most of Western Europe. And so many of the hurricanes which hit the area and the massive storms and tornadoes which sweep up the US. I would have thought it was the epicentre of solar ocean heating, the very worst place on earth to measure global temperature! Its rivals might be Antarctica, top of Mt Everest or the Andes, the Aral Sea or Singapore.
70
I think the key figure in the study is 4d. The authors have determined the temperature sensitivity of the Sr/Ca ratio by regressing their measured Delta(Sr/Ca) values against the HadCRU oceanic temperature series between 1960 and 1990. The implication is the site is representative of a global average SST. However, immediately outside this calibration window there is a divergence issue between the temperatures estimated using the Sr/Ca-T relationship and the HadCRU oceanic temperature series. This suggests to me that the site is recording local temperature and is not representative of a global average SST.
20
yes. This.
00
There is a measuring issue with SST. Measurements from a bucket over the side moved to predominantly intakes on engines around 1960. Also, the data is very sparse in the majority of the oceans before then, let alone before 1900.
Plus, it’s put together by clowns. The Had guys didn’t notice the hemispheres swapped nor an artificial seasonal signal was introduced.
The sponges have bigger brains.
10
Then it is not possible to verify the calibration in any meaningful way. I’d rather see a calibration of the Sr/Ca ratio directly against the immediately local to the sponges temperature rather than through any supposed teleconnection with a global SST. The incorporation of Sr into the carbonate lattice can be determined thermodynamically and ab initio calculations are possible. However, there are ‘vital’ effects largely related to a species metabolism and kinetics of exoskeleton production. These may vary in time and space.
20
More laughable lunacy from their so called scientists, but even Wiki tells us the truth sometimes.
At the peak of the previous Eemian interglacial temps were much higher than today and global sea levels were 20 to 30 feet higher as well.
And Human populations were tiny then and all Humans during the Eemian were hunter gatherers.
And Hippos etc swam in the Rhine and the Thames. Read the Wiki link for yourselves.
https://en.wikipedia.org/wiki/Eemian
71
Sorry. A reply to #16
That was the point of showing the other graphs.
Of course it does because it’s not an example of fossil fuel use.
Slightly? What is the size of error bars on that measurement?
I won’t remind everyone of what I think of the Keeling Curve, just that NASA gave up on its third attempt to measure global CO2 levels to the nearest ppm using 21st C technology and the Keeling Curve showed that the rate of CO2 rise continued going up during Covid lockdowns. But you know that CO2 levels went up in the early 19th C.
60
[…] From JoNova (joannenova.com.au) […]
20
Here’s a quote from the co2 Coalition Scientist’s fact 15 about the much warmer Eemian inter-glacial when temps were 8 c higher than today and very little ice at the Nth pole and yet the polar bears survived. Here’s their quote.
“Recent research by the Niels Bohr Institute (Dahl-Jensen 2013) was the first to target ice accumulated in Greenland during the previous interglacial period, known as the Eemian. The results revealed that the Eemian interglacial warm period, between 130,000 and 115,000 years ago, was much warmer than previously thought. In fact, it was, 8°C (14.4°F) warmer than today. The implications are enormous. Even though the temperatures during the Eemian were 2.5°C (4.5°F) higher than even the most aggressive IPCC predictions, the Greenland ice sheet lost only a quarter of its mass. While 25% is significant, it is far less than the predictions of total ice elimination in response to far less warming. Also, polar bears evolved about 150,000 years ago and survived the Eemian warm period even though there was seldom any polar ice”.
The polar bears survived. Greenland didn’t melt”.
Source(s): Dahl-Jensen, Niels Bohr Inst, http://www.nbi.ku.dk/english/news/news13/greenland-ice-cores-reveal-warm-climate-of-the-past
50