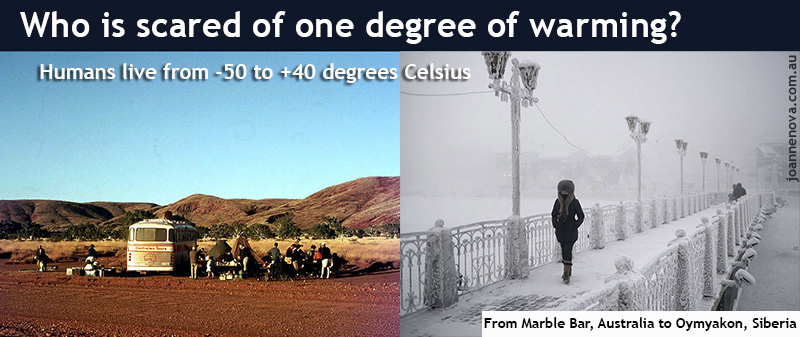
Humans live in a 90 degree range from Marble Bar, Australia to Oymyakon, Siberia. | Photos: Marble Bar, Wilford Peloquin, Oymyakon (and more glorious ones) by Amos Chapple.
The “hottest ever” headline is misleading
While the UAH satellite measurements are the hottest by far of the 44 year satellite record, nothing about the “hottest ever” media frenzy makes sense — not for health, history, the long term, or human biology. It’s only the “hottest ever” if we ignore most of the last ten thousand years. It’s just another attempt to scare people out of their money.
The latest UAH satellite measurements may be affected by the water vapor launched into the atmosphere by the Hunga Tonga volcano. There don’t appear to be any clear details about that, but even if we accept this as is, it’s still nothing to spend a trillion dollars on:

In the big scheme of human history, the world has been a lot hotter and a lot colder. Homo sapiens are 37 degree animals who retire to warm climates, not cold ones. Most people on Earth live in the warm tropics, not the cold poles. Two hundred million years of evolution mean mammals are made to deal with temperature change. We live in places that range from minus 50C minimums to plus 40C maximums (-58F to 107F). That’s a ninety degree temperature range (or 160F), and yet we’re supposed to panic if the world heats by half a degree more?
The hottest inhabited place on Earth is probably Kebili, Tunisia, where 60,000 people live and the average July maximum is 41.7°C (107F). And Marble Bar, Western Australia, has had an average of 41°C in January for the last 100 years (106F). Fossil Fuels make it possble. Give the poor air conditioning!
The coldest inhabited place is Oymyakon, Siberia, Russia, where 500 people live even though the average temperature for January is -50°C (-58F). These are the average temperatures, not the hottest and coldest days.
Almost every day of the year we deal with five to twenty degrees of warming, and that’s just dawn to afternoon tea.
Humans hate the heat right?
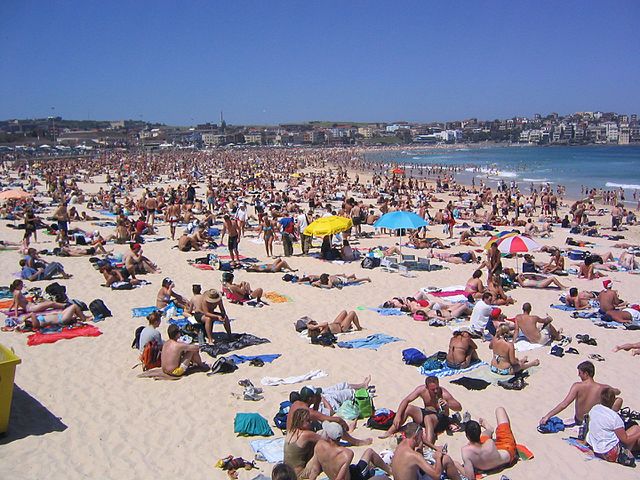
Bondi Beach, Sydney | Photo by Phil Whitehouse from London
Cold is the big threat to crops and lives, not heat
Human mortality rises 6 – 20 times higher in winter, even in hot cities like Brisbane, Australia. The biggest climate threat humans face is the next ice age. Twenty thousand years ago there were walls of ice a kilometer high over New York — that’s 2,000 feet of frozen water that has to melt before you can plant one plum tree.
The “Hottest Ever September” was just the hottest in the 40 year satellite record. The world was likely hotter in Roman Times, hotter in Minoan Times, and hotter during the Holocene peak 7,000 years ago. Sea levels were 1 – 2 meters higher then, when humans lived in mudhuts and teepees. Yet somehow humans thrived.
Seven thousand years ago the world was hotter than even our “hottest ever September” and yet the Great Barrier Reef survived, the Amazon forests grew and even polar bears and penguins were not wiped out. Only 6,000 years ago the world was warmer and the Sahara was lush green and wet.
In the West, wise academics could be speaking up to give us some perspective, yet they’re silent. What do taxpayers pay them for if not this? Our public funded media could be giving us the whole truth and nothing but the truth. Our ABC, BBC, CBC and NPR have specialist “science units” for reporting science, not just the one-sided propaganda that screws money from taxpayers, and feeds childhood anxiety.
These institutions have no problem reminding us how CO2 hasn’t been this high for 4 million years, but they forget day after day that temperatures have been and for thousands of years.
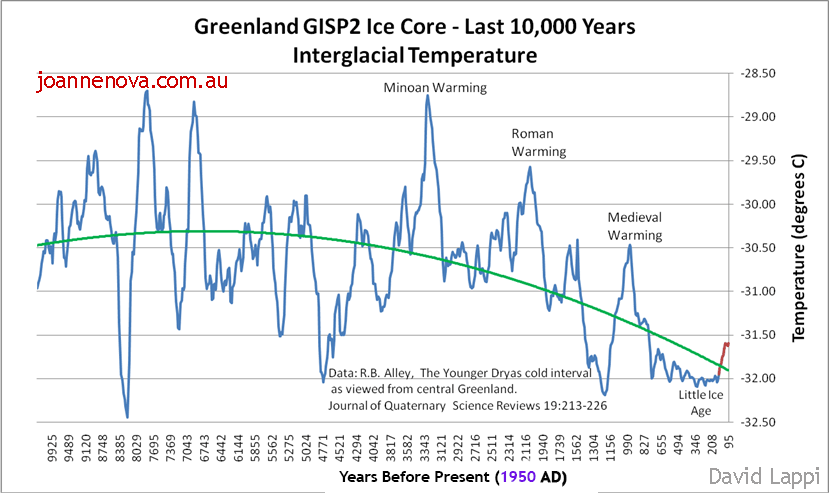
UPDATE: This graph shows the ice-core data up until 1855. The last 150 years (1705 to 1855) are highlighted in red to show the warming as the Earth began coming out of the LIA.
Sea levels have been falling for 7,000 years:
Western Australia is one of the oldest and most stable parts of Earth, making it an ideal place to study sea levels. We’re worried about seas rising by 3mm a year (and only after the satellites were “adjusted”) but the oceans rose 125 meters, stayed high for thousands of years and have been falling for most of human civilization.
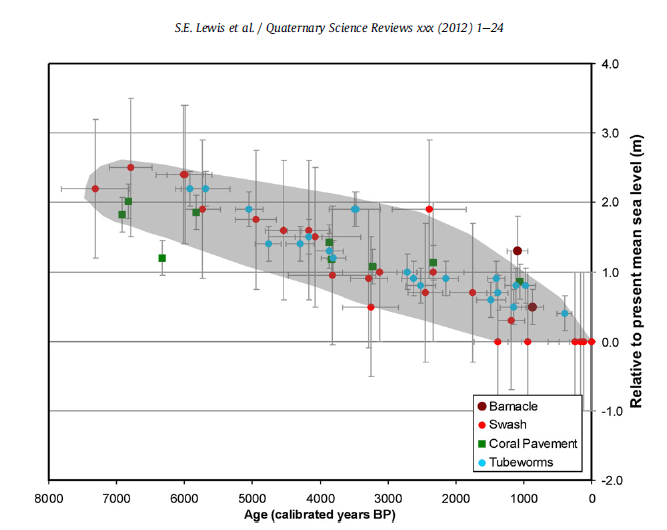
Sea level has been falling for 7,000 years in Western Australia
Save the world from witchdoctors. Teach children geology and the history of the Earth.
___
PS: Any miners reading this with photos of Marble Bar they don’t mind me using? Please send them in. There are surprisingly few photos available on any copyright-free libraries. Somewhere out there someone must have a photo of shimmery heat rising off bitumen!
REFERENCE:
Lewis, S.E., et al., Post-glacial sea-level changes around the Australian margin: a review, Quaternary Science
Reviews (2012), http://dx.doi.org/10.1016/j.quascirev.2012.09.006 [abstract] (paywalled).


.jpg)
.jpg)
As I have said many times before, warmists tend to believe that the earth is unchanging. I call them staticists for lack of a better word.
Civilisations have thrived during the naturally warm periods of the Minoan, Egyptian, Roman and Medieval eras.
Plus, we are coming to the very end of a rare interglacial. As the world cools, it will be impossible for civilisation to survive without coal, gas and nuclear power stations (and real hydro, not SH2, where possible).
The idea that the earth and universe is static is a very primitive one and articulated by Aristotle in “In the Heavens” 350BCE.
It is only in the last 100 years or so that the ideas of Alfred Wegener (1880-1930), a real climatologist, geologist, geophysicist, meteorologist and polar researcher came to be accepted that the earth is not static. Among other ideas he conceived of continental drift which led to plate tectonics.
However, as early as 1840 Louis Agassiz (1807-1873) hypothesised that much of North America was once buried under glacial ice up to 3km deep and that climate must change.
Milutin Milanković (1879-1958) also discovered natural cycles in the climate.
Warmists have to do a lot of catching up with modern thinking.
282
Catching up? Warmists don’t even know where the starting line is.
150
The powers that be are crying wolf again. Fearmongering has become the norm the MSM, really how do thinking individuals believe such outlandish, non scientific tripe is beyond me. It’s now like every computer model must be true, regardless of the absurd input. BoM and others have ‘adjusted’ past temperatures to make us seem warmer. Reasonably sure 1979 was chosen to start the ‘global warming’ phase because in the 1970’s we were all going to freeze but it warmed slightly and the saga is still rolling on today.
291
Dave:
The start of a trend looks good if you start at the minimum. That’s why the “we will all be fried” scams start at 1850 (a cold year) or 1962 (NASA because it was a cold year in the northern hemisphere or 1979 because it too was a cold year in the USA and coming just after the warm summers in Europe in 1975/76 was noticed by many. (Equally it allowed the predictions of the Coming Ice Age before 1979 by a lot of scientists to be ignored).
The following shows the effect of starting during a cold time into a warm time.
3.6℃ climbing to the Holocene Optimum (2.1℃ above the average temperature in the last 10,000 years)
2.0℃ above the average in the Minoan Warming
1.2℃ from the Iron Age cold spell into the Roman Warming
The Medieval Warming was only about 0.3℃ above the average but climbed 1.8℃ from The Dark Ages.
The temperature in 1985 was 0.8℃ below the average for the last 9,500 years and it hasn’t reached the average despite the Hot Air from the IPCC.
201
everything you followed with is ignoring the fact that good statisticians (ie not some untrained guy using excel) dont do this.
The trend in a fragment of a continuous data set can be calculated to account for end point biases by putting confidence limits on the estimate of the slope.
511
Thank you for pointing out that Climate Scientists aren’t good at statistics (because this is their way of scaring the public).
Should we start the calculations for the first 5 thousands of the Holocene or the last 5 thousand years as the temperature trends cooler?
In any case I assume that taking a 43 year period and claiming that this is the only thing we should become hysterical about is your thoughts. Especially as 33 years ago those climate scientists (the noisy ones) were claiming that we would see 3℃ warming and 2 metre sea rise (to obliterate The Maldives & other islands) within 20 years.
140
If you care to look at published scientific articles you will see the methods clearly explained by the scientist authors.
As for all those other time periods that you cite, you do realise that you are using data collected by, horrors, climate scientists.
110
Nothing in that bit of intellectual priggishness in any way diminished the core of G No. 3’s post.
60
Except that it is a straw man. No one is doing what he suggests. But he is appalled that it could be done. (though it isnt)
35
Gee Aye:
I said predictions 33 years ago. e.g.
1987: NASA’s James Hansen predicts world 3C warmer by 2020.
1988: UN spokesman world will be 4℃ warmer and Antarctica 5.5℃ by 2030
1988: Maldives completely under water in 30 years
1989: Rising temperatures and seas by 2030
A Commonwealth Expert Group estimated that there was a 90% chance of the planet warming 1-2℃ and sea levels would rise between 1 and 4 metres by 2030. Catastrophic flooding across large areas of India, Egypt, China, the USA, the UK, Holland, and atolls in the Indian & Pacific Oceans. Reported in The Canberra Times Jan. 26
1989: Rising seas to ‘obliterate’ nations by 2000 If nothing is done within 10 years Quoting UN Officials
1989 The director of the New York office of the U.N. Environment Program (UNEP) says entire nations could be wiped off the face of the Earth by rising sea levels if the global warming trend is not reversed by the year 2000. As global warming melts polar icecaps, ocean levels will rise by up to three feet,
Crop failures would create a flood of “eco-refugees”.
1989: New York City’s West Side Highway underwater by 2019 from higher temperatures melting Ice, and you’ll have signs in restaurants saying water by request only: James Hansen NASA
He also said that the Earth would warm by 1℃ every decade and that by 2018 The Maldives, and Florida beaches would be under water by 2018.
Although Hansen was reported to be unapologetic in recent years claiming that it still could happen,
70
The presentation of these dramatic “hot Septembers” as catastrophic is little more than advertising for the IPCCCCC and its controllers.
The scientific assessment of the world’s “temperature” is another thing entirely and a full description of what’s going on would be huge.
A quick summary of the current overheating drama is that the data is flawed and fails to satisfy basic statistical requirements and ignores due process needed to be taken seriously.
The two graphs provided show undeniable long term cooling in the Greenland area and falling sea levels world wide. The undeniable conclusion from these graphs is that ice has been stacked away over the last 7,000 years as sea levels fell in company with a cooling world.
Recent worldwide bushfires are a disgusting example of human ugliness; these fires are the result of deliberate action taken to reduce preventative measures like removing dangerous growth from near residences and preemptive burns.
The Victorian wildfires were deliberately planned to boost the impression of Global Warming.
241
KK,
If you torture data enough it will tell you anything , especially if its corrupted . Models don’t generate data , they generate probabilities . The boundary between fantasy and reality has become blurred . We have a lot to learn .
40
About those bushfires. Were they worse than in previous times? Or was there some other factor? Why did those fires burn for so long?
My observation was that professional firefighters just do not extinguish bushfires. Volunteers do, because they don’t want to have to come back tomorrow. But in recent times the professionals have the authority, and at times use that authority to prevent volunteers from doing work they want to do.
When I was young, fighting fires in the north west region of the Blue Mountains, when there was a fire that had to be put out two teams would start at the back of the fire , armed with rakes and axes and a day’s tucker and drinking water. One would go each way, securing the edge of the fire, until they met the other team coming the other way. With bigger fires it was more complicated, but hand tools were the method used, and the method was very effective.
As time went by, bulldozers and road graders came into use, and chainsaws, and made access much easier. But still it was the hand tools that extinguished the fires.
In 1994 there were bad fires north of Sydney which forced on government the realisation that they had been caught out on resourcing the fighting of these fires, including the issues KK mentions here. Since that time the RFS has virtually been given a blank cheque book, so that they now have a marvellous collection of machinery, but still do not extinguish bushfires.
Is this because with all their shiny gear they scorn the hand tools? Ot is it because new safety regulations stop them from going out into the mountains by moonlight with hand tools? Even today, trucks with water are not much use in the mountains. And aircraft? My observation there is that if three quarters of the aircraft were left in the shed the fires would be out much quicker at far less cost. Besides, for aircraft it is deadly dangerous work
Which reminds me of the biggest bulldozer that ever I saw – the Rylstone council’s ancient angle/tilt bladed D8 coming over the top of the mountain in a shower of sparks in a gale at 1 o’clock in the morning as they successfully lit a back burning operation in the teeth of the wind. I have seen bigger dozers, but none that looked that big.
No modern OH&S regulations there!
60
I’m surprised not more people question why we are all going to die if temperatures are going to increase by 1.5 degrees but it moves up and down by 10 degrees on most days and nights. But the arguments get even more ridiculous when excess cold or heat can be managed by air conditioning or heating. The only threat from climate isn’t the temperatures but the policies. People may die if they don’t have access to air conditioning or heating during extreme weather and this will only occur if energy is way too expensive or there are blackouts. For a hundred years due to man’s ingenuity and air conditioning the number of people killed in climate events has fallen by over 90%. If global warming / climate change was a real threat the deaths would be going the other way.
270
There’s no doubt it’s a warm period in recent history. In the 365 year Central England temperature mean series, 2022 was the hottest year by some margin, and 2023 is currently matching it. But the highest temperature in 2022 was 7C higher than 2023, 40 v 33C, statistics always throw up oddities.
UAH indicates it is likely a similar situation globally.
But go back further than the global satellite record, there is simply no way to draw any worthwhile conclusion, because the ocean SSTs are worse than guesswork, and the surface temperate coverage is poor. 500, 1000, 2000 years ago – proxies lack precision and compatibility with thermometer/satellite data.
In 1921 the Met Office report says London had the hottest October since records began in the 1850s (it appears it was hotter than this year so far). They also said it was the 14th successive month hotter than average, and October in England ended up an astonishing 3.6C warmer than average.
Was it global warmth? What were the SSTs? Unknowable, despite the claims of climate ‘scientists’.
130
“But go back further than the global satellite record, there is simply no way to draw any worthwhile conclusion, ”
Just as no-one recognised the failings of surface temperature records due to urban heat islands for 100years, I expect there will be widespread derision of our satellite records in half a century when the faults of them are known. Being the ‘latest and greatest’ is like being an electric car before lithium battery fires were noticed…
30
I know you’re referring to calendar year in saying 2022 was the hottest year. But in case it’s of any interest, here’s a chart of the central England 365 day average which indicates May 2006 to May 2007 was the warmest 12 month period. Chart doesn’t show any period earlier than 2003.
https://www.weatherdiary.uk/2023/01/06/2022-not-the-warmest-365-days-in-central-england-either/
00
I think I’ll cool down…by…
Going to the art galleries and take pictures of the collections…
Then print those pictures myself.
Imagine the collection I could have?
Every Artist getting their own drawer of of what is usually hung up around.
I take it that it’d be frowned upon?
51
The human body core temp ranges from 35.5 to 37.5C (varies with age) so that’s a full 2C of normality that these silly claims of climate change induced sickness and death don’t factor in.
Over 38C it’s fever territory, but that’s the result of the immune system not sickness, so again it’s not a real issue.
130
Unless dehydration sets in, in which case the self-regulation gets messed up. That’s probably the major risk in terms of health. Keep some sports drinks in the fridge!!
There’s also been cases where the COVID spike protein can somehow trigger long term destabilization of body temperature … which I find quite astounding, but I guess any mechanism can be jiggered by the wrong circumstances. Terrible for the people who have to live with it … nothing to do with climate change of course.
00
I did not save the link, but this weekend I saw a ‘lame-stream’ media article that said that Antarctica had a record high temperature of 101.3 degrees Fahrenheit.
Huh?
Antarctica at almost any temperature above freezing (other than the peninsula) should have raised at least a modicum of curiosity on the part of the person writing the article, but, no, it was just ‘accepted’ and passed along as established fact. Not one brain cell was employed by the writer.
As it turns out, someone I shared it with found that it was a transcription error on the part of another individual along the line; the actual temperature reported was 11.3 degrees Fahrenheit.
Not that 11.3 Fahrenheit should be remarkable; that’s still well-below freezing (on that scale).
Typical brain-dead leftist: find something that plays into your (worthless) preconceived bias, and mindlessly parrot it to the rest of the world. Thought processes? Checking the source, or any typos? FORGET IT!
NJ
250
[…] By Jo Nova […]
00
It’s the rate of change which is the issue. Humans are adaptable and they can move, but there is likely to be fighting along the way. Ecological systems are slower to adapt, especially when they are already under stress. Extreme event probabilities are changing rapidly, so expect more black swan weather disasters along the way.
We are well above MWP and other warmer periods now, this is uncharted territory for modern Homo sapiens.
237
So, what is the ‘rate of change’ you’re talking about, and what is so unusual about it?
171
Recent temperature increases are unprecedented in the paleoclimatic record.
https://www.ncei.noaa.gov/news/climate-change-context-paleoclimate
232
Interesting in what the link didn’t say. A lot of discussion of the late Holocene, but very little in the Gelasian, Calabrian, Chibanian, and latest Pleistocene stages.
If you’ll note, Richard Alley himself (see his chart above) has argued that glacial/interglacial transitions were on the order of four Celsius degrees (minimum), to as much as eight (or more) Celsius degrees, within a span of a few decades. Recent geological evidence bears this out (sorry you’re not up-to-date on the latest evidence. Maybe you could spend more time getting educated on factual evidence, instead of linking to bogus and inaccurate claims by a biased organization). What ever warming we’re experiencing now is not out of the range of natural processes. The figure I see most often, from the places I visit, is that the average global temperature has increased around one-and-one-half Celsius degrees in approximately two hundred years, give-or-take. For the Math-challenged such as yourself, this is much less than four Celsius degrees in a few decades.
In case you’re wondering, Richard Alley is no friend of us “denialists”. He’s solidly in your camp, but as I noted in the brain-deadness of the warmunists (above), he fails to see the contradiction between his own data and his own beliefs. If you’ve ever had a chance to watch him testifying (I do not recommend it), he’s extremely impressed with himself.
Also, your link is wrong: even the IPCC admits that temperature changes first, then the concentration of carbon dioxide in the atmosphere follows the temperature change. Vostok and EPICA both prove this out, so the credence of your link is less than nil (bias). I read the Jouzel (et al) original paper, and the mental gymnastics they went through to attempt (unsuccessfully) to deny their own data was extraordinary. Again, the brain-dead mindset of the warmunist.
You state, authoritatively, ” … we are well above the MWP and other warmer periods now … “, so advise us by exactly how many Celsius degrees we are above those previous warm periods, and when we went above them. I might be persuaded to agree that we’ve reached the previous level of the Medieval Warm Period, but not the rest of the Holocene. You seem to forget that up to about 7,000 – 8,000 years ago, the Sahara was a verdant grassland, when it was much warmer. See the chart by Alley, above.
And you want to claim that there’s a downside to warming?
Show us the downside, Simon. We’re starving for your dazzling brilliance!
NJ
271
Nick Jasper,
A few weeks ago I expressed doubt about relying on speleothems as historical thermometers. Joanne urged me to read a Jouzel paper explaining it all. Reading the paper made me even more sceptical about speleothems, and made me very doubtful of ice-cores too.
The supposed rationale: oxygen-18 doesn’t evaporate as easily as oxygen-16, therefore where there’s more O-18 in the ice it must have been warmer. Is that really what it all hinges on? To be sure, temperature comes into it, but wind and humidity have a really big say in how quickly the washing dries on the line. I suppose the argument might be that the ice-cores don’t read instantaneously and that they will average out the wind leaving just the desired signal of average temperature. That’s a bit convenient. Has the “average wind” never changed? Seems to me the ice-cores are deeply confounded and tell us nothing reliable about temperature.
Far more convincing finding arrow heads under mountains of ice, or ancient forests in Antarctica.
61
Point taken; no method is perfect. The delta-O-18 paleothermometer is sufficiently accurate to allow us to assess changes (which was Simple Simon’s original point). As I stated, even Alley admits that the glacial/interglacial transitions were abrupt, sufficient that a hominid living in that time would have noticed the change(s) in a lifetime, or less (there was one video of Alley arguing that even now, the time frame we think might have been a few decades long is in reality less than a decade; in any case, the change was abrupt, and several Celsius degrees of temperature change, completely dwarfing anything that has happened since the Industrial Revolution). So if nature, left alone, it capable of making such a large change in such a short period of time, there exists no reason that what is happening today is not completely natural.
Beware that change can happen in both directions.
The other main point I was trying to get Simple Simon to acknowledge (and, by the way, where is he? Shouldn’t he have rebutted by now?) is that the link he provided, NOAA made the blatantly false claim that ‘carbon dioxide changes preceded the temperature changes’, ergo, carbon dioxide caused the climate to change, just as it is doing “now”. The IPCC knows that the ice core data disproves their entire thesis.
Hey Simon! My guess is that you’ve never met H. L. Mencken. I am of the opinion that H. L. Mencken never met you; yet, he knew you better than you even know yourself. He nailed you and the other warmunists running around in panic mode:
“The whole aim of practical politics is to keep the populace alarmed (and hence, clamoring to be led to safety) with an endless series of hobgoblins, all of them imaginary.”
Maybe you could start worrying about a ‘real’ hobgoblin, instead of an imaginary one. Might be refreshing for you!
NJ
50
Not defending Simon’s propaganda. It’s wrong. However, when you say:
I can’t agree with you either. We know that climate people play very fast and loose with statistical methods. Think what the motivated rogues at the BoM are willing to do to a *real* thermometer record. Now consider what similarly motivated people might do when given something as vague and woolly as the ice core “record”.
Virtual numerology. It’s the same as the tree ring nonsense — yes, the rings/strata are there, but you can’t just say that by the grace of God, they have been ordained to reflect long-term mean surface temperature. They reflect umpteen factors, all jumbled up. It used to be ok for a scientist to say “I don’t know”. It’s not so popular today, probably because there’s money in faking certainty.
And it’s people who do that at places like the BoM and NOAA that provide fodder for propagandists like Simon. There’s not much point arguing with him, since he’s here to preach; bearing witness and showing his devotion. In any case, there’s no need to use dodgy ice-cores to disprove his silly “it’s the rate of change” argument. The average rate of change from sunrise to midday here today was around 2 degrees per hour; peak would have been much faster. Ecology seems to be getting on ok.
31
Regrettable that you do not accept paleothermometry. The geological community largely does, understanding that it is not a perfect method, but it is a tool we have and can use. If it was that bad of a tool, we would not be able to tie the temperature indications consistently to the related geological setting, e.g., the Hirnantian.
From where I grew up, and coincidently went to school, the reconstructions of Lake Bonneville have a decent enough correlation to the Vostok/EPICA curves to indicate that what we see in the shoreline terracing-record is accurate. Within the error margins, there is notable symmetry in the two records. No, I’m NOT saying that they are perfect. They simply show that when one record says there was a major shift, so does the other.
You are certainly free to dispute; we all have our opinions. We will have to agree that we disagree.
Agreed?
NJ
60
Agreed, but neither of us should regret it. The last thing we want at Jo Nova’s is a lust for scientific consensus!
The disagreement isn’t as deep as all that. I’m happy to allow that major changes are reflected in the cores. Those major changes didn’t just affect temperature though, did they? What I reject is that anyone can extract an unsullied temperature signal from the oxygen-18 analysis. Having a bit of a read around, this article seems to bear out my (purely intuitive) doubts about that method. It describes other approaches, including direct temperature measurement of the core at sampling time (hadn’t heard about that one before), and goes on to describe how multiple techniques can be used to cross-calibrate and thereby improve accuracy. There’s clearly a lot I don’t know about.
My training (from the dim past) is in maths, not earth sciences, and I’m suspicious that (like so much in climatology) these “calibrations” are applied naively, with scant consideration of the limits of the methods. As an analogy, while it’s impressive what can be done to improve an image using statistical methods, they have their limits. When Hubble needed glasses, they needed to go up and fit glasses. Statistics *could* have “revealed” all sorts of galaxies and what not in the blur, but they’d have been fantasies.
In Jouzel (et al) 1994, there are plots of *monthly* oxygen-18 concentrations as simulated for various climatic zones. So Jouzel thinks his ice cores arm him to talk about data at that resolution? There’s fantasy for you.
20
Localised changes in climate can happen much faster and are often more pronounced than global. This is especially true closer to the poles. Note that recent warming in boreal regions has been about 3x that of the global average.
Yet another reason why it’s really not a good idea to be emitting large quantities of greenhouse gases into the atmosphere.
310
So, within the margin of error, changes in Antarctica are reflected in the GISP/GRIP record as well (with a notable lag, or in some cases, lead), indicating that the change(s) are taking place at both poles.
And nowhere else? Is that what I’m getting from your word salad?
Hey, Simon: What was the concentration of carbon dioxide in the atmosphere during the Hirnantian? And, what was the general paleoclimate around that time? Any guesses? Or do you want to look it up? GTS 2020 (Gradstein, Ogg, Schmitz, and Ogg) has numerous references you can check. I’ll give you a hint: the logarithmic nature of the “effect” (if any to begin with) of carbon dioxide concentration comes into play. Same for the Cryogenian.
It would also seem that you fail to understand the that by, ” … emitting large quantities of greenhouse gasses (sic) into the atmosphere.” we’re fertilizing those ‘green’ things that make the oxygen we breathe. I’m still waiting for you to tell me the downside of a warming world; as I stated, when it was more than 2 Celsius degrees warmer than now, what we call the Sahara was not the desolate wasteland you and I know today. Look again, please, at Alley’s chart, provided by our lovely hostess. The vast majority of the Holocene has been several Celsius degrees warmer than present-day, yet somehow, life managed to not just survive, but it would seem, thrive. Do you seriously dispute this?
You’re grasping at straws, Simple Simon, and not very well at that. I can’t imagine a life being lived in fear of imaginary hobgoblins, when there’s so many real things you could be crusading against.
NJ
40
Unprecedented is one of those words so overused by the Left that they’ve rendered it essentially meaningless like their standard ad hominems of racist, various forms of *phobic, sexist, misogynist, MAGA supporter, tin foil hat conspiracy theorists, National Socialist, abelist, white, heteronormative, uneducated, classist etc. etc..
142
“Unprecedented” combined with “catastrophic” allows all sorts of dystopian alarmist thoughts to prosper.
70
The use of the word unprecedented in recent times is unprecedented
80
Simon,
To be expected given the measurement technique differences.
We could go further:
Also,
Was there a real-time Global Data Acquisition System (GDAS) prior to the 1980s?
Ans: No.
110
Again Simon tell us your solution to your so called problem?
And why has Human flourishing occurred over the last 200 years, or since 1900 or since 1950 or since 1970 etc?
And tell us why you believe that wasting trillions of $ on TOXIC W & S would change anything?
111
‘The Mid-Holocene Warm Period, observed about 6,000 years ago, was generally warmer than today during summer in the Northern Hemisphere.’
That is interesting, worth following up.
30
Learn something new every day.
‘The mid-Holocene (MH, period between 5000 and 7000 years Before Present) was characterized by lower summer insolation in the Southern Hemisphere and higher summer insolation in the Northern Hemisphere, resulting in the so-called “Holocene Thermal Maximum” (Berger (1988); Liu et al. (2002); Bova et al. (2021)).
20
Holocene Climate Optimum down under.
‘Marcott et al. (2013), take the view that the HCO was 0.7°C warmer than the bottom of the LIA, and such low temperature variability for the Holocene rests on tropical warming of 0.4°C from the HCO, and Southern area cooling of just 0.4°C.’ (Judith Curry)
10
Simon’s NOAA citation:
Climate Model Simulations of the Last 1,000 Years
https://www.ncei.noaa.gov/news/climate-change-context-paleoclimate
Their fall-back – “the climate model” (sacred cow).
No, “the climate model” does not “test” anything.
“Physical laws” in the loosest sense of the term.
And they don’t “track” anything either. In absolute terms they don’t even “track” the temperature right now.
The “greenhouse gas concentrations” are prescribed for the future (literally “scenarios”), and highly contentious in the immediate past.
90
NOAA,
Models don’t “explain” anything.
This is pseudoscience.
Their solar forcing regime is junk science and least-case.
Their models are now TOO WARM after adding the human-caused increase in greenhouse gas concentrations.
110
Simon, thank you. I wasn’t aware NOAA was still using the Al Gore method of climate lying:
Twenty years after they discovered that temperature definitively rises and falls before CO2 (and by hundreds of years), this is how a weasel would carefully describe the relationship to imply the opposite, while knowing they were misleading people.
As the “unprecedented” rate, get back to us when you know the exact rate of the rise from 8200 to 8150 years before 1950. Was it really slower than 0.14/decade?
130
“The lower solubility resulted in the emission of CO2 from the ocean into the atmosphere at around 17,500 years ago, which in return caused a global warming due to the greenhouse effect. This time lag of around 500 years is what causes the CO2 lagging behind temperature in the ice core record.”
That is why, past CO2 levels lagged the temperature rises, (using proxies and models – so take that with a grain of salt)
however this is not uniform – The southern hemisphere showed temperature rising before CO2 concentration – because more oceans. (from link)
of course the main source of the increase of CO2 in the present day is not the oceans, or volcanos but Anthropomorphic activity.
28
It’s great that in 800,000 years of ice cores you can find one example where temperature may not have led CO2. “Congrats”
Your claim that this “caused” a temperature increase is only supported by skill-less climate models that are unable to predict the upper troposphere, water vapor, cloud cover, rainfall, drought, jet streams, ocean cycles, droughts, wind speeds, storm trends, and everything about antarctica.
130
yes that is true, but in the last 800,000 years, and as I said, the CO2 increase measured in the atmosphere (or in the air trapped in the ice cores) was from diffusion out of the oceans, not the burning of carbon as is the case today
28
So? Do you think it is a different molecule?
60
Peter in the last 800,000 years how many CO2 measurements were taken ?
40
A volcanic eruption in Antartica, starting around 17,700 years ago, may have had a part to play.
https://theconversation.com/two-centuries-of-continuous-volcanic-eruption-may-have-triggered-the-end-of-the-ice-age-83420
00
The tiny changes in temperature observed (if real) are well within natural variation and no cause to move anywhere.
Warmer temperatures are beneficial for everyone as the Minoan, Egyptians, Romans and Medieval Europeans knew.
The only direction of “climate change” people have to worry about is if it gets colder.
Humans and their agriculture love warmth.
No wonder the Left is now also at war against agriculture. They want agricultural productivity to be decreased by banning or restricting fertiliser, controlling land use, reducing or banning production of chickens, bovines and ovines and forcing us (non-Elites) to eat poverty food like insects.
122
Thanks for your view Simon, “but we thinks differently” based on actual information. I assume you know the old saying “Why remain silent and be thought a fool, when you can speak out and remove all doubt”.
132
Yep, when Roy Spencer, hat tip to Gee Aye, says it is, you know that the last of the holdouts are now in the fold
37
Christy and Spencer have joined with other climate scientist in playing down stratospheric water vapour, from Hunga Tonga-Hunga eruption, as a cause for the spike in temperature.
Do you think this is a reasonable assumption?
20
It means nothing compared to the amount of anthropogenic heating caused by the burning of carbon to produce CO2
28
The jury is still out on AGW, however I admit its not looking good for the cool faction.
What do you make of that other volcano bringing the world out of glacial times. Punched a hole in the ozone layer for a couple of hundred years, its signature observed in acid rain. For this I thank the gods.
CO2 increase followed temperature.
00
By modern Simon do you mean since air conditioning ?
110
Simon – in the MWP the Vikings were growing barley in Greenland. Can they do that now? Was it warmer then or now? Please look up the data and think about it before saying it’s warmer now than the last 10k years.
161
This is a broad area they ignore because they can’t explain it.
20
Surely, they can explain it e.g. solar output variations, but the main problem is that they want to hide it.
In fact they aren’t ignoring it, they’ve gone to a lot of trouble to deep six the reality of the chaotic weather system and the primary driving factors: the Sun and known orbital variations.
10
Simon,
>Humans are adaptable and they can move, but there is likely to be fighting along the way.
Ya think?
Humans are moving from South America to North right now en masse.
Humans are moving from North Africa to Europe right now en masse.
Humans moving Eastern Europe and Middle East to Western Europe.
Sweden now rape and gang violence capital of Europe as a result.
Where exactly will the “move”, or moves, be that you’re predicting?
It’s not as if there’s not a whole lot of moving going on already.
Little to none of which is due to warmer weather.
100
“It’s not as if there’s not a whole lot of moving going on already.”
Not to mention the countries fighting right now too-
Russia, Ukraine, Poland, Lithuania, Sweden, France, Germany, America, Italy.. all the West as NATO, Israel, Palestine, Lebanon, Saudi Arabia, Yemen, Niger… Fighting and wars are normal for humans.
70
‘It’s the rate of change which is the issue.’
Its a media beat up, nothing particularly unusual is happening.
BoM has its seasonal forecast out, heatwaves and bushfires are on the agenda. Do you think that is a reasonable forecast?
21
Simon
And the rate of change is managed by the temp adjustments.
This was the NASA GISS graph for De Bilt (Holland) up to 2010.
https://data.giss.nasa.gov/cgi-bin/gistemp/show_station.cgi?id=633062600003&dt=1&ds=1
After the ‘temps are plateauing’ scare (around 2008/9) they adjusted, cleaned and homogenised the data until they produced something that fitted their story.
https://data.giss.nasa.gov/cgi-bin/gistemp/stdata_show_v4.cgi?id=NLM00006260&ds=14&dt=1
Man-made warming by computer models.
50
Ian George
>NASA GISS graph for De Bilt (Holland)
I see your name at Paul Homewood’s website in posts under the ‘Temperature Adjustments’ tag:
November 22, 2015 Massive Temperature Adjustments In Brazil – And Guess In What Direction? [Spotted by Ian George]
https://notalotofpeopleknowthat.wordpress.com/tag/temperature-adjustments/page/3/
Also,
April 10, 2015 More On Adjustments At De Bilt
April 9, 2015 Cooling The Past In Holland
February 9, 2015 Cooling The Past In New Zealand
September 26, 2016 Temperature Adjustments In Greenland, Iceland & Norway
January 31, 2015 Paraguayan Adjustments Not Supported By Regional Trends
January 30, 2015 How GHCN Keep Rewriting Reykjavik History
January 29, 2015Temperature Adjustments Around The World
January 29, 2015 Shub Niggurath On The Paraguayan Adjustments
January 26, 2015 All Of Paraguay’s Temperature Record Has Been Tampered With
January 20, 2015 Massive Tampering With Temperatures In South America
September 1, 2014 Temperature Adjustments In Greenland
August 24, 2014 Temperature Adjustments At Brisbane
August 23, 2014 Temperature Tampering At Amberley
And so on, screeds going back to March 11, 2012.
30
I have been following the ‘adjustment’ story since the changes to temps around 2010. The BoM have also adjusted temps with the original High Quality data followed by ACORN 1 and 2. Each time the pre-1960 data has been adjusted down and the post-1990 has been adjusted up (1961-1990 is the ‘core’ average). One only has to look at the averages for each month in NS , for example, to find that the average mean does not match the actual temps because of the way the BoM manage the data.
40
Whoops. NS=NSW
30
And under that UAH chart on WUWT is reported actual real-time global temperature 14.08C.
Global boiling, I think not.
120
14.08.
Isn’t that what it has always been?
90
They need scarier stories to frighten the children and idiots like Chris Bowen. Most people I talk too take no notice because there are things , more pressing, on their minds; things like the Middle East war and the fact that petrol will be dearer. They are struggling with power bills brought on by the idiots in our parliaments who are advised by scientists who should be struck off. No one cares if it is a warm day or even a few in a row. We had a “heatwave” here a few days ago and today I have a jumper on. I am not alone in my disdain for the media.
140
Doncha know heatwaves cause snow in October? In, of all places, Australia? El Niño emissions and carbon fallout and ‘inaction’ is what done it!
A ‘denier’ must’ve infiltrated BoM’s inner sanctum as today, for Victoriastan’s Mt Baw Baw, they’re prophesying snow showers for Thursday, Friday, Saturday, Sunday and Monday… Surely five (5) days of snow in a row deserves a screaming upper-case headline: COLDWAVE CATASTROPHE. Then again, they could be wrong.
121
Well Greg I lived in a town called Guyra some years ago and it snowed a reddish pink colour. This was November and was caused (I think) by the red dirt in the middle of Australia being picked up in the preceding northwest wind and then converging with a cold south west change. Guyra is at 1350meters asl and the snow is formed in an orographic lift on the western slope.
50
Took my twin-nieces down to Mt Ruapehu when they were little nippers (mid-90s) for their first snowboard mission: driving up the access road I thought the snow looked ‘odd’, and when we got out they both blurted, “Uncle Greg, why is the snow black?” Unbeknownst to us, the mountain had erupted the previous night and a layer of ash covered everything.
We also had a few ‘red snow’ days in the South Island during the 90s from bushfire ash coming in on a nor’wester – it’s happened before, it’ll happen again.
10
Probably in 2009 when all the dust storms were around. I was in NZ on Tasman Glacier in 2009 and saw a reddish tinge in the ice. Our guide told us it was from the dust storms in Aus.
00
What happened to the hat tip to Gee Aye?
He blew his whistle yesterday with comment #1 about escalator temperatures. Jo has made an appropriate response.
10
Hard to believe but after 15 years of climate blogging I already knew of Roy Spencer’s monthly updates. 🙂
PS: I am not responding to GA but to things like Euronews, the UN, CNN, and NBC.
90
Well it is a good response and timely.
It is easy to forget the big picture and that nothing has gone beyond long term historical norms.
I see that my comment could be misinterpreted. No offence intended.
20
I completely did not do anything that requires a hat tip.
21
Someone red thumbed you out of reflex.
(Or they disagree and really do think you deserved a hat tip.)
10
No, probably not.
You did seem to be raising an alarm by linking to six different sources showing escalating temperatures with an expanded Y axis (temperature) to exaggerate the rise.
00
Maybe get out more and read a few scientific journals and investigate standards for data presentation. An axis is focused to, as you put, exaggerate in order to make visible the area of interest in the data. If, say, a one degree rise is statistically significant, it is desirable to draw a scale to illustrate the change* rather than drawing the graph with a 1000 degree span.
*graphs are not data. They are purely an illustration and a shortcut to help the viewer to easily understand data with regards to a point being made in the text/talk.
02
So you were raising an alarm then?
00
Just baiting. You know that I am a troll.
11
And October is cold.
80
As they say inth eclassics:
“Stop Continental Drify!”.
(Tight ip there with;
“Land rights for gay whales”.
Consider the significant stand of Antarctic Beech (nothofagus sp.) at the southern end of Lamington National Park, in South East Queensland.
These trees have bot flowered in living memory.
The name is a hint. As Oz does a Hitchcock and wanders off North by Northwest, things change. This has been going on since the local plate tore looes from Gondwanaland. On this journey the continent has bumped and scraped along, featuring vast “inland seas’ and some very impressive volcanic activity. The NSW Northern Rivers district is basically the remnant Caldera of a Mega-Volcano, for starters.
Ditch the “steady-state” foolishness and accept the exciting reality of “Catastrophism”
Add in the steady stream of comets and hyper-sonic rocks the size of small towns striking the planet and cyclic pole shifts and there is plenty of stuff to keep the survivors busy.
“Stop Polar Reverses”? Yeah! Right!
71
During the Eocene Epoch Australia and Antarctica separated therefore allowing the Southern Ocean unobstructed movement across the 40-50degree latitude. Plate tectonics and the positioning of land masses certainly influenced climate. Pangaea would have absorbed a lot of energy.
40
I think we should look at all the Aussie sea level studies that Ken Stewart linked to and why they are really the world’s biggest thermometer over many thousands of years.
Of course sea levels were much higher around Australia during the Holocene climate optimum and even higher during the much warmer Eemian inter-glacial.
It is much cooler today and the GBR is at record coral growth and health today compared to the last 37 years. Look it up.
https://kenskingdom.wordpress.com/2021/08/23/the-worlds-biggest-thermometer/
50
All true and correct, I’ll just add this short abstract for anyone interested in the Holocene Thermal Max in Australia.
https://journals.sagepub.com/doi/abs/10.1177/0959683610369508
20
Download full paper here, el+gordo, at ResearchGate
20
Willis Eschenbach’s audit of their so called climate emergency is further proof that everything is better today and he provides any available updates as well.
And deaths from extreme weather events have fallen by 98% over the last 100 years, even though there are 6 billion more people at risk today. Think about those numbers.
https://wattsupwiththat.com/2021/04/25/wheres-the-emergency/
20
So why have we allowed ourselves to be bullied and then listened to the liars and con merchants over the last 35 years?
AGAIN here’s the very simple data and evidence from our poorest continent Africa since 1950.
African life expectancy in 1950- just 36 years and life exp today – 64 years. But population in 1950- just 227 million and pop today- 1460 million.
Yet Africa also had to suffer 90% of global HIV AIDs deaths and also 90% of global Malaria deaths over the same period.
This tiny 0.1% period of our Human existence has seen the greatest Human flourishing for 200,000 years
and yet the liars and con merchants now BELIEVE that we are somehow facing an EXISTENTIAL THREAT to Human life?
Here’s the Macrotrends link using UN data since 1950.
https://www.macrotrends.net/countries/AFR/africa/population
20
BTW death rates from HIV AIDS have decreased
in Africa since 2003.
But compared to the World, OECD countries and a very low Aussie death rate they still carried the major burden.
These are death rates per 100,000 people.
https://ourworldindata.org/grapher/hiv-death-rates?tab=chart&country=OWID_WRL~African+Region+%28WHO%29~AUS~OECD+Countries
00
Again the African region still has about 96% of global Malaria deaths and today that’s about 0.63 million people.
https://ourworldindata.org/grapher/global-malaria-deaths-by-world-region
00
AGAIN Dr Roger Pielke jnr asks why are the liars and con merchants still using the laughable and outdated RCP 8.5? And why do their so called scientists just ignore proper data and evidence, then play dumb and look the other way?
Is it any wonder our govts and pollies understand so little about their so called climate emergency BS and FRAUD?
https://rogerpielkejr.substack.com/p/thou-shalt-use-rcp85?publication_id=119454&post_id=137809966&triggerShare=true&isFreemail=true&r=2unro7
20
In Vanuatu we have had a very cool and wet(unusual) winter and now spring. Records here are only 33 years old, but people living here for more than 40years believe this one to be the coldest and wettest they have experienced.
30
Tonga’s had a few ‘cold snaps’ this winter, down to 9C overnight on a few occasions. There’s been a steady stream of big, cold, southerly pulses reaching all the way north to Tonga, Fiji, New Caledonia and Vanuatu – the Line of Convergence has been wandering all over the show, maybe affected by the Big Bang last year? I take it the ocean isn’t quite *boiling* yet.
20
The northern islands of Fiji have been getting well above average precipitation.
10
” Hottest September EVAH”….. run for the hills.
10