Climate experts wrong on Australian frosts, and media say nothing
The IPCC experts were sure would be less frosts in Australia, but buried in a government funded ABC weather report was the virtually unknown admission that the frost season is actually growing across southern Australia, not shrinking. And in some places by an astonishing 40 extra days a year. What’s more, the researchers have known about this long term trend for years but didn’t think to mention it, and the ABC didn’t have a problem with that either. (It’s not like farmers need to know these things?)
When asked for an explanation for the increase in frosts, the ANU climate expert said “I think this is one of those climate surprises,” as if the IPCC unexpectedly won a game of Bingo, instead of getting a core weather trend 100% wrong.
We note the ABC feigned journalism to cover up for the Bureau of Meteorology and IPCC failures. Where were the headlines: “Climate Change causes more frosts, not less”, or “IPCC models dangerously misleading on frosts?” Did any Australian farmers and investors buy up properties and plant the wrong crops based on the global warming misinformation repeated or tacitly endorsed by the ABC, BoM and CSIRO?
Frost damage costs Australian farmers around $400 million each year. (Perhaps if we sold the ABC we could cover that).
Frost expected across nearly every state and territory in Australia this weekend
By Tyne Logan, ABC Australia
Buried under 450 words of weather, trite caveats, and preamble the ABC journalist finally gets to a new virtually unknown climate trend that affects farmers, investors, researchers, and rural Australia:
The latest Intergovernmental Panel on Climate Change report projected, with high confidence, that frost events would decrease, in general, across southern Australia in the future with climate change.
ANU climate applications scientist Steven Crimp said some parts of New South Wales were now experiencing five more frost events on average each year, compared to 1960.
And he has known for years:
He said this was based on local weather station data between 1960 and 2018, but the trend was unlikely to have changed much in the past five years.
“I think this is one of those climate surprises,” he said.
Scientifically they are not caught unaware because climate models are useless politicized fantasies, it’s because there is more “climate-nuance” around now:
“Despite the sort of overall warming trend in our temperatures, the extremes of our temperatures, be they hot or cold, are acting in a slightly more nuanced and complex way, which can be quite surprising at times,” he said.
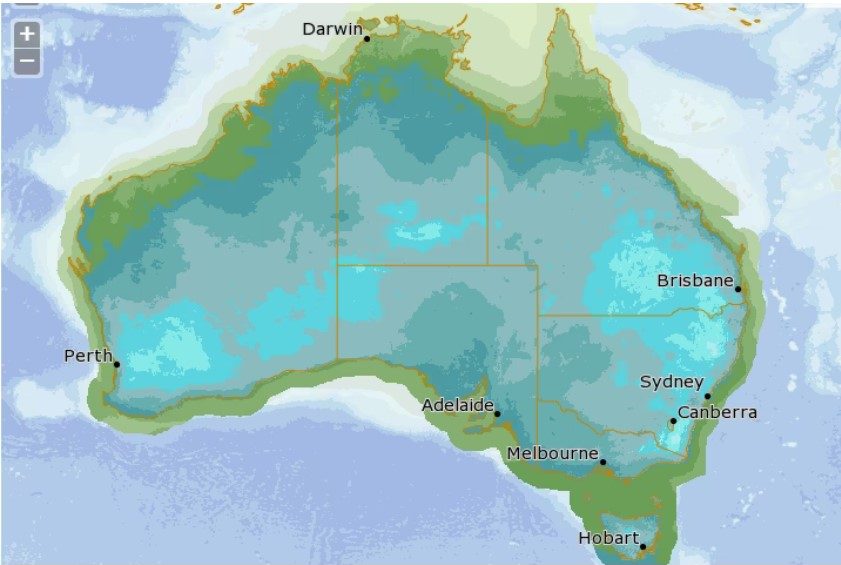
BOM forecast overnight minimum temperatures to fall well below zero across large swathes of the country [last] Sunday.
But jokes aside, this actually seems like a trend that matters:
Dr Crimp said they had also found the frost season was lengthening across southern Australia.
“So if we think about the east coast first, we see an earlier start and a later finish to that frost window,” he said. “In some cases, the extension of that frost window is greater than 40 days.
“But in Western Australia in particular, we see that it’s less to do with the later frost occurrence, but more earlier frost occurrence.”
The frosts are due to the dry conditions, says Dr Crimp, putting in an admirable effort at scientific-word-salad to cover up for what he’s not allowed to say — that they have no idea.
Why aren’t frost days decreasing?
Dr Crimp said, ironically, the observations could be explained by the types of weather system that brought warmer, drier weather. That was high pressure systems which often produced the clear, still nights needed for frost to settle.
“As anyone knows who’s outside at night in winter, you have to have those clear night skies and the atmosphere needs to be very dry,” he said.
“That way the surface of the Earth loses heat very rapidly and any moisture in the air then condenses as a frost. “So because we are getting those dry conditions that are starting to emerge, that is more conducive for frosts to occur.”
But the truth is that, on average, and a priori — global warming would increase humidity and global cooling would dry the air out. And carbon dioxide is supposed to work at night time too — increasing minimum temperatures. All these factors make frosts less likely.
And yet the frosts happen.
Global warming ‘science’ has lost,
Being useless, at a terrible cost,
As their heat without end,
Is bucked by the trend,
Of Australia’s more nights of frost.
–Ruairi
h/t to A happy little debunker who points out we’ve had three wet La Nina years as well.


Odd isn’t it, that the only source to report this is the ABC
Yet it is pilloried
773
Deservedly so. This is new news, an unknown trend, and yet the ABC buries it under 400 forgettable words. This trend in frosts has been known since at least 2018. Yet the ABC journalist expressed no astonishment, asked no hard questions, didn’t criticize the models, didn’t put the most important scientific news in the headline and accepted the scientific word-salad like it meant something.
Only the ABC has a well funded science unit and they squander to cover up for junk Big-Gov science, not to make Big Gov science better by holding it to the flames.
1170
Climate change (global warming) is a fraud and has never occurred. It is pushed, sworn to, and testified to all in an attempt to increase taxes and government spending.
30
Here is a very interesting short video showing the idiocy of climate change radicals.
https://www.youtube.com/watch?v=LmmmgiPha_Y&ab_channel=IvorCummins
00
So, according to warmist “logic,” Peter, CO2 (what you call “carbon” – sic) causes warming and therefore the shutdown of Australian power stations and industry, Australia being such a “massive contributor” (sarc) to anthropogenic global warming, has been successful and the world is now cooling? Too bad that agricultural production also drops as the world chills…
And too bad you warmists are utterly silent about the world’s largest CO2 emitter – by far. Do you know who that might be Peter?
701
David,
Maybe this increase in frost hours per year also has potential to cause a drop in solar cell electricity through ice on the panels after daybreak and windmill electricity though ice on blades lowering aerodynamic efficiency.
Oh dear. Electricity prices to rise even more?
Geoff S
40
A FACT they cannot deny… hidden behind reams of excuses and waffle.
“Trends have shown frost events and season length is increasing in some locations, despite a warming climate”
Australia hasn’t warmed in the last 23 years… and has been cooling during the last 7 years.
600
When Yallourn shuts in 2028, grid power will be too expensive to use. Can anything be done in time to prevent a total meltdown of electrical power at a sustainable price? No. Anything guv does just makes it more expensive.
Its nice to know when normal life ends. Can plan to get my own gennies pre-catastrophe.
510
Geoff: May need to add a home-grown refinery to your plans, the greens understand the importance of shutting down sources of nasty fossil fuels in their plans. I recently read an article about the gov’t of Nigeria launching a program to close homemade refineries, 200 or so across the country. Nigeria has oil, but not for the common folk. So, common folk who only need a few gallons a month (I have no idea of the real number, but my guess is ordinary Nigerians do not commute to work on a highway.) will make their own gas, despite the extraordinary risks involved. Folks, that’s our future- the greens will shut refineries just like they are shutting coal plants and mines, yet some will want gasoline bad enough to open a backyard refinery. Then the greens will use the gas they get from approved sources, and drive ICE tanks over the homemade operations. Saving the planet, one still at a time.
30
Will extract oil from brown coal at US$28/boe. Plenty of oil for Australia for about 2,000 years. No problem. Already have autoclave and lab to make same.
Will need electrical power though.
10
Peter, please answer my question.
Who is the world’s largest CO2 emitter?
290
Tennis Elbow and Blackout Bowen, please answer my Question. Who is the World’s greatest CO2 emitter? Maybe Peter is Xi.
80
‘klimate khange’ caused by ‘co2 emissions’ is the ultimate unproveable hypothesis.
anything that happens weather-wise can be attributed to it.
230
Outstanding journalism by Tyne Logan, the weather and climate reporter at ABC in Perth.
50
58 red thumbs has to be a record
20
Yep, we need more like him.
00
Within a few years winter frost will become a very rare and exciting event. Children just aren’t going to know what frost is. /sarc
670
Ho hum, I hear you Tim Mammary ( a real tit.). 😉😉😉
221
That should be “twit” … please don’t insult “tits”, they are nice little birds. 😉
200
Even Rhoald Dahl’s “Twits” were ahead of that
50
The severity of frosts recently and the early advent of them is unusual. Many places have had their coldest May for many decades. I noticed that the ABC’s resident expert put it down to a cold air mass under a strong high pressure system,well yes – a good start. Clear skies, no wind and cold air sinking through inversion is no mystery. Temperature forecasts for the northern Tablelands are well above what actually happened with repeated readings below -5C.
310
Funnily enough in the sixties and seventies clear cold nights gave us frosts and at that time they (the experts) were telling us a new ice age was coming. So clear cold nights cause ice ages AND global warming. Yeah; that makes sense.
220
I predict that is less than a decade we’ll be back to ‘WE’RE ALL GONNA FREEZE’ (unless you pay up)
50
I worked at a servo just outside Hobart’s Airport for nearly a decade.
The funniest thing I ever saw was a family of Northern Mainlanders leaving very early one morning, after their mid-winter break.
That morning we had a heavy frost.
The kids were extremely excited to see all this white stuff on the field adjacent to the Servo and I could see them begging and pleading with their Parents to go and enjoy what they must have thought was snow.
The children rushed over and made ‘frost balls’ to throw at each other and made ‘frost angels’ OR as my dear old dad would say “laying down in the mud and dirt’.
190
And he’s still at it;
“Australia should draw on its pandemic playbook as it considers how to endure the climate crisis,” leading scientist and campaigner Tim Flannery says.
https://www.msn.com/en-au/news/australia/flannery-backs-covid-style-approach-to-climate-crisis/ar-AA1bPmcd?ocid=msedgntp&cvid=f6160c316234494fa39cc905244a1e5e&ei=19
70
He could have emphasised the “play” bit
40
[…] By Jo Nova […]
10
I remember an interview done by ABC rural radio and a CSIRO wheat researcher. The researcher said he was working on wheats that could survive hot, dry conditions. He was asked if he was also studying wheats for cold conditions and he replied there was no need because the world was heating not cooling. I thought that was a stupid thing to do and so it is. I wonder what he is doing now.
It does show what happens when an organisation ignores real science for predetermined science.
40
Catastrophic anthropogenic global warming causes everything bad, including freezing temperatures and frosts, didn’t you know? Even earthquakes as per my post yesterday.
https://www.theguardian.com/world/2016/oct/16/climate-change-triggers-earthquakes-tsunamis-volcanoes
430
How will Australia cope with a cooling world as it insanely continues to shut down its power stations?
580
Not that well, with gas, having to make up the shortfalls of the missing coal energy, having its price rise to $30/gigajoule. And I’m presuming that those gas “peakers”, now having to run a lot more, are inefficient open-cycle, thus increasing the cost of energy.
240
Electricity prices in Australia are unidirectional despite Albo’s election promise.
Average wholesale price in NSW last week was $292/MWh. The only slightly positive news is that only a lousy 12% will garner the government sanctioned theft from consumers of an additional $55/MWh.
Gas was only 2.8% of generation last week. The remaining coal plants are big winners with average price at $281/MWh. Not quite at the dizzy heights of July 2022 but well above last week of April of $137/MWh.
70
I’m kicking myself for not even trying to check the frost data trend over the last few years.
But my relatives have alerted me to the fact that frost was still a big problem during the wheat cycle and particularly during late winter and spring.
And I remember linking to the problems of frosts in WA wheat belt and SA and Mallee country in VIC and SW NSW.
But alas I didn’t try to properly check the trend over a decade or more.
But I’m not surprised that their ABC would try and hide this important story and then use their confusing gobbledegook to try and cover their backsides.
Thanks again Jo for your hard work and I don’t know how you do it.
550
Agree 100% with your last line. I just do not know how Jo can continually research, find and publish this critical information for us. She is a vital part of my daily life.
Time for more chocolate, I think.
600
Severe frosts are pretty harsh on livestock, as well. I remember a late Winter drive through rural NSW in the mid 1970’s. Frost in almost every ‘hollow” and which also featured a rolling landscape littered with untold numbers of dead sheep. Early shearing, late frost; absolute slaughter.
This “coming out of an Ice Age” caper is going to be a long, fluctuating wave motion.
20
Looking at real data, as distinct from BoM data that has been “homogenised” by a secret process to fit the Official Narrative is what government “scientific” agencies such as CSIRO are meant to do, but don’t.
Thanks for all your efforts Jo. You are much more effective (and cheaper 🙁 ) than any government agency.
410
Another top article from Michael Kile at Quadrant online and discussing more of the modelling garbage in and then even more garbage out.
Also included at WUWT today.
https://quadrant.org.au/opinion/doomed-planet/2023/05/climate-modelling-rubbish-in-rubbish-out/
150
Spot on Jo.
And more of those great big high-pressure systems of which Dr Crimp speaks mean not only more frosts but more wind droughts, more calm, clear nights with no wind, reducing the contribution from all those wind turbines, and further destabilising our electricity grids, already compromised by the penetration of renewables.
Right when the electricity is needed, on those cold nights, it isn’t available.
This is the stuff of high farce. Ya can’t make this stuff up!
Brilliant, Jo, and thank you,
Paul Miskelly
410
Anticipating global cooling, instead of wasting staggering amounts of money on windmills, solar panels and other anti-energy projects, Australia should have been working on irrigation projects in the northern desert regions which may be warm enough for agricultural production in a cooling world.
But everyone in the Government, CSIRO and “academia” (sic), was asleep at the wheel or actively hostile with any idea that doesn’t fit the Official Narrative.
330
There is a ‘rule of thumb’ I believe in the Canberra/ACT region that frosts cease around the time of the Melbourne Cup in early November. Maybe that ‘rule’ now needs to be revised.
Maybe with more frosts and the soon to be ongoing blackouts at the Federal Parliament Building, the ‘Pollies’ may start to wake up to this Climate Alarmism rubbish.
But then ago, maybe not. After all, where there is no sense there is no feeling.
220
Canberra / ACT in winter…horrible place. Apologies to all that reside there. My brother lived there for seven years for work, then left to go back to the coast. He endured seven “punishments” – that was enough!
30
I hate to Crimp his style, but the climate scientists have been a major waste of money all over. We would be better off if the Govt encouraged private individuals to take temperature and rain reading, and log wind and frost. Even if one person in 100 did it in the country we would have a better idea of what is happening. The cities? Who cares?
The farm I stay on up in New England has paper records going back 40years, and would have more if they’d kept Grandad’s records.
200
Hear hear! Climate — average weather — is of zero relevance to anyone. If you know exactly the round-the-year average at a given spot, you know nothing about what it’s going to be tomorrow. If you know the round-the-world average, you know nothing at all. And if you know the whole-year-whole-world average you have the holy grail that climate scientists are striving for. Utterly worthless.
Leave climate to harmless boffins and put the “M” back in the BoM.
80
Our local BOM rain gauge moved about 2 km to my father’s front yard when hte farmer who had been servicing it got too old to do it.
It was supposed to have a new graph paper every morning at 9 am, but we only changed it when it rained or after a few days the ink line got thick. Occasionally there would have been nobody to service it for a small number of days.
Bill Kininmonth used to service it.
In about 2005 it was replaced by a modern weather station, complete with telephone line, about 200 metres away in the open.
Dad died in June 2007 at 93 years old, during a drought. The next morning his rain gauge topped the Hunter equal with Nobby’s at 88mm, and it didn’t stop raining over the next few days until they had had 9 inches.
90
Whoopsie! I thought humidity decreases as temperature rises. Humidity is a relative terminology.
I guess what you mean is that as temperature rises so does the water content in the atmosphere, and thereby in the water cycle.
When talking frosts my memory always goes back to July of 1970 and again in 1971. We had phenomenally low overnight temps, as low as-10 degrees, but little frost on the ground. Daytime temps were in the order of 20 degrees. Both years there was severe drought.
We rarely get frosts in March, more often have none till June, but last week had a run of -4s which is unusual for May.
60
It is the dew point that matters. Crimp is talking nonsense. How can you have dew in a dry atmosphere – what a nutter.
In calm air conditions. the ground will eventually equilibrate to the dew point. Basically the dew point sinks to ground level cooling to whatever the dew point is.
If the dew point is less than 0C then a frost will be likely in calm conditions.
The vast majority of the heat transfer near ground level will be from chilled water descending taking latent heat with the warmer atmosphere. The ground temperature is reduced until it reaches the dew point. Cooling below the dew point is very slow. The rate of radiative heat loss from ground iin conditions where dew will form is next to zero. Radiating temperature will be around 240K; well up in the atmosphere.
60
I put the lack of frost and the extreme low temp down to drought. No moisture to freeze.
I never studied it, but the first place you notice the frost is on the roof of a vehicle. Also, when the thermometer says 3 degrees, we probably have frost on the vehicles.It may be colder there than at ground level, ttoo.
41
Ted, fair point — I was talking about absolute humidity — and when oceans, soils and rivers warm they release more moisture into the air above.
Even Prof Andy Pitman agrees remember — saying that actually, technically, a warmer world is a wetter world and would not necessarily have more droughts “a priori”.
100
Last year was the second wettest on record around here, only exceeded by 10mm by the wettest in 1893.
Bit hard to find any trend in either rainfall in either direction from our local records, [SE Queensland, south of Brisbane].
10
So many unqualified anti-science people now call themselves and identify as “climate scientists” that the term is essentially meaningless.
It’s like how the Left call everyone they disagree with a “racist” or a “*phobe” of some kind or a “denier” etc.. Or the term “political scientist”. All meaningless blather.
And no real scientists, a very few who know the truth about the anthropogenic global warming fraud, and who are in taxpayer-funded employment have been willing or able to speak out. Those few who have, have been sacked, canceled and defunded.
Scientific censorship is a serious problem, as is censorship of all ideas that don’t fit the Official Narrative and the problem is getting far worse as the Left become further entrenched.
190
As the world cools, what is the expectation of the availability of wind to drive the bird mincers? I assume there’ll be less wind and therefore even less and more useless power produced?
160
“you have to have those clear night skies and the atmosphere needs to be very dry,”
It appears this “climate scientist” does not know what frost is made from! The air cannot be “very dry” because otherwise there would be no moisture to condense onto the cooling ground surfaces. Clear skies are essential, because those pesky H2O condensates in the sky are great trappers of radiant heat from the surface. And the atmosphere needs to be still, because that allows the temperature inversions that also go with rapid surface cooling leading to frosts.
But he can’t mention still atmospheric conditions! Because any scientist would then ask the next and most obvious question: are Australian wind conditions also decreasing? That is a topic that the renewables industry wouldn’t want to know about, at least until they have sucked all the subsidies out of this government.
160
I have made the same point – the person who wrote the quote t must be just as silly with brain completely out of gear.
The subsidies do not come from government in Australia apart from the fact they are also electricity consumers. The Federal Government has organised the crime syndicate that enables wind and solar generator owners to rob from their consumers. The sanctioned theft for grid scale generators is currently $55/MWh.
It is not a subsidy from general revenue. It is direct theft from consumers to give to generators, collected by retailers not by the tax department.
A lot more people would be concerned about “renewables” if they actually knew how this crime syndicate works. I am no longer amazed at how little understanding there is of the RET.
80
Rick, you quote $55/MWh as the sanctioned theft from consumers but surely it is more than that? That’s just 5.5c per kWh but we used to pay as domestic consumers around 10c per kWh before Howard allowed the bird mincers to pollute the grid and now most people pay around 30c per kWh. So isn’t the theft more like around 20c per kWh?
20
THe $55/MWh is the current cost of LGCs. All the other costs between wholesale and retail are locked in now. They will not go away if the theft stops. The owners of the transmission lines have spent a lot of money to enable the theft but that investment gets a guaranteed return. It cannot just be tuned off like the theft for the intermittent energy.
50
Gotta love his use of “nuance” in prose with science front and centre.
70
“Frost damage costs Australian farmers around $400 million each year. (Perhaps if we sold the ABC we could cover that).”
If you find a buyer for your ABC perhaps they would be willing to buy our NPR (National Public Radio) also:
[Jim Steele Corrects NPR: Setting the Record Straight on Climate Narratives
https://wattsupwiththat.com/2023/05/29/jim-steele-corrects-npr-setting-the-record-straight-on-climate-narratives/ ]
Heck, if they would be willing to buy our ABC, that would be good also. My only request would be that they be closed down permanently. Australia could keep any proceeds from their sales.
110
Fling in the BBC (UK) for free as an added incentive. We certainly don’t need it.
10
>”global warming….global cooling”
>”…southern Australia”
Worthwhile I think, to ditch anomalies for a while to get a feel for absolute seasonal warm-cool cycles.
Much of southern Australia, all of New Zealand, and all of southern South America falls within South Mid Latitudes 60S – 30S. So now to Climate Reanalyzer:
Monthly Reanalysis Timeseries
https://climatereanalyzer.org/reanalysis/monthly_tseries/
Dataset: Default
Variable: 2m Temperature
Level: Surface
Month: Annual
Region: South Mid Latitudes
Anomaly Values: Null
All Months: Tick
Plot
Scroll down to see Selected Area. Any warming that occurred in this latitudinal band occurred prior to 1980. There has been stasis for over 40 years now i.e. no “climate change” whatsoever.
The summer-winter temperature fluctuation is highly modulated by the ocean being between 8 – 13.5 over those 40 years.
Compare to land dominant North Mid Latitudes where there has been no climate change over the entire 75 years and temperature fluctuates widely between 0 – 20.
I’m curious how the UN and IPCC could possibly apply their “1.5C limit” to these 2 graph profiles. If anything, everyone seems to be immune and safe from any such threat, real or not.
And see next re frost seasons in southern Australia.
60
Ok, South Mid Latitudes doesn’t tell us anything about the frost season across southern Australia and there’s no way to isolate by longitude with this tool (other similar tools do enable that) to confine to Sth Australia or Victoria for example. Closest is either all of Australia (no climate change) or Tasmania and New Zealand.
Tasmania and New Zealand give no clues that I can see so I can only think that this is a localized phenomena (e.g. diff West Australia to East) that requires detailed localized analysis rather than any broad-brush global or even regional approach.
It is that fixation on global-regional that missed 58 years of local.
Also the idiotic Clausius-Clapyron derived fixation on the “warmer air holds more moisture” mindset. Dr Crimp points out the flip side:
“As anyone knows who’s outside at night in winter, you have to have those clear night skies and the atmosphere needs to be very dry”.
I would add that a frost day is when the minimum air temperature recorded is below 0 degrees Celsius.
What happened to the “warmer air”, “warming world” ideation?
30
>”there’s no way to isolate by longitude with this tool (other similar tools do enable that)”
Like WRIT for example:
Web-based Reanalysis Intercomparison Tool: Monthly/Seasonal Time-Series
https://psl.noaa.gov/data/atmoswrit/timeseries/index.html
Australia Lat Long Map
https://www.mapsofworld.com/lat_long/australia-lat-long.html
For a grid area bounded by 30S, 150E (includes Canberra), Hobart and Adelaide:
Defaults except
2m Min Air temperature (or Mean or Max or Humidity)
Lat -30 -43, Lon 139 150
Create Plot
Scroll down for Time-series Statistics: Slope
+0.24 K/Decade for Min (rounded).
That slope is skewed by the data after about 2010. 1979 – 2010 slope is -0.0088 K/Decade
Only 1982 was below winter frost day threshold (273.15 K) for a one month average and for an the entire grid selection.
So no clues from temperature. Relative and Specific Humidity point to plenty of dry winters so I suspect similar analysis of local meteorological guages would be more illuminating.
30
>”So no clues from temperature. Relative and Specific Humidity point to plenty of dry winters so I suspect similar analysis of local meteorological guages would be more illuminating”
Found this:
‘Unusually cold and dry winters increase mortality in Australia’
Cunrui Huang, Cordia Chu, Xiaoming Wang, Adrian G Barnett (2015)
https://pubmed.ncbi.nlm.nih.gov/25460613/
Abstract
[Snip]
We found that deaths rates in Australia were 20-30% higher in winter than summer. The seasonal pattern of mortality was non-stationary, with much larger peaks in some winters. Winters that were colder or drier than a typical winter had significantly increased death risks in most cities. Conversely summers that were warmer or more humid than average showed no increase in death risks. Better understanding the occurrence and cause of seasonal variations in mortality will help with disease prevention and save lives.
# # #
“Winters that were colder or drier than a typical winter had significantly increased death risks in most cities”.
Do those winters correlate to increased frost days?
Seems sensible.
40
This is unacceptable. If everyone did this they would know that Greenland is the location of most warming and mostly in January. Up almost 10C (well above the permitted 1.5C before hell opens up); now hitting MINUS 20C where it was down around MINUS 30C a few decades ago.
50
Rick >”well above the permitted 1.5C before hell opens up”
Exactly. Once you move away from the meaningless Global Mean Anomaly the “1.5C limit” makes no sense in application (Phil Jones admitted this – see below).
>”Greenland is the location of most warming and mostly in January”
1983 was the coldest January (-25.75 average). Using WRIT (see upthread) all months and Lat 60 84, Lon 295 340, the slope 1948 – 1983 is -0.17 K/decade.
But 1983 – 2023 is +0.68 K/decade or 2.72 K over 4 decades. That’s 1.8 times the IPCC’s “1.5C limit”.
I don’t think the IPCC thought this through. Phil Jones actually admitted that (re old 2C limit):
Climategate 2.0: Jones says 2-degree C limit ‘plucked out of thin air’
https://junkscience.com/2011/11/climategate-2-0-jones-says-2o-limit-plucked-out-of-thin-air/
Jones – “If it is 2 deg C globally, this could be more in Europe – especially the northern part”.
Application of that “limit” anywhere other than a Global Mean Anomaly is just silly.
50
I should add re the WRIT Greenland graph, the summer Max is almost constant around 278 K.
Winter Min is where the wild swings occur. Anywhere between 243 and 256 K for monthly average.
So the 1983 – 2023 +0.68 K/decade trend is determined by Min – not Max.
Apparently GHG forcing has a differential effect on Greenland – all Min, no Max.
30
Jones – “If it is 2 deg C globally, this could be more in Europe – especially the northern part”.
Greenland for example using 1.5 above the 20th Century 13.9 C global average = 15.4 or 288.55 K.
So if Greenland summer is normally 278 K Max, Greenland has a 10 K buffer and there’s nothing to worry about.
That was what Phil jones was getting at.
20
Summary
Assuming 288.55 K “limit” (13.9 + 1.5 = 15.4 C)
2000 – 2023 latitudinal band monthly data.
Northern Polar 60 90 Mean: 264.317 (24 K under)
Southern Polar -60 -90 Mean: 254.419 (34 K under)
Northern Mid 30 40 Mean: 288.421 (< 1 K under)
Southern Mid -36 -40 Mean: 288.26 (< 1 K under)
Tropics -20 20 Mean: 298.843 (10 K over)
Mid latitudes are conventionally 30 60 or -30 -60. Both are well under; North Mid is 6 K under and South Mid is 5 K under the "limit".
I closed up the Mid bands to show where the global average "limit" is closest to being equaled. These are the only 2 bands where the global average "limit" actually means anything and can be applied (sort of).
That folks is my application of the IPCC's global average 1.5 C "limit" – hopefully demonstrating the absurdity of the arbitrarily contrived concept.
00
Global temperature has been steady for the last 9 years (even though CO2 levels have increased) and in the Southern Hemishere there has been a fall in temperature
90
‘ … you have to have those clear night skies and the atmosphere needs to be very dry,” he said.’
He could have also said there are these intense blocking highs in both hemispheres and we have no idea why its happening.
70
‘A series of large high pressure systems centred over and to the southwest of Australia this month have caused a persistent stream of cold air to flow across southeastern and eastern Australia.’ (Weatherzone)
00
I have be claiming for a while now that the BoM homogenisers will have to be much more creative than their NH collaborators to maintain a warming trend.
The ocean surface at 35S reached its maximum solar input 500 years ago. That means that the peak land temperature reached in February will be in decline and the peak ocean temperature reached in March is either in decline or close to it. The maximum annual temperature for both ocean and land at this latitude has most likely already peaked in the present precession cycle. This latitude is at the very start of an 11,000 year cooling trend.
Top of the atmosphere insolation for January at 35S back 1000 years to 500 years in the future:
-1.000 510.398265
-0.900 510.471652
-0.800 510.526263
-0.700 510.562295
-0.600 510.579999
-0.500 510.579665
-0.400 510.561620
-0.300 510.526206
-0.200 510.473778
-0.100 510.404688
0.000 510.319284
0.100 510.219453
0.200 510.103695
0.300 509.972197
0.400 509.825162
0.500 509.662803
The Southern Ocean at 60S has been getting less January sunlight for 800 years and has been cooling for the entire satellite era.
100
This to me, is one of the hallmarks of ‘Climate Change’.
“In our sincere efforts to understand the effects of Climate Change and maintain funding, we present this evidence that indicates the opposite change that we sincerely predicted. Please don’t notice as it may negatively impact our funding.”
We aren’t hiding anything.
Provided you read to the end and do a bit of ciphering*.
We are just promoting attention spans and reading comprehension.
Plus, science is about sincerity.
*(Discouraged when it comes to Renewable energy.)
80
We don’t have anywhere near enough accurate data or processing power to make any weather/climate model work and over longer terms the variables multiply . Don’t know why Canberra gets frost as they have an inexhaustible supply of hot air (and stupid).
110
If the climate cools, the subsidy harvesters will be asking for money to build coal, gas and nuclear power stations.
However, these power generation options work perfectly well in a free market and don’t need subsidies.
So instead, I guess government will just add a levy to your taxes to transfer money directly to the bank accounts of said harvesters…
70
A couple of years ago I manually downloaded BOM data from my regional city for the last 130 years. The data being yearly average max and min temps. For my inland regional city location there was a slight increase in max temps, but a slightly more decrease in min temps over that time period. Hence , the lows were lower which agrees with this article. The overall trend line is flat/ slightly decreasing when you then plot average of those max/ min temps to get a “ mean” daily temp. Interesting, when I do the same for Cape Otway lighthouse over 150 years the exact opposite occurs. Lower max& higher min. But the mean daily temp is still essentially a boring flat line. We’ve been told for decades that global warming would increase overnight temps- it possibly only happens in coastal locations. #climatescam
101
Every morning, early, I check in with Ed, the owner of the site I call ‘home’, in Harrisburg Pennsylvania.
The first thing I mention after the good morning is the weather, and his response always mentions his weather as well.
Now, here’s something about the weather here where I live in Beenleigh, South East Queensland.
I look out across the front balcony, and that covers the area from North East to South West, and then out the front door to look at the the other side, so a full 360 degrees of sky.
I have checked back on my morning communications, and going back to May 17th, (so thirteen days now) there has not been a cloud in the sky anywhere, out to the horizons I can see. Cloud is predicted with showers for this coming Saturday, so if that cloud free days persist, then that will be sixteen days with not a single cloud in the sky.
I can’t recall ever seeing that at all.
Under those clear skies, the mornings have been cold, all of them in single figures, another thing I haven’t seen in May here at Beenleigh since I have lived here, and we moved here in August of 2018, so five years now.
I use the Weatherzone site and for Beenleigh, the local weather station is located at Redland, and that’s closer to the water than we are here in what is now designated as Logan, and because of that, the quoted minimum at Weatherzone is always a little ‘milder’ than here. That is borne out when I watch the evening news on Channel 9, which always gives the ‘Logan’ minimum as two to three degrees colder than the Weatherzone site at Redland, and for about three weeks now, those single digit minimums have been around the 3C mark on the Channel 9 News.
Even so, the Weatherzone site has the May minimum average at a full two degrees colder than the long term average, and I would put that down solely to the clear, cloud free skies each morning, and it’s always warmer under overcast skies.
But hey, all of what I have said here is only …..‘anecdotal’, eh!
Tony.
180
I have been conducting an experiment at 37S to compare the surface cooling contributions of radiation and convection. My experiment is being confounded by the persistent high humidity over the past two weeks. Yesterday the local weather station had a minimum near surface humidity of 89%. It was stuck at 100% for 32 hours prior to 10am yesterday. Under those conditions, the surface OLR is extremely low.
May is the month here when the surface temperature in Bass Straight gets stuck around the 15C mark where convective instability shuts down so the full atmospheric column can reach 100% humidity:
https://earth.nullschool.net/#current/ocean/primary/waves/overlay=sea_surface_temp/orthographic=-213.73,-37.31,3375/loc=145.064,-38.819
https://earth.nullschool.net/#current/wind/surface/level/overlay=relative_humidity/orthographic=-213.73,-37.31,3375/loc=145.064,-38.819
In still conditions, the night time temperature drops to around 6C at 100m elevation near the coast so frost become likely as the distance from the coast increases and elevation increases.
The 15C ocean surface temperature is where the atmosphere changes from lively to depressing.
The Dr Crimp statement has a logical flaw:
So how can the night air be very dry but it is 100% humidity at ground level?
To get a frost, there needs to be 100% moisture in the air near ground level. The formation of frost depends on the dew point being below zero. And the dew point does not vary much throughout the day in the still conditions required to form frosts. Most of the surface heat loss at night is from the descent of chilled air/water as the surface equilibrates with the dew point. The radiative heat loss is relatively high in the atmosphere due to the high humidity and is probably under 200W/m^2 in frost forming conditions with radiating temperature around 250K and surface a tad under 273K.
90
Intense blocking high causes marine heatwave.
https://earth.nullschool.net/#current/ocean/surface/currents/overlay=sea_surface_temp_anomaly/orthographic=-172.73,-50.63,1060/loc=-173.365,-48.234
10
And over on “Weather tricks zone” they’re now spruiking a “hot, dry spring”. It was going to be a hot, dry autumn but that didn’t materialize. The climastrologist doomsayers are getting more and more desperate by the day as their prophesies are not materialising. What if some sheeple wake up while we’re waiting for the next prediction to come true?
70
BoM is also predicting a mild and dry winter.
What is your forecast?
00
Also worth a read at Electroverse-
https://electroverse.info/australias-coldest-ever-may-temps-avalanche-kills-11-in-pakistan-u-s-shivers-rains-continue-to-pound-europe/
40
The moral of the story is: these are their predictions and they are wrong. No amount of “surprises” can change that fact. So what they say will happen, probably won’t. Simple.
60
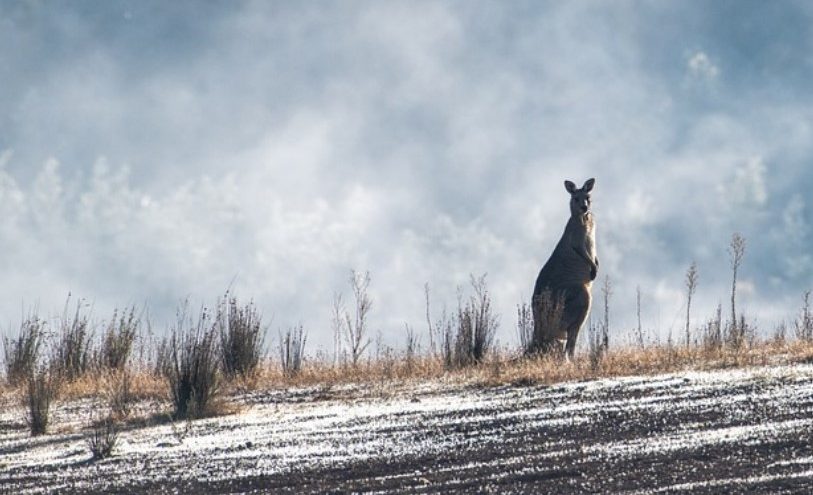
Soon – the return of the great white wooly kangaroo?
If that happened, what are the odds they’d blame it on global climate warming dystopian disruption.
“Warmest year EVAH,” lolol
….Wait! What?! They’re a thing????
https://3.bp.blogspot.com/_iziY6saJbrw/TUrTpidEJ_I/AAAAAAAAAAQ/XkFSDuC8Qqw/s1600/white_kangaroo_2.jpg
Who knew? 🤷♂️
30
Pilloried.
An appropriate comment, because yes, their ABCCCC does have piles.
https://joannenova.com.au/2023/05/thats-a-big-climate-surprise-frost-season-growing-longer-across-australia-and-for-years/#comment-2674946
20
“yes, their ABCCCC does have piles.”
Yep, huge piles of it ! 😉
30
Global warming ‘science’ has lost,
Being useless, at a terrible cost,
As their heat without end,
Is bucked by the trend,
Of Australia’s more nights of frost.
120
Monday 22 May I drove from Sydney to Orange NSW and noted Snow & Ice signs displayed at intervals along the Great Western Highway, and crossing the Great Dividing Range warnings about ice on road ahead.
Thursday 25 May I drove from Orange to Dubbo NSW and observed more Snow & Ice warning signs.
Early mornings minus 2C a couple of times.
70
This is another one of those stories about how warming causes cooling. Looking forward to reading the creative ways in which some ideologues will try to spin it.
30
Casino will have its lowest May minimum mean on record. May 1917 – 7.3C. May 2023 – presently 7’1C wring another cold morning predicted for tomorrow.
Lismore will too. 1927 – 7.1C. 2023 – 6.7C
Some may find others as well.
90
Ahem! That should be “The IPCC experts were sure would be FEWER frosts in Australia…”
40
But, but, you don’t understand how it works. Less frosts, that’ll be climate change. More frosts, that’ll be climate change. The climate mutates and evolves to fight ‘the science’, worship the narrative you unbelievers.
30
If the IPCC et Al stay true to form the next logical step they make will be to artificially reduce the atmospheric CO2 levels to match the frost data
41
What is a — climate applications scientist —? He plays with his models all day, lives in a world of simulations?
“Climate surprises” — I mean really? Is that a bit like a weather surprise? You know, when the Bureau of Australian CAGW – oh sorry Meteorology forecasts a sunny day, then clouds appear, and it starts raining.
30
In the UK the Met Office have spent billions on supercomputers to model and forecast the weather. My observations are that their forecasts are only accurate-ish up to three to four days, after that it’s anybody’s guess. So, why should anyone believe their gibberish about what is or isn’t going to happen in the near or far future ? And, where I live the weather can vary, dramatically, over a distance of a mile. So, all these complex global models that calculate the weather to a maximum resolution of 100km blocks seem to me to be meaningless. I suspect that Oz’s climate is more stable (?) than the UK, but I’m sure modelling it is just as difficult and prone to GIGO.
20
Thanks Jo for alerting us to this data. It is highly significant in light of the science of Global Warming according to the IPCC.
I their report (p 750 AR4 report ) they specifically claim that , on the basis their understanding of the science they confidently hypothesise that under the influence of enhanced greenhouse effect the following effects will inevitably ensue.
1) minimum temperatures will rise due to heat trapping . (Thus resulting in increased average temperatures, I.e. Global Warming)
2) Because minimum temperatures will rise more than maximum temperatures the temperature spread (Tmax-Tmin ) will reduce
3) the rise in minimum temperatures will result in reduced frost days.
The hypothesis as expressed in these predictions is entirely testable.
Australia is a great continent to test this hypothesis.due to its geography and very low population density .Specifically Central Australia
With the release of this data now ALL THREE of these predictions FAIL !!!
The hypothesis that the EGE will trap additional heat resulting n Global Warming is comprehensibly debunked
60
About 5 years ago I posted on a few blogs some graphs showing the hottest heatwaves each year, for heatwaves of 10,5,3, and 1 day duration. I did both raw and ACORN-SAT temperatures for 8 major Australian cities, resulting in 64 graphs to cover predictable questions from readers.
The conclusion was contrary to the IPCC dogma that heatwaves are increasing in temperature, duration and frequency. That conclusion was based on about 5 papers, all of them starting about 1950, while 2 of my graphs went back to the 1860s.
TLDR, I next started to look at coldwaves because that was logical. Then Covid struck and I shelved that line of work.
It is quite important to do it. Coldwaves are of course related to frost days, but it is hard if not impossible to use just Tmax and Tmin to study them. You need to have dew point and humidity measurements to work with.
It is IMPORTANT because although temperatures can have instrument errors that distort the analysis, the presence of frost is more or less absolute. It is there or not there no matter what the thermometer says.
I turn 82 next month and have just had eye surgery, so it would be beaut if some youngsters stepped up to the plate to do the coldwaves calculations. Simpler than heatwaves because you do not need to run Darwin and possibly Brisbane, too few frost days to bother.
Volunteers?
Geoff S
50
Folks,
The climate models are built from 2 out of 5 major climate system components. With only 40% of the climate system represented at all, the theory is that 100 year predictions are quite feasible. Only the atmosphere and ocean are included, albeit at far too low spatial resolution, but the lithosphere, the cryosphere, and the biosphere are not included in the calculation. The last three components are crudely modeled and added on top of the results from the interactive atmosphere-ocean components. The input data to constrain the models do not exist, so guesses, called parameters, are used instead. Then, the atmospheric-oceanic models are allowed to run forward, but soon they diverge. The solution is to force them back together. Since the input data are arbitrary parameters anyway, this seems quite OK to climate modellers. At the Hadley Center, the climate models and the weather models are the same programs, used somewhat differently. The weather is largely determined by what is going on ‘upstream’ in the extant weather pattern, which may be extrapolated as weather systems move. We all know how far ahead weather predictions are accurate, less than 72 hours; a week out and you just as well can flip a coin. Prediction of 100 years is ludicrous. Someone on this site said that climate modeling is a waste of money. It is worse than a waste of money, it is also a waste of energy. Each super computer requires several hundred megawatts to operate. The computer output, i.e. global warming is due to CO2 accumulation, is nonsense, but is being used to justify the destruction of economies by spending huge amounts of money on unworkable ‘renewable energy’, over 6 $trillion already, with about 200 $trillion programmed for the coming 27 years (NetZero 2050). Energy shortages are appearing, blackouts, and worse, energy poverty is already rampant. However, you can bet your last dollar that the politicians and top bureaucrats, and all ‘Murdochs’ have their own energy supplies set aside. Bill Gates is building his personal nuclear reactors.
Wake up, Australians! Your government cares NOTHING about your future. Take your government back. We have the same problems in the USA and Europe. Only the Asians are working to keep their economies functioning by burning coal in ever increasing quantities.
30
[…] En stor klimatöverraskning: I åratal har frostsäsongen blivit längre i hela Australien […]
10
[…] SOURCE: Jo Nova […]
00
[…] That’s a big climate surprise: Frost season growing longer across Australia (and for years!) […]
00
[…] Into The NewsStudy: Global Warming Trend Is ‘Only One-Half of the Climate Model SimulationsThat’s a big climate surprise: Frost season growing longer across Australia (and for years!)The Social Cost of Carbon gameEffects of Deliberately Exaggerating the Risks of Climate […]
00