
Cambridge University Press
The Australian Bureau of Meteorology may not be meeting WMO, UK, US standards
Since the Australian BOM allows for one second “records”, it’s not clear it is even meeting guidelines recommended for amateurs.
The key question: How much of the warming trend in Australia is due to the switch in the mid 1990s from older slower thermometers to new electronic zippy ones that could record every waft of hot air? How many records today are just noise?
If the BOM would release its calibration and comparison data instead of deleting it, we might know. Why won’t they?
Here’s an example graph from Maryborough where the daily maximum was 1.5C above every thirty minute reading. Ouch — are we writing outliers and noise into our history books and climate data bases?
Add “sampling method” and averaging to your skeptical vocabulary. There will be a lot more discussion on these.
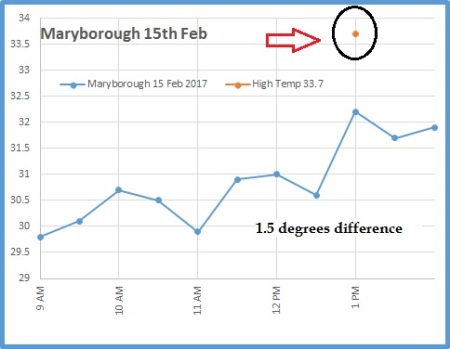
Maryborough. Graph by Ken Stewart.
Let’s consider some basic standards in the meteorology world
The Weather Observer’s Handbook 2012 tells us the new electronic sensors are more sensitive than the old mercury thermometers. The author, Stephen Burt, explains that the new electronic sensors can be too sensitive, and will record “minor random temperature fluctuations“. This means they will simply “generate slightly higher maximums and slightly lower minimums” than the older equipment did. Temperatures from new style thermometers must be averaged over longer periods to make them comparable with the older mercury thermometers, and also to “iron out minor stray electrical noise or sensor logger resolution artefacts.” h/t Chris Gillham.
The WMO, the UK Met office and the US all use longer average samples than Australia
The WMO recommend a one minute mean temperature standard be used, which is what the UK uses. In the US though, get this, meteorologists use a five minute average, and further below, Lin and Hubbard suggest it should be 7 minutes not five.

Further complexifying things — I hear the UK may put electronic sensors outside the Stevenson screens, which would make a big difference. Keep that in mind. UPDATED: Now I’m hearing, not so, it was just one photo.
Records, trends, daily ranges — they can all change with the sampling method
Was that really a record? Here’s a case where longer sampling times meant a record was not set on one day in Dodge city:

Weather Observers Handbook. Click to enlarge.
A good example is accorded by the maximum temperature recorded at Dodge City, Kansas during the heatwave which affected the southern and eastern states of America in summer 2011. Dodge City has one of the longest continuous temperature records in the United States, commencing in 1875. The hottest day on its long record stood at 110F (43.3C). On 26 June 2011 the highest 1 minute temperature observed was 111F (43.9C). However the value logged on an ASOS system was not accepted as a new record because ASOS take the maximum temperature as the highest 5 minute running mean, which was 110F. Thus the official high by the US method was 110F, tying rather than exceeding the previous record: by the WMO recommended method the maximum was 111F which would have set a new record.”
Here in Australia, with one second averaging, based on past behaviour, the new “record” could have been even higher, like 113F (45C) — who knows — which might have been measured for just one whole second. That kind of difference, which appears to be momentarily far above most of the data around it, has been entered into our official climate data online.
The Australian Bureau of Meteorology (BOM) responds with “Fast Facts”
In reply, the Bureau of Meteorology just published FAST FACTS: How does the Bureau measure temperature? Jennifer Marohasy has already responded on her blog that the Bureau are rewriting the rules (read it all).
Lets compare the Australian method to the US. In the US, researchers publish long papers on, say, the bias that occurs with two different ways of doing 5-minute averaging (more on that extraordinary detail below). The WMO only recommends a one minute average. Prepare yourself for the Australian BOM’s answer about why they don’t even do that (get ready to be surprised). Engineers everywhere may be crying…
The guide recommends that temperatures be integrated over time to smooth out rapid fluctuations. There is more than one method of achieving this. The WMO guidelines do not prescribe which method to take. In its automatic weather stations the Bureau achieves this by using platinum resistance thermometers. These are comparable to mercury in glass thermometers.
Say what? “Comparable” to mercury in glass? That last sentence goes against everything in the WMO guidelines and the handbook. It blithely writes off peer reviewed papers, not to mention engineering-common-sense. Apparently the BOM are claiming a bucket defacto-averaging kinda-in-the-system. Because their electronic sensors are inside the Stevenson screen, there is a sort of averaging — a lag, or a low pass filter — but probably one that changes minute-by-minute with the wind-speed. They also claim that the response-time of the sensor is as long or longer than the changes in the temperature of the air. (Color me unconvinced, where is that data?)
As Jen Marohasy points out, this is far from a declaration that the electronic sensors are averaging temperatures in the same way that the old slow liquid-in-glass ones do. (Did I mention the data….?)
The BOM:
This means that each one second temperature value is not an instantaneous measurement of the air temperature but an average of the previous 40 to 80 seconds. This process is comparable to the observation process of an observer using a “mercury-in-glass” thermometer.
Spot the weasel-word “comparable” (in both paragraphs). Comparable is not equivalent. One and ten are comparable, but they are not equivalent. (Just like one second and sixty seconds, Hmm?) When Ken Stewart looked in detail at the Australian data he found a lot of volatility — in the most extreme case, temperatures fell by almost 3 degrees C in under one minute. In 44 of 100 cases, temperatures changed by more than 0.3C in the following minute. That doesn’t smell like “smoothing” or averaging. Think about what kind of overarching volatility it would take to create a smoothed average that still had that kind of instability.
The bottom line: What we have is 20 years of incomplete raw data that includes random noise recorded from instruments that are nothing like the ones used for about eight of the last ten decades in Australian climate history. Somehow we are supposed to connect that data together?
The Bureau has a budget of $365 million a year, yet it’s looking like they have thrown away the raw detailed data for the last twenty years that might have been useful. What we are left with is — we have to ask — possibly not salvageable?
Where to from here?
The first thing the BOM needs to do is store all the b—– data. Second, it needs to make that public. Then we need to talk about changing the BOM sampling process and getting some averaging done properly. Then we need to set up a search and rescue team to go back through the last twenty years of electronic data and see what they can do. At this point, it would take a group of PhDs years to set up replica stations in many different conditions to gather enough data to be able to kinda “back predict” what the electronic data should have shown had it used a proper averaging method.
A one second wafting hot spike,
Gives a false average temperature hike,
Which for sensors is crude,
And with past records skewed,
Are the methods the B.O.M. like.
–Ruairi
________________
The Nitty Gritty: How temperatures are supposed to be measured
Now we get into some more detail about how different the standards are overseas. We get a better idea of things that muck up the data, so we can all start to appreciate how tricky this is — and perhaps what better management and processes might look like.
Even the US five minute averages are not necessarily good enough
A paper by Lin and Hubbard discusses in extraordinary detail how a systematic bias occur. They have complex graphs showing how different sensors respond to changes in air temperatures at different temperatures, and with different wind speeds. (TX, means maximum temp. TN means minimum.)
Liquid in glass thermometers are fundamentally different from electronic (platinum resistance) thermometers. They are not equivalent:
Although the LIG thermometers in the CRS also is an instantaneous observation for TX and TN the relatively large LIG thermometer’s time constant plays an exclusive role in filtering out high frequency temperatures and exponentially weighted smoothing temperature signals.
The bias (error) can be as large as 0.2°C (and they are talking about 5 min averages):
For the ASOS observations, the ASOS does have a 5- min running average for daily TX and TN, however, the even smaller sensor’s time constant in the ASOS makes its biases systematically significant (0.05–0.2 °C warmer on average TX or cooler on average TN).
Hence they recommend 7-minute averages:
.. “Commonly-used 5 min average was not sufficient for the fast-response thermometers in surface climate networks while the WMO standard thermometer (20 s time constant) should have a 7-min running average for reporting daily maximum and minimum temperatures. The surface temperature sensors with smaller time constant than the standard LIG thermometers must implement a follow-up running average algorithm.”
Calibration alone is not enough to remove this effect:
It should be noted that most of surface temperature calibrations, even highly accurate calibrations, are unable to remove out this type of out-of-phase uncertainties in the TX and TN because the instrument calibrations for climate networks usually are of static calibrations rather than a dynamic calibration process for the electronic surface temperature sensors and the LIG maximum and minimum thermometers…
Is that warm bias bigger than the cool bias?
From the same paper: In the field the maximum temperatures (fig 8) are affected more than the minima (figure 9). Note that they are comparing two different ways to average 5 minute readings, and they still find a difference. They are not looking at the change from one-second to five minutes. That is something entirely different.
Daytime air turbulence intensity usually is stronger than that during nighttime, thus, it is understandable that the TX differences shown in Figure 8 were larger than the TN differences in Figure 9.

Maximum temperature bias from different sampling rates. Lin, Hubbard. Figure 8.
…

Minimum temperature bias from different sampling rates. Lin, Hubbard. Figure 9.
Thermometers circa 1912
The whole point of averaging is so we can compare modern temperatures with ones recorded a hundred years ago. So check out Thermometric Lag (1912) which looks at the response time in different media including air at different wind speeds. The chart comes from a study published by the American Meteorological Society. Basically, if the wind is very still (slow in cm/sec) it takes a lot longer for a thermometer to respond to a change in temperature outside the screen. A thermometer in air may take over 3 minutes to respond on a still day. When wind speed is very fast, the change is more rapid.

..
THE BACKGROUND LIST — Scandal after scandal
- BOM Scandal: One second records in Australia — how “noise” creates history and a warming trend
- Another BOM scandal: Australian climate data is being destroyed as routine practice
- BOM scandal: “smart cards” filter out coldest temperatures. Full audit needed ASAP!
- BOM scandal heats up: Kininmonth, Watts, Nova quoted in The Australian “We audit banks, why not BOM?”
- Scandal: Australian Bureau of Meteorology caught erasing cold temperatures
- On Sunday, Goulburn got colder than the BOM thought was possible (and a raw data record was “adjusted”).
- Two-thirds of Australias warming due to “adjustments” — according to 84 historic stations
- The mysterious BOM disinterest in hot historic Australian Stevenson screen temperatures
- The lost climate knowledge of Deacon 1952: hot dry summers from 1880-1910
- 1953 Headline: Melbourne’s weather is changing! Summers getting colder and wetter
- The mysterious lost hot Sunday in Bourke, did it really happen?
- Wow, look at those BOM adjustments – trends up by two degrees C!
- Australian BOM “neutral” adjustments increase minima trends up 50%
- Was the Hottest Day Ever in Australia not in a desert, but in far south Albany?!
- Hottest summer record in Australia? Not so, says UAH satellite data
- Mystery black-box method used to make *all new* Australian “hottest” ever records
- BOMs new data set, ACORN, so bad it should be withdrawn (954 min temps larger than the max!)
- Threat of ANAO Audit means Australia’s BOM throws out temperature set, starts again, gets same results
- Australian Temperatures in cities adjusted up by 70%!?
 All kinds of other oddities of Australian temperature records were discussed in my chapter “Mysterious Revisions to Australia’s Long Hot History” in the new book Climate Change: The Facts 2017. Co-authors include Clive James, Matt Ridley, Willie Soon, Roy Spencer, and Anthony Watts. Get your copy now, the first edition sold out. Also available as Ebook on Amazon.
REFERENCES
Lin & Hubbard http://onlinelibrary.wiley.com/doi/10.1002/joc.1536/pdf Int. J. Climatol. 28: 283–294 (2008)


If BOM won’t publish the data, the algorithms or anything else they hold secret then it has to be assumed this is because BOM have no confidence that any of this would survive public scrutiny.
If BOM believe what they are doing is scientifically sound then they must ‘Publish and be Damned’.
But the ‘Damned’ bit is probably, in their eyes, the root of the problem .
524
Excellent comment Roger. In the scientific world, which BOM claims its place, publication enhances the scientist’s recognition and stature, including pay scale.
Therefore, to adamantly avoid publication and discard public data, in and of itself, suggests that BOM is not telling us all they know. Moreover, the data they collect is public property and belongs to the citizens.
324
In the end its about the money and how to get more. Quality is a useful thing if it can get you a bigger budget. Australia is guv bloated. Its a terminal disease.
181
I think its only fair to ask for the raw data to be published, after all, what do they have to hide?
I remember once asking for some de-personalized stats from another govt dept, and they treated me like a misbehaved school boy for daring ask for such things, that implied one of their sacred cows not be as advertised….I was sent into a bureacratic red tape trap, so I gave up. But, I did get the stats I wanted from another state in the end and it seems to explain *exactly* why the first mob where so protective.
What I conculded from that is that its not just the BOM, its anything that is required to protect carefully crafted govt social engineering.
An ignorant population is a complaint population.
172
…”compliant population..”
31
True! Complaints are more likely to come from an informed population.
30
“I think its only fair to ask for the raw data to be published,…”
If Jen’s blog post is accurate, then the “raw” data will be the maximum and minimum values over the previous time period, or perhaps the average of these two. This would show a significantly different picture to a trailing or “running” average weighted to match LIG responses.
However, BoM will no doubt suggest that they are abiding by WMO standards, as WMO specifies an average over the period (which they are doing), but not how that average should be calculated, or even that the averaging process should be selected to approximate LIG – they IMPLY it should, but don’t explicitly say it should.
I would strongly suggest that the best approach here is not to accuse them of not meeting WMO standards, because they can defend that they technically are following the standard. Rather, we should be asking them to defend the averaging method they have chosen – if they had a choice to make on exactly how to meet the rules (which averaging method to use), then they should at the very least have a discussion paper or meeting minutes on how and why they chose the method they did. If not, why not? If not, who decided on this method and based on what criteria? Can BoM cite peer reviewed papers in support of the method they chose? If not, why not? Did BoM perform exploratory research on the effects of various averaging methods prior to deciding on the method they used? If not, why not?
101
What was it Mencken said? “The whole aim of practical politics, is to keep the population scared, and clamorous to be led to safety, by menacing it with an endless series of hobgoblins, all of them imaginary.” Global warming/climate change/ocean acidification are only the latest in a series of hobgoblins that included Alar in apples, DDT, Y2K,and the hole in the ozone layer, the last being a naturally occurring phenomenon which occurs for 3 months every year as the polar vortex breaks down at the end of the Antarctic winter. The greens have mindlessly embraced each and every cause as a threat to Gaia the earth mother…..and in each case someone has made a financial killing while real businesses shrivelled and died .
41
I think we are now in the “complaint” category, thanks to Jo and Jennifer,as we are no longer ignorant.
20
Not quite the raw data as its only stations with a long trend but it does suggest something not consistent with 97% consensus.
https://realclimatescience.com/2017/09/plummeting-temperatures-in-australia/
10
Roger- I am in complete agreement.
No full methodology, no complete datasets means no accurate/reliable/reproducible results.
Any reputable scientist knows this.
But who says climate “scientists” are reputable(other than Flannery/Scientifically ignorant celebrities and politicians?)
194
Because of the BOM’s failure, climate “scientists” now have someone to blame. The excuse will be “I used the BOM’s data.
223
Well if that’s what it takes CC let them get on with their recantations.
The evidence supports the Null hypothesis. They’ve never had a better chance to climb down and save their credibility.
31
In my book, a reading of any instrument is noise until proven otherwise. In most cases, proof is very difficult to produce. Especially if you are trying to prove your theory about what you are measuring is true.
It is almost always best to assume you are lying to yourself. Check both your visible and hidden assumptions and your premises. Check again. Oh, and check one more time. Even then, expect to be surprised by what you find. It is more than likely you have missed something very important that will strongly affect the end result. There is almost always a simple truth to be discovered that will blow a huge hole in your most cherished wishes.
The bottom line is reality is what it is and not necessarily what you want it to be. Reality’s responsibility is only to be what it is. It is your responsibility for discovering what it is and acting accordingly. The quality and quantity of your life depends upon it.
233
Richard P. Feynman
241
“If you want to keep a secret, you must also hide it from yourself.”
― George Orwell, 1984
111
If this was happening in private industry the entire department would be fired. Why do we not hold government to the same standards of accountability as in private industry?? SMH
233
Because it is the government and, according to the government, whatever the government decides to do is the right thing to do. Unfortunately, the government’s standard of right is anything that expands the reach, power, and intrusiveness of government into the lives of the governed. Sadly, this is the only thing that governments are good at doing.
Government is very much like a lit match being tossed into a dry grass outback. It starts small and soon grows to being able to create its own fire storm that consumes all in its path. It doesn’t stop until there is nothing more to consume.
152
No, it is because there is no valid global climate science and no competent climate scientists. This morning I watched a portion of a public television program on new congressional (USA) attempts to come to a bipartisan approach to saving Obamacare. Absolutely none of them shows the slightest understanding that their efforts are in vain, because their basic premise — that Obamacare should be saved — is wildly, obscenely false, as millions of Americans in that system could tell them. Neither the people nor the government have the money to make it work; yet, as in the climate “debates”, their answer is to double down on forcing everyone into a losing system.
The Australian BOM is merely doubling down on the incompetent science. This should have been absolutely obvious to everyone in 2015, when the scientists, after generations of “global temperature measurements”, changed their program in order to argue that there was no 20-year-and-counting global warming “pause” (so that, in turn, they could double down on their incompetent “science” of the “greenhouse effect”, which the very best, in-situ evidence — that means evidence in the atmosphere itself, not in somebody’s laboratory vessel — does not exist, and can’t exist, due to the global stability of the atmosphere and the most basic, honest physics).
The bottom line isn’t even scientific incompetence, however. It is that we are in a war — in the early years of it, when most of us are not yet carrying guns, and using them — and reason was the first casualty in that war. We are seeing the world-encompassing consequences of too many, too-long-nurtured false dogmas, the worst of them now demanding to be king of the hill, against all reason.
297
Issues are a bit more complicated that they seem. I found that under fixed conditions, say as they are when calibrated in an oil or water bath or funnel of melting ice (zero degC); different PRT probes (and thermometers) can be dead accurate (exactly the same); however they can be quite different in service.
Encased in different materials of different diameter; response-time can be very fast or very slow, depending on the insulation (rate of heat conduction) by the material and its mass. So a probe bought from Bunnings or on Ebay, may not behave the same as one from Jacar or one manufactured to Bureau specifications. (Similarly for thermometers.)
It’s a tricky issue because slow conductivity could miss a peak that is real; while very high conductivity could invent a peak that doesn’t exist (someone walking past is not the weather). Call it the Number 1 conundrum in science.
The second issue is, that most of the Bureau’s ACORN-SAT sites (except perhaps three (amongst them Gunnedah and Moruya Heads PS)), use small Stevenson screens; which in most cases were introduced at the same time AWS became primary instruments; or when AWS were last up-graded. Also, replacing a screen or AWS often involves a site move; sometimes just over there; sometimes much further away (500 m or more). All these factors come together making it hard to work out categorically if it’s the AWS, the screen or the relocation.
Even more confusing is that at some sites all these things can happen and there is no impact on the data-stream. At others its an unsuspected event: at Giles in the middle of nowhere the Warakurna road just 25 m west of the screen was sealed in 2012 (you can see it on Google Earth); at Launceston, they moved the screen beside a vertical wind profiler array on a gravel or paved bed; also at Canberra and Adelaide airports, and did I mention Port Hedland or Ceduna? At Cape Leeuwin they shifted the AWS to an updraft zone on the edge of the cliff, at Low Head (Tas), it’s almost in the sea.
To create “record” and “unprecedented” heat consistent with global warming theory, they moved the sensitive instrument in its small screen at LaTrobe uni in Melbourne from a grassy woodland situation to within a few meters of a parking lot; ploughed around the site at Bourke, Dalby and Cunderdin; not to mention Badgerys Creek and Penrith Lakes; paved Woomera with bluestone gravel; and sprayed-out the grass at Amberley, Richmond RAAF, Tennant Creek and other places. At Mardie (WA), Oodnadatta and St George (Qld) the screen relocated to a dusty paddock; at Rabbit Flat and Marree it’s beside a dusty track. At Mount Joyce (Mt. Victoria) the AWS sites on a cliff above the railway service road and on the eastern side is the Great Western Highway; at Thargomindah post office it’s down the back on the corner of Beech and Elm streets which when recently widened and re-sealed caused maximum temperature to step-up.
Having examined hundreds of datasets; checked out each site using Google Earth (pro) time-lapse satellite images; historical photographs, maps, stuff in museums and archives; I’m firmly of the view that aided and abetted by politicians, professors and the CSIRO; the Bureau is engaged in the greatest fraud in the history of Australian science; meantime AGL is laughing all the way to the bank!
Cheers,
Dr. Bill Johnston.
12
I specified the logical mechanism behind government growth and you specified the working details. We are saying the same thing from a different perspective.
10
“Government of the people, by the people, for the people, shall not perish from the Earth.” – Abraham Lincoln
Constituents in Australia seem to be the nuisances that send emails politicians do not want to bother with and the voters politicians always want to meet during election campaigns.
71
Mostly right, Lionel. The other side of the coin is the very powerful desire for the managers, and this especially includes the supervising politicians—The Ministers—to cover their tender nether regions: “Not on my watch!”; pure cowardice, which shows a bad lack of imagination.
Every now and then one encounters a politician or a manager who is bold enough to take one of these bulls by its horns and `fix it,’ whatever the `it’ is which needs fixing. Usually, it’s because that individual actually understands the problem. Problems they don’t or can’t understand are not `fixed,’ but papered over and left for their successor. It seems to be a malaise which particularly affects any highly politicized organisations, so the Civil Service and its Ministers, while a specific case, are not a special case.
To misquote E, H. Lee:
`There are old managers and there are bold managers but there are no old bold managers.’
Protecting one’s Super Annuation Scheme becomes a top priority.
91
Until I read this, I thought sensors, in particular thermometers, recorded data at a fixed period (eg; 1 second), and this data was resampled after being recorded. I also thought that any reputable organisation would archive all raw data appropriately, so it could be referred to again later.
However, I am not surprised that sensors apply filters before sending the data to a recorder. I’ve worked a few sensors which can output their data in multiple formats, and, when comparing these outputs, it was obvious that one was filtered (smoothed), and the other was not (or was not filtered the same way). This was not mentioned on any of the official documentation about the sensor, and the manufacturer had to be contacted directly, so they could explain the filtering process.
As for data spikes, how hard is it to process the data and remove points which lie outside a 3x standard deviation (for example) over a fixed-width sliding time window?
Ultimately, if the core data recording and processing methods are not standardised over the entire sensor network, and are not fully documented, they might as well use the randbetween(bottom,top) Excel function, combined with the data forecasting tool, or a specialised dart-board, and a trained monkey.
223
I agree that it easy to digitally filter the raw data to provide any desired time constant but a simple, old fashioned, method would be to mount the sensors on a heat sink with sufficient thermal mass to mimic the thermal response of the old ‘mercury in glass’ thermometers.
80
With previous experience trying to measure rapidly changing and peak temperatures with LIG and Pt resistance meters I have some doubts about the chances of getting exact correlation. We had records of resin exotherms ranging from peak temperatures of 130-200℃ depending on the resin formulation and the time to get to the peak. Pt resistance meters gave higher peak temperatures and slightly shorter times to peak, when compared directly with the same resin.
Trying to use historical readings from old laboratory books as a guide to formulating a match was an art form rather than a science. In fact it was quicker to start formulating from scratch.
91
I’d vote for the “or a specialised dart-board, and a trained monkey” only trouble is BoM would train the monkey and pick the dart board! 🙁
142
There are standards in climate science?
192
yes, but like everything else in the majority of climate science, they are changed to fit the desired outcome (allegedly).
171
Yes… LOW standards!
133
Elastic standards?
50
broken elastic.!
13
Standards require enforcement, the only enforcement I see is adherence to the narrative.
110
Yes, there are minimum global warming standards that must be met for any climate science article if it is to pass peer review.
40
Jo asks,
First I have to admit that I’m a novice at this temperature measuring business. But I’m not stupid and I know far too much to swallow all this temperature madness. What I see from where I sit is a bunch of number crunching that leads to… …and I don’t know exactly what? And I’m hard pressed to see a benefit in it.
A temperature measuring device has a certain uncertainty, a likely error in the measurement. So you note that and you go on. Does averaging add any new information to what you already have? If it does I’m hard put to think of what it is. Running average, sliding average, this, that and the other average, I’m overrun with averages that add zero new information.
A useful temperature record is still a matter of just 4 things. Location, time, date and the thermometer reading. How is anything more useful than that even possible?
A trend is tied to a location as far as I can see. Earth’s average temperature is just tits on a bull. At Alice Springs there may be a warming trend and at Denver there may be a cooling trend. But what is the planet doing? Frankly I find more useful information about that in archaeological and historical data. Yes the evidence is strong that they once grew food crops in Greenland, something you cannot do now. By golly, Greenland got colder. End of story. But did that happen to the rest of the world? Who can say?
All I see coming out of this, whether it’s your BOM or our NOAA, is ammunition for people we shouldn’t give the time of day, much less place importance on what they say, to use against us politically.
Science has failed us. Or we have failed science, I don’t know which. But all this is about as useful to the guy living on side street Australia or side street USA as a case of the plague. I don’t want the money wasted anymore on keeping, no sometimes generating statistics out of thin air. How do we shut these people off? And we need to because if we don’t they’ll drown us in useless numbers at our expense.
And this thread among others is good evidence that we’re already drowning in useless numbers.
If someone wants to do all the crunching let them do it on their own time and their own dime and never, never let them influence government policy.
And now I’ll get told why I’m wrong and the red thumbs will start. But I don’t care. Arguments over even 10s of degrees of temperature much less 10ths of a degree don’t reach me because I know I can’t do anything about it. And I know I’m not causing it by driving a car or running the lights late at night, Al Gore’s latest “Oscar winner” notwithstanding.
213
One could view science like politics, law, economics and the Fourth Estate as observational, reasoning, reporting, ordering and counting tools, tools that enable analysis and help create a semblance of bottom up order in chaos. The corruption imposed by top down ideology aided by middle management laziness and a wider absence of integrity appears to have successfully twisted these indispensable tools into weapons against reason and in support of a wanton societal destruction. Inevitably, the tools must number among the casualties. After all, a tool is only ever as useful as the individual that wields it.
As Harry Dale Huffman at 4.1.1 writes:
Precisely. And yet, we all know the aphorism, ‘bad workmen blame their tools‘. Yet we hear, NOT A WHISPER.
It seems extraordinarily revealing, betraying even, that today there is no whisper. Blaming a person or thing is politically incorrect, culturally passé. Instead, blame lingers and hides in ‘systems’, everywhere and no where, a toxic infection of cultural nihilism best expressed and promoted by the eco-Marxist Left in
officialtotalitarian enculturation by ‘government’, ‘academia’ and ‘science’.A key way to fight back in this war is to go after the individual, by name. One will never ventilate or purge the The Australian Bureau of Meteorology of this infection until one is prepared to name the names, the building and the very number on the door of their office.
112
Attempting to shape the news?
https://www.cnsnews.com/news/article/melanie-arter/wh-homeland-security-adviser-asked-blame-hurricanes-climate-change
‘(CNSNews.com) – White House Homeland Security Adviser Tom Bossert said Monday that it was beyond the scope of his abilities to determine what caused Hurricanes Harvey and Irma, which made landfall in the United States in the past two weeks, and Hurricane Jose following behind in the Caribbean.
CNN’s Jim Acosta asked Bossert to weigh in on whether the Trump administration should look at the link between climate change and the two most recent storms to hit the United States.
“The previous administration saw a connection between climate change and homeland security and that the frequency and intensity of powerful storms like Harvey and Irma could pose a problem for future administrations. You could have FEMA budgets that can’t keep up with the demand when you have powerful storms hitting the country,” Acosta said.
“Is that something that you think this administration should take a look at? We know that the president pulled out of the Paris climate accord. Are these storms giving this administration some pause when it comes to the issue of climate change and homeland security?” he asked.
“I was here in the 2004 cycle of hurricanes four and six weeks that hit Florida. I think what’s prudent for us right now is to make sure that those response capabilities are there. Causality is something outside of my ability to analyze right now,” Bossert responded.”
40
I’ve begun to realize something, perhaps too late but I finally got the message. Interesting, is it not, that science has nothing in it that even pretends to say to those using or pretending to use it, that you must remain honest or that you cannot lie or cheat your way into the science hall of fame. There’s nothing in science that says you may not hijack the scientific method to further your own personal goals or those of a particular ideology. So we tend to trust science. After all, look at the huge body of knowledge gained, sometimes at great personal risk as in the case of Galileo Galilei. Now the science train is off the tracks yet it’s still barreling forward at high speed down what must ultimately be a line that ends at the edge of a cliff.
It’s the same with many things. We institute governments because we know we must have certain things individuals can’t manage by themselves: a common defense, a system of courts, a system for electing those who will hopefully be running all the arms of government for our benefit. In the U.S. the whole thing was based on government of the people, by the people and FOR the people. Yet that was the very first thing that went wrong when we decided, against George Washington’s very sound advice, and we formed the very first political parties. So from the start it went from, of the people, by the people and for the people, to of the people by the party and for the party.
And if you look at the very concept of government there was never even a thought given to whether it had anything about it that said it must run properly for the benefit of the governed. Looks just like science doesn’t it? Look at all the good to come of having governments: we can lock up murderers, thieves and the like when we catch them and even in some places we execute murderers with a clean conscience because laws tell us that’s what to do in certain cases; we can build very useful interstate highway systems; social services; so many things. Yet Donald Trump, the most unlikely candidate in the world, got elected in spite of himself because too many people finally noticed too many things gone wrong. And it started when the United States Constitution was first ratified by those original 13 states.
Now marry the 2 and we have this insufferable jackass named Al Gore making yet another movie with which to win another Oscar and then try to beat the world over the head with it to make us believe, make him richer than he already is and our governments more powerful than they already are.
And it’s our fault, you and me and every other citizen of this world for not keeping close watch over what was happening. We were and are the last defense against abuses and where have we been? So many millennials know the name of their favorite sports star but don’t know who represents them in congress. And from recent TV interviews by Jesse Watters (Watters’ World) tell an even worse story.
50
I think the word you are looking for, is “arcane”. As far as I am aware, there are no internationally agreed standards for what measuring equipment is used, how it is calibrated and against what standard, where the it is sited, how it is positioned, how the readings are taken, who takes the readings, when they are taken (time is a critical variant), … and so on. You get the drift. I think the best we have managed, internationally, is some loosely worded “recommendations” regarding “best practice”.
If you are doing some experiment in a laboratory, you will go out of your way to ensure that there is nothing that can interfere with the accuracy of measurement, and validity, and the rigour, and repeatability, of the methodology used in the experiment. You need to document everything and anything that might interfere with the observed results, at the time and place, where they were recorded, and how you have addressed those issues.
None of this applies to meteorology, in the wild. I have heard it said that, “The nice thing about meteorological standards, and practice, is that there are so many to choose from”.
If some people are rorting the system for political or financial gain, how could we ever prove it?
70
Arcane, as in unknowable by anyone not already in the know. Or so it appears.
I spent 47 years designing and implementing software and if it’s any comfort, that too is an arcane art. There are a lot of published books on how to do it but no two agree on very much. And no two programmers do it the same way either. Give me and someone else equally qualified the same assignment, same specs, every detail about the required product the same and you’ll come up with two programs bearing about as much resemblance to each other as an aardvark has to a zebra.
And the world now depends utterly on software, these days even your safety, since if you fly, the modern jet liner on average has a captain who could not pull off the landing in the Hudson river that Sullenberger did. They rely on the flight management computer.
30
And now they talk about having software design software. God help us.
30
Lionell Griffith should have an interesting comment or two on the subject. We shall see.
10
“They rely on the flight management computer.”
There is a significant difference between software development and testing for a PC, tablet or phone and for an embedded device – most especially “mission critical” devices, where human life is at stake. A typical flight management computer on a commercial aircraft that is *required* to fly the aircraft is not a single computer, but typically 3. All from different hardware suppliers and all running software from different suppliers. The software (usually “firmware”) has a limited number of input and output combinations and can be proven correct. The hardware has watchdog timers etc. It’s very safe – certainly at least as safe as any other “required” hardware like hydraulics. That is, things can still break, but there are redundant, independent backups and things fail “safe” as much as can be.
A PC or even a phone is a significantly different environment with generally far less severe consequences for failure and a far higher focus on flexibility, not reliability. The entire design, construction, commissioning and maintenance approach is completely different.
Just have a look at the hardware or software requirements for, say, a pacemaker. Each and every component of both is tested and tracked at a level that would amaze you if you haven’t seen it before – and that is “mission critical” at the individual level, not the group level like a commercial airliner.
20
I agree with you. And yet if you suddenly confront that flight management computer with only 3,000 feet of altitude and both engines dead it will not know what to do. And while some captains will manage to pull it off, those who’re lost without that computer will be dead within the next few minutes.
40
Well, they won’t make that mistake, again … 😉
40
The trouble is that when they make that mistake — their one and only chance to make it — a hundred or two paying passengers also make the same mistake — involuntarily.
It’s funny in the peculiar sense that we are still losing airplanes, even with all that technology.
Fortunately, with all the hundreds of airplanes in the air at any given time, we don’t lose very many and most pilots fly their whole career without significant incident and retire from flying still in one piece.
10
Sorry Roy. My comment appears more callous than I intended. I should have explained the background.
All trainee pilots in The Royal Air force, flying their first solo in a jet, are told, “Don’t crash the Aircraft”. On the rare occasion when a Trainee asks, “What will happen, if I do?” The Instructor says: “Well, you won’t make that mistake again, will you?”.
10
RW,
I did realize you were not very serious with that comment but I’m still serious about the consequences of too much reliance on the computer. But let’s agree that we agree about not crashing the airplane.
I don’t remember what my instructor said when he grabbed my log and signed off on that first solo but once in the air it was a very strange feeling when I looked at that empty seat beside me and realized that I was it, there was no one but me to blame or praise about the outcome.
After so many years as a programmer I have an innate distrust of software. You don’t put your life in the hands of a programmer. I’m probably overboard but the record so far is not really convincing.
You’re a sharp guy. Do you trust a programmer? Remember, hundreds of thousands of lines of code all have to be not only error free but have to anticipate everything — a very tall hurdle to get over.
That’s not really a fair question to ask so you don’t have to answer if you don’t want to. We all have no choice but to trust that programer because that’s the way things are going. 🙂
10
Let me see if I can provide a short list for you on some of rorters and some evidence that shows they’re rorting the system:
Tim Flannery
https://australianclimatemadness.com/2012/03/08/flannery-out-of-his-depth-as-flooding-rains-return/
Andy Vesey
https://myrenewables.wordpress.com/2017/08/10/agl-says-solar-wind-storage-cheapest-way-to-replace-coal/
Alan Finkel
https://cleantechnica.com/2017/07/11/investors-prefer-wind-solar-theyre-cheaper-coal/
Al Gore
https://youtu.be/vFK-UTGH1Zw
John Cook
http://daviddfriedman.blogspot.com.au/2014/02/a-climate-falsehood-you-can-check-for.html
The Australian broadcasting Corporation
http://www.abc.net.au/news/2017-09-11/gas-not-coal-the-fix-to-australias-soaring-electricity-prices/8890818
Bill “Blackout Bill” Shorten
http://www.heraldsun.com.au/blogs/andrew-bolt/column–how-could-bill-shorten-say-such-mad-things-about-global-warming/news-story/6a6952c8d6ccc707b76b75f9789c0d6b
How do you prove it? Watch their lips.
31
I would have thought, to be consistent, the standard should be a sensor made to specifications so it behaves like a standard LIG instrument. I imagine such a sensor would perhaps look like something encased in glass or perhaps a LIG instrument read electronically every few minutes with low power input.
40
RobK:

There are problems with LIG thermometers as well. As they age readings can change through hardening of the glass. The readings from one thermometer to the next can vary. Modern thermometers are ‘calibrated’ to a high and low temperature e.g. 0℃ and 100℃ for a common mercury -10℃ to 110℃ thermometer. The scale is then a linear marking, but the bore can vary so intermediate readings may be in error. Two boxes (20 total) checked at 25℃ had readings ranging from 23.4 to 25.2℃. Most were close to 25℃ but any claim that they were exact was nonsense ( 1 of the 20 only read 25.0℃). They were checked as full immersion in a water bath, not in air which introduces another possible error.
There are calibrated LIG thermometers which come with a table of measured error readings at various intermediate temperatures, but these are expensive, have thinner bores for more accurate readings (hence longer, less easily handled) but don’t last for more than a few years unless recalibrated. I doubt that the Public Service purchasing Department bought any. I also read that the BoM took these ‘off the shelf type’ thermometers and used them without checking. If so, further proof of incompetence.
121
I have a set of NIST calibrated glass thermometers (true!) and they each have calibration info as you mention and also a schedule for re-calibrating. According to the sheet they are 26 years overdue (also true!).
30
Very good information clearly ignored by our BOM. You would think their full time 350 scientists might have made these points instead of producing glossy brochures on Climate Change.
So 0.5C is a reasonable variation for the bulk of historical records without any real change in regional temperature This questions the fundamental claim of century warming in the first place, not just the elimination, discarding, ignoring, homogenization, area averaging, massive interpolation and extrapolation of data and of course the alterative of source data.
Then there is the question of relative from a 1910 thermometer to a modern one plus the connection of a modern thermometer to an electronic one. Resolution is not accuracy and increasing resolution raises more serious questions about older records and absolute accuracy. Considering the entire $1,500,000,000,000 a year is being spent to prevent alleged shifts in temperature of 0.8C from 1900 and 0.0C in the last twenty years, you could be forgiven for thinking Global Warming was all made up by the UN committee for Climate Change. That is before you even get to the disproven hypotheses of CO2 driven warming and man made CO2 change.
20
Alternative –> Alteration. No data should be changed! It should be recorded and kept for all time without alteration.
To change raw data is to commit a great sin in science. It used to be kept longhand in ink, never to be altered.
Change interpretation by all means, but never alter data. I learned this in my first experiment. It remains an absolute law of real science. To read of routine alteration of data as a common practice in the BOM is beyond belief. That is like fiddling the books to balance the ledger. It should be criminal and at the very least unethical.
20
In fact the department head would not even accept records in biro. Everything had to logged carefully with a fountain pen, if quills were not available. The passion for accurate, legible and precise measurement was part of the science culture for all time. To read of people casually lopping off 0.4C is a new world of carelessness abhorrent to real scientists.
20
UAH for Australia over the last 20 years
https://s19.postimg.org/t849zahv7/Australia_20_years.png
Essentially NO WARMING !!!
103
AndyG55 what is the source of your graph? And is this UAH V6 data?
20
http://www.nsstc.uah.edu/data/msu/v6.0/tlt/uahncdc_lt_6.0.txt
12
Neville what is Lomborg’s view of the hiatus?
10
It looks like the start of Beethoven’s Fifth to me. Are you sure that it is not a snapshot from a oscilloscope? 😉
40
With one ‘thumbs down’ vote it looks like someone thinks that’s bad news.
50
It was hard to concentrate on the temperature graph with all the surrounding distractions!
20
Here we go again. BOM, BOM, BOM, BOM ….. Could BOM bashing become a new national passtime? (an maybe give the Pomms a rest).
311
Did you miss the admission from BoM management in 2014/15 that weather and climate change media releases that did not match BoM historic data records was due to errors and omissions? After the Minister responsible asked for an explanation.
Or that more recently BoM claimed that weather stations were faulty when it was pointed out that temperature reporting was being reported slightly higher than actual readings, obviously to create a long term upward trend?
121
Yep. I don’t see a problem in that.
News headline,
“BoM bashing bankrupts a broken bureaucracy”
120
When a failed and , by its own admission , error strewn organisation hides facts to protect itself then the only recourse is to bash it into honesty.
When a failed prophesy has religious adherents (Watt et al) who try to deflect criticism from the ‘prophets of doom’ then you know that forlorn attempts are being made to hide falsehoods, and revelation is not far off.
71
What’s up with that, Watt.
https://wattsupwiththat.com/2017/09/11/ooops-australian-bom-climate-readings-may-be-invalid-due-to-lack-of-calibration/
30
Guess it was asking for that Red Thumb lashing. Well done to everyone who saw it as one in-ten-ded.
20
A one second wafting hot spike,
Gives a false average temperature hike,
Which for sensors is crude,
And with past records skewed,
Are the methods the B.O.M. like.
190
First we were presented with tree ring data which purported to show past temperatures for our Earth.
Maybe it did give some sort of indication, but with obvious issues with absolute values.
Then with the advent of alcohol and mercury in glass, there was an extraordinary jump in accuracy and reproducibility of recordings.
The fall of science began when these two data sets were joined seamlessly by politicians to “prove” that global warming was occurring.
We have here now a similar situation.
The liquid in glass thermometer readings cannot simply be tacked on to tree ring estimates and neither can the electronic instrument data be “tacked on to” the LIG data.
They are NOT equivalent.
It isn’t hard to estimate the response time of a mercury thermometer as being in the order of a minute when measuring air temperature. The response time of the new electronic instruments is probably a fraction of a second.
These data sets MUST be reported as separate assessments of air temperature and any “blending” of such data is clearly unscientific.
My doctor once used an LIG thermometer under the tongue. Remember how long that took to max out. Now he uses an electronic instrument that picks up body temperature through my earhole in a flash. The two readings are only equivalent if the electronic device is properly calibrated.
With the BOMs new devices I can see the possible need for calibration that works on a time weighted average that imitates the LIG response time to variations in air temperature.
The inclusion of obvious outliers in final data presentations is scandalous.
But of course this isn’t science, it’s politics.
KK
162
Every crooked step of the way. The trouble is that no one replaceable will admit to heading in the wrong direction so ‘the system’ grinds on toward self-destruction, the pre-ordained destiny orchestrated by the untouchables.
121
I thought tree rings had been debunked, in having a closer correlation with rainfall than temperature?
91
My apologies to Jo for not having read the whole post.
After reading Graeme’s comment at no 16 it was made clear that my assumption that meteorology did not consider heat transfer time was wrong.
Having gotten to the Maryborough graph which suggested that and obvious outlier was being included in data I went off.
The main point was that splicing data from two very different methods of retrieval would not be accurate nor “scientific”.
KK
120
Tree ring data and the ratio of C13 / C12 has been used to claim that the current atmospheric ratios of C13 / C12 ‘prove’ that a small increase in atmospheric CO2 levels Must be man made (from fossil fuels) rather than natural.
Inconveniently a new study by University of California San Diego led by Scripps Oceanic Institute has found that plants discriminate between the carbon isotopes, preferring one above the other.
What this means is that assessments of past atmospheric C12 / C13 ratios from tree ring samples are wholly unreliable. That means that claims, based on those and current ratios, that man is the dominant source of increased atmospheric CO2 are scientifically meaningless.
It means that no ‘anthropogenic footprint’ can be identified, and any claims that it can are fundamentally flawed.
90
Same applies to C13 / C12 ratios from ice cores.
50
HOw is there bias in an ice core?
51
It is not a Bias in the ice cores – it a flawed understanding of the C13 / C12 ratios found in CO2 trapped in ice cores.
The CO2 trapped in ice core samples is taken to represent the atmospheric ratios of C13 / C12 at the time it was trapped. What has not previously been understood is that plants are selective and C3 plants prefer (select) C13 over C12 thus decreasing the C13 in atmosphere. Ice cores from ice ages are from times when both plant growth and the area of the globe they could grow across was limited and thus less C13 was being removed from atmosphere and the C13 / C12 ratio showed a higher C13 concentration.
The study has concluded that plants preference for C13 distorts current C13 / C12 ratios in atmosphere and that distortion is a reduction in C13. Because that reduced C13 / C12 ratio is very similar to the ratio in fossil fuels that has led to claims that there is an anthropogenic footprint in today’s C13 / C12 ratios because there is Less C13 than in the past.
The current ratio is not a reliable method of ‘finding’ an anthropogenic footprint from fossil fuels.
31
How has this changed over time such that it has caused bias?
02
@ Gee Aye. Is stupidity a requirement for being a warmist alarmist ?
30
@Gee Aye – try reading and understanding what has been already explained. Why is it that you warmists have such difficulty with critical thinking and understanding simple facts ? Is it because facts fly in the face of your religion?
30
It’s good to hear that Roger.
The problem is that they will latch on to any concept no matter how tenuous and try to make it say “man made global warming”.
CO2 is the classic example whereby it was promoted as some sort of special heat trapping gas.
Unfortunately they have been allowed to get away for too long while the basic physics is ignored.
KK
71
We could sell our argument better by illustrating that nature produces 750 gigaton annually and humanity only 29 gigaton.
Its argued that only half of this industrial CO2 is absorbed by carbon sinks, while the other 50% builds up in the atmosphere and warms the planet. This increase in CO2 is remarkable but not significant, unless of course the hiatus goes on for another five years.
41
Another way to highlight CO2 in the atmosphere is to consider a football stadium with 10,000 people packed in. Adding just 2 more people is just like increasing CO2 in the atmosphere by 200 ppm. In terms of the crowd one would say that it is a negligible increase.
Why not the atmosphere?
Regards GeoffW
61
Gordo – couldn’t agree more and the other part of that is that the amount of CO2 produced by man is Less than the uncertainty error bars of the amount of natural CO2 emissions !
51
That is incorrect
03
You’ll have to come up with an alternative proposition, otherwise I’ll assume you are talking through your hat.
20
Gordo I think it goes something like this – is too , is not , is too , is not , is too , is not .
Which is the level of a five year old and not much of a sensible conversation but you have to remember he will have his hands over his ears and be chucking a wobbly at the same time which makes it hard for him to reply .
20
@ Gee Aye – why must you confine yourself to propaganda rather than facts that even the IpPCC accept? Is it because of your warmest religionists beliefs ? If so you have more in common with ISIS than with normal human beings.
30
Roger, the relative plant uptake of chemically identical but slightly heavier C13 (1%) against C12 (99%) is arguable. However as I have written many time, the proportion of C14 (half life 5400 years) is not debatable. As C14 does not exist in fossil fuels, you can absolutely measure the amount of fossil fuel CO2 in the air. Around 1954 when radio carbon dating was invented, it was noted that the amount of fossil fuel CO2 was under 2%. This was the Suess effect (despite the later WIkipedia editing to make out it is C13/C12)
After the aerial atom bomb tests after 1965, we even have the relaxation time for C14 based CO2 as 14 years by actual measurement.
So we know absolutely that the 50% increase in CO2 since 1900 is NOT man made. We know absolutely that CO2 vanished into the huge oceans, half every 14 years. We know CO2 levels are set by ocean temperature and Henry’s law. There is no need to go to ice cores to create conjecture based on plant absorption. However as real factual science is ignored to feed the alarmist fantasy and the Green industrial machine, we may as well examine they hypothesis that increased CO2 increases planet temperature. Also not true.
20
Australian BOM temperature data; one word comes to mind- INCOMPETENCE. And that is being generous!
GeoffW
132
G’day Geoff,
The BoM/Weatherzone have given me a local record. An increase by a full degree centigrade in observed (by me, so ultra reliable) error in the actual v forecast minimum temp at Mudgee airport. That error is now at plus or minus 5 (5.00 to emphasise the position of the decimal point) degrees – yesterday’s forecast = 10C, today’s actual min = 5C.
http://www.weatherzone.com.au/nsw/central-tablelands/mudgee
The link will only show this difference today, and may have already been updated beyond verificaction.
The previous record of plus or minus 4, lasted for several weeks.
Cheers,
Dave B
PS Rather off topic, but I needed to record this discrepancy. D
31
Well, in a peculiar way I hope you’re right G W.
If it’s not incompetence then it’s manipulation. And, to me, it has that smell about it. It’s the smell of infiltration and insurgency by the disciples of Antonio Gramsci. The green/left totalitarians.
Either way the organisation is long over-due for an efficiency and effectiveness audit by the Auditor-General and an independent external body. Perhaps a Royal Commission is going too far at this stage, but then, given the cost to the nation of the policy stupidity that flows from the BoM’s work, perhaps not.
A total re-organisation of staffing, structure and legislative framework is needed. It’s current set-up is not fit for purpose.
10
Its.
11
On this occasion, maybe the BOM is OK. Given the tech of Pt resistance thermometers it certainly would be possible to design one that has the same dynamics as a LIG thermometer. Question is, did they do this right? There is also the question of electronic interference in the A/D conversion. I would still be looking for outliers myself. So IMO the broader question is not the point readings but why are there observed outliers if the dynamics of the thermometers are right. This for example might suggest a poor observation environment. The other question then is if the thermometers are dynamically similar to LIG devices then why sample them so quickly when they can’t respond that fast anyway? Given the BOM here is suggesting they have slow responding devices, there can also be little harm in averaging them. Interestingly, outliers (noise) would indicate faulty hardware in this case. I wonder if the outlier data is used to identify faulty devices?
71
You could be onto something, what if the BOM received a batch of Thermistors instead of Thermometers?, going by their abilities with math spelling won’t any better.
82
What is interesting is how can this play into government policy. It’s clear that AGL won’t play ball in keeping Liddel going and high electricity prices and intermittence is our future. The only solution is to withdraw from Paris and remove the RET. An audit of BOM would give the government an excuse to suspend the RET whilst it happens and when ( as I am sure will be the case) the BOM ‘s methodology has created a warming bias the government has the excuse to back down from its support of a RET. Not only would this save Australia in terms of energy policy it may save this government from certain defeat. It is time that governments decided to set the excuse framework to get out of the Paris agreement rather than totally stuff the Australian economy so that we plunge down the slippery slope of lower personal wealth and diminished economic growth.
151
For years politicians bragged that Australia is one of very few signatories to the Kyoto Agreement that has achieved all greenhouse gas emissions targets established at the conference. It has been achieved by direct action that included policies such as the once off trial incentive to try RET of 2 per cent. But later Labor raised it to 22 per cent which former Coalition Government PM Howard recently said should not have been done. He also expressed concern over the increasing energy crisis.
Now our coal and gas is being exported to provide low cost electricity in other countries, many of them have not achieved Kyoto targets.
This situation highlights the poor quality of our present political class.
100
The only reason Australia achieved it’s Kyoto target was by DCC&E’s fiddling with CO2 numbers, just like BOM’s fiddling with temperatures.
DCC&E had measured quantities of CO2 from energy, transport, industry and the like based on ABS data which showed an increase of around 130 Mtpa.
DCC&E ESTIMATED CO2 savings from land use and forestry at a bit less than the 130 Mtpa required to get below the 8% increase required by Kyoto. Under UN rules estimates were allowed for LU&F calculations.
Using an Excel spreadsheet DCC&E applied factors to changed definitions, not physical changes, IE. forests to national parks, farmland to grassland etc. and guess what – Australia achieved it’s Kyoto target.
I queried DCC&E’s processes on numerous occasions and got the usual over the top bureaucratic responses, just like BOM.
While Tony Abbott canned the DCC&E, many of it’s high priced help just rolled over into other similarly useless Green driven bureaucracies.
13
Referring to the table above for the response time of LIG thermometers from 1912 I point out that it could read in air
Air speed__________Response time
3.6 km/h__________58 seconds
18 km/h___________33 seconds
36 km/h___________25 seconds
What chance is there that the wind speed inside a Stevenson is high enough to give a response time less than 30 seconds?
If the BoM were averaging readings from the electronic meters to try and match LIG readings then 1 minute averaging would be used.
The old saw “If the only tool you have is a hammer, then everything looks like a nail” applies. The BoM is trying to find proof that Australia has been warming and has used the old slow response readings to compare with the fast response modern ones. Any noise giving higher readings will be welcomed as “proof” that there is warming, and their jobs are safe and even better, they are “saving the world”, so any doubts would be suppressed internally and, as best they can, externally. Hence discarding of any contrary readings and acceptance of obviously faulty ones.
There is also a ‘fault line’ between those concerned with forecasting the weather in the next few days (the traditionalists) and those concerned only with generating political pressure. The numbers of the latter group are obviously in control and forcing the evidence to conform to their wishes. Time for a very thorough clean out.
131
Some more on Australian temperatures
https://realclimatescience.com/2017/09/plummeting-temperatures-in-australia/#comments
and comments
20
I’m wondering if there’s much point pursuing the BOM on this. If you look at the Meteorology Act 1955 it is quite clear that their function is broadly about forecasting weather and has no role in analysing climate. So if a bunch of meteorologists want to poison the long-term record by changing instruments with no cross-calibration, that seems to be their prerogative.
What we need to be on the lookout for is anybody who uses the poisoned data.
What the BOM really should be taken to task for is any pronouncements they make on “hottest year ever”. That is obviously not meteorolgy and they have no standing to say such a thing.
And if they ever want to start a BOC, instrumentation should be pretty easy. Simply plant bristlecone pines next to every Stevenson screen — or just one for the whole country might suffice — and take a core every century or so. Then they’ll be able to tell us about “hottest year ever”.
130
*chuckle*
The link between BoM and the MSM needs analysing because propaganda is all about half truths, or mixing truth with lies.
‘Andrew Watkins, manager of extended and long-range forecasts at the Bureau of Meteorology, said the real reason for the warmth was the persistent high pressure seen particularly during early winter.
“But you also have to add to that the long-term warming trend,” he said.
ABC
41
The persistent high pressure is a natural situation every winter. It gives us persistently strong Easterlies in the tropics every winter!
52
Tom the Subtropical Ridge has been travelling too far south in the Austral winter.
The Klimatariat say its because of industrial CO2 molecules, but I beg to differ.
51
I’m a little confused , BOM call the measuring device a ” platinum resistance thermistor ” and then later refer to it as a “platinum resistance thermometer ” , some in the know are calling BS to the former saying they don’t exist .
But the latter apparently generates heat while operating which if true is of concern surely, BOM’s latest statement refuting the claims of Jennifer Morahasy looks like the ramblings of someone with something to hide and little knowledge of the subject at hand .
91
Electronic circuitry using thermistors suffer from `bounce.’ Any change in whatever the circuit is doing causes thermal feedback as well as electrical. It doesn’t matter how the thermistor is being used: as a direct sensor for measuring temperature or for thermal stabilisation such as amplitude stabilisation of an oscillater, it suffers from several seconds of instablility after any change or adjustment while the thermistor reaches a new thermal equilibrium. Several seconds.
I usually modified such designs to render the thermistor unnecessary, they were far too sensitive.; photo-electrical feedback was much better.
If the BOM is using thermistor based devices then any eddy in the air is a disturbance which will cause measurable instability. Even a ten second averaging interval is too-short a time. The US `standard’ of 5 minutes is more like it. One company I worked for used silicon transistors as CCD’s (Constant Current Devices) as the temperature sensing element for data-loggers it made. Temperature change created a small current change. These were vastly better behaved than any thermistor, very stable and surprisingly linear.
80
I’ve never used a platinum Resistance Temperature Detector (RTD) in my career. It’s time, maybe, that I did. So I’ve done a bit of research into them to fill myself in on them. They’re quite affordable with a typical price of c. USD95.00 and up depending on your application and requirements. They are NOT thermistors except in the broadest of terms.
There are basically four types of industrial temperature probes which suit electronic measurement:
0. A silicon transistor: as a constant current device. It has limited range but is reasonably linear but not over the whole range. It’s not bad for accuracy. It tends to drift quite strongly without compensation, so it’s not a suitable sensor for applications where better accuracy is required.
1. Thermistor: (from Thermal Resistor) are resistive devices made out of metal oxides usually formed into a bead and encapsulated in epoxy or in a glass envelope. Thermistors generally have a negative temperature coefficient which means the resistance decreases as temperature increases. They are very sensitive, and are typically non-linear with a limited temperature range.
Thermistor temperature-sensing probes are considerably less expensive than those using RTD elements. High resistance equates to high sensitivity with a thermistor providing a larger voltage drop over a specific temperature using the same measuring current. Self heating is more problematic with a thermistor because of its small size. This gives rise to “bounce” with a step change and a longish settling time. Thermistors are best suited for low cost applications over limited temperature ranges. Can be used to thermally stabilise a transistor CCC probe’s drift, but life gets quite complicated here with calibration.
3. Thermocouple: is made of two dissimilar metals welded together. The reference junction is typically part of the instrumentation and the opposite junction is known as the sensing junction. When the sensing junction is heated, the opposing metals create a known thermoelectric effect proportional to the temperature difference (ΔT) between the two junctions. By compensating for the known temperature of the reference junction, the temperature at the sensing junction can be determined. Different types provide differing thermoelectric effects for differing temperatures and environments.
Extremely high temperature range Thermocouples can be rated as high as 1700&Deg;C. Their simplicity enables them to withstand extreme shock and vibration. Small size/fast response Thermocouples with exposed or grounded junctions offer nearly immediate response to temperature changes. Thermocouples are best suited to high temperatures and extreme environments.
4. Resistance Thermal Detectors: usually made from platinum. Can be wire wound around a ceramic or glass core or cemented to a ceramic substrate. The unit is usually encapsulated in various materials depending on application. Air temperature sensing devices are not encapsulated (open) or only lightly so (encapsulation determines response time for ΔT). Platinum RTDs have a positive temperature coefficient with resistance increasing linearly for increase of temperature. Measurement range can be -200°C to 600°C. This is probably the most commonly used sensor.
Each type of temperature sensor is best suited for a particular range of temperatures.
The Platinum RTDs have some significant advantages:
• A wide temperature range (approximately -200 to 650°C + )
• Good accuracy over the wide range (better than thermocouples)
• Good interchangeability (highly standardised)
• Excellent long-term stability (well, platinum is a “noble” metal …)
• Simple calibration
RTDs can be used in all but the highest-temperature industrial processes and can be made from materials including, but not limited to, Copper, Nickel and Platinum. They all measure temperature through a change in electrical resistance of a length of wire per change of temperature. Platinum (Pt) is by far the most common material used for RTDs. Pt RTDs are very stable, as they are not affected by corrosion nor oxidation. Copper has high temperature limitations: it has a tendency to melt, and metals other than platinum are not as stable nor as repeatable.
Pt RTDs are highly standardised and are available in a range of accuracies. S EN 60751 (British Standard), and European DIN/IEC751, which control tolerances and accuracy. There’s a nice table here.
There are RTDs available for almost any application requiring accurate and consistent temperature measurement.
I haven’t found much about thermal response times, the best I could discover being from 2 seconds to 65 seconds. That would depend on the probe encapsulation material and amount. Everything else waxes voluminously about stability and linearity. Calibration is easy: use a jar of slushy ice (not too much water, the ice shouldn’t be floating!) to set the 0° point. The probe’s resistance will be 100Ω at this point.
Some temperature measurement guidelines for those who would like to make their own thermometers using an RTD. If the BOM’s readings are so poor, they must be applying these devices incorrectly or doing something badly wrong.
Hope this is informative for everyone.
20
Yeah, I know, USD 95.00 for a thermometer. Well, it’s not gold plated, it’s platinum :-).
The very best.
20
This is when the rot set in.
http://www.bom.gov.au/water/news/article.php?id=63
21
The BOM will not release its data or the algorithms that they process it with as they know that it would alert the Public and Sceptical Scientists to the magnitude of the [snip] that they are perpetrating in the name of CAGW theory and Global Warming Alarmism. The BOM knows that what they are doing is scientifically illegitimate and a misuse of taxpayers’ money.
42
I’ve just been monitoring the early morning temperatures online, in my home town. The BOM weather station is near a cluster of buildings, a no through road and a car park. Some vehicles start to arrive at the car park in the early am.
This morning I observed the following: O550 hrs 2.9C 0555 3.1C 0600 2.6C 0612 2.8C 0630 2.7C. wouldn’t guarantee that my clock is in sync with the BOM’s clock.
A 0.5C fall in approx 5 minutes following a 0.2 rise in approx 5 minutes. I wish I had started monitoring a bit earlier. I wonder how much effect arriving vehicles had on the measurements, or temperature pulse from UHI and wind swirls.
72
A bit of car exhaust passing near the BOM recording device could easily affect the daily minimum temperature which typically occurs about 5:30 – 6am.
Can you advise where your BOM weather station is?
21
We moved to town and ADSL in late 2009. i use eldersweather’s site, which I believe comes from the BOM. The local airport station was established about 1991. Now, from memory:
The 24 hr report developed from erratic half hour reporting plus “spikes”, (of temp, wind, rain) and now ten minute reporting. Along the way we saw Ken Stewart publish an analysis, a sound analysis, which brought BOM activities to notice.
I am pretty sure that it was after that that we started seeing strange reports, including multiple reports on the hour which were not always the same. The cynic in me wondered if this was to make it very difficult for freelancers like Ken to make an analysis of the figures. Perhaps a decoding algorithm was needed.
Lately we have a well organised report based on ten minute reporting, but it is noticeable that the reported maxima and minima often do not appear in the ten minute reports, outside by a significant margin. It seems to me that the one second rule explains that.
102
Statistics are worse than meaningless unless they are in the hands of informed, conservative and skeptical humans endowed with common sense. Eg: A “record” hot day for August achieved on August 31 or a “record” cool day for August achieved on August 1. If you don’t immediately question the cause and hang-time of the high or low temp and if you don’t immediately notice the difference/distortion between a mid-August reading and an end of August reading and if you don’t wonder immediately about differences in measurement, UHI etc, then you may be highly qualified…but you are not educated.
That’s all statistics all the time. Statistics are born in the tenth ditch of the eighth circle of hell, and only goodly humans with common sense can save ’em.
72
Three times in my life I have seen snow falling, one of those times with dry hail. All were in October.
40
This great post explains to me why sudden jumps in temperature at our Broome airport are often seen at the same time of a landing or take-off by jet aircraft during regular easterly winds. I had called this “airport heat island” records.
92
Thanks Tom,
Looks like jet exhaust causing local transient temperatures.
Could you take a photo of the BOM temperature recording site and attach it to you blog. Also send to Jennifer Marohasy.
The BOM does publish the LAt/Long of its recording sites but not to the accuracy to actually identify the sites on Google Earth
41
Hi PeterC, this post has pics of the jet blast warning sign in front of the BoM offices alongside new helicopter hangers!
11
Here is another post showing the proximity of high king tides to the airport and the relation of hangers to BoM offices.
21
This argument needs a visual equivalent. I give two, first one, compare a digital tacho to an analogue tacho. Regardless how lumpy an idle the analogue tach will be readable. The digital tach will jump.around so much you would be lucky to guess the nearest thousand. The second, a fuel gauge with no filter balance. The instantaneous readings of the fuel sloshing around would drive one crazy attempting to read it.
One second readings? Really? Someone worked out the waft of truck or even aircraft exhaust has a higher temp delta and needs capturing. As opposed to cutting out low end temps as an “error”
30
Surely in this day and age of digital photography, memory storage and image processing they could go back to mercury thermometers with a digital camera on a timer to capture the mercury reading and convert this to a temperature value for recording.
50
I do not understand why the platinum resistance probe is not cased in a material which gives it the same thermal response time as the old LIG thermometers that were replaced.
Surely that would have been easy to achieve and ought to have formed part of the calibration process.
Why use a software algorithm when the probe could have been specifically designed fit for purpose. After all there are plenty of these probes in service and state institutions are not short of money. The state meteorological societies should have insisted on a specified design specification that would have accurately mimicked the behavoir of the various different LIG thermometers (mercury, alcohol whatever).
This is just poor quality control.
Finally, this issue is more significant due to poor siting. Say an AWS station is sited near to tarmac, or in an airport, slight swirling wind can bring puffs of warm air, heated by coming over the tarmac, or by a passing jet plane. One does not get the equivalent cold puffs, so fast response time inevitably biases warm when a station is poorly cited.
81
G’day Richard,
Thanks for that. How close is too close to a runway? And how far away from nearest runway would be safe? My guess is the answer would be dependent on expected maximum temp, and wind speed??
I’ve noticed (but not recorded, or previously commented on) some funny temperatures reported at Mudgee airport, and thought they might be engine exhaust effects, but hadn’t considered runways. The main funny was an increase in temp after sunset on what I,d have said was a normal day which had already started to cool.
Cheers,
Dave B
40
I’ve done a bit of research into Pt temperature probes. The problems commenters are mentioning, are starting to look like, at least to me, poor maintenance of the field equipment. The “noisy” readings look like corrosion, possibly, of connectors and connections.
30
These devices were, if Jo’s facts are correct, and I’ve no reason to doubt them, installed in the second half of the 1990s. I’ve not seen the insides of any of the Stevenson screens to be able to comment on their internals, so this comment is purely hypothetical, based on personal experience of other modern electronic equipment.
The information I’ve found about the platinum thermal detectors indicate that most, if not all, of the BOM weather station thermometers which now use the RTDs, are electronic, with maybe an analogue to digital converter and telecommunications equipment all built in to permit remote monitoring and reading. In other words, they are `data loggers.’ That presupposes printed circuit boards (or ‘cards’). Now RTDs are very reliable sensors, but that doesn’t mean to say that the electronics driving and reading them are reliable, and that’s where, I’m beginning to wonder, the problems may be coming from.
It was sometime in the middle 1990s that there was a global determination to `get lead out of the environment.’ So-called E-Waste (electronic printed circuit boards) were being tipped in ever increasing quantities and the solder contained a lot of lead. Solder is an alloy of Lead, (Pb) and Tin (Sn) in the ratio of 60 parts Pb to 40 parts Sn. This drive to kill off Lead meant a change in solder from the highly reliable 60:40 to the `new’ not so reliable solder of 40:60. It’s significantly less reliable, so I carefully hoarded two large reels of 18g 60:40 rosin-cored solder back about then.
I’m glad I did. My clothes dryer began to play up about 2006, when it was about ten years old. I took its circuit board out and resoldered it. It’s still in use, problem free. The problem: a `dry’ solder joint or two.
I bought a replacement car the following year, a 1997 Nissan Leopard, 3L. Two years later, the speedometer stopped working. I took the instruments out and re-soldered the speedometer’s daughter-board. Yes, the instruments were all electronic. While I had it apart, I did the tachometer pcb as well. I sold the vehicle last month. The instruments have worked without a single hiccup since my `intervention.’ More dry joints.
Three years ago, I did the same to a well-known brand of microwave oven, when it stopped functioning after only fifteen months of mild service. Yes, fifteen months! That came back to life again. More dry solder joints. Unfortunately, the Universe’s Laws of Entropy had it in for me and it let all its smoke out the following year. That was exciting: a big flash with a loud bang followed by a significant cloud of smoke, and total silence. That necessitated a replacement. I haven’t gone through the replacement yet. I will.
I have a 24″ flat screen colour television which didn’t make its warranty (12 months) sitting on one corner of my work bench awaiting similar treatment. I hardly watch TV so it’s not urgent. It’s been there for a couple of years.
From what I’ve learnt about RTD’s as thermometer sensing units, they are very reliable units. But what about the rest of the electronics they are
connected to? Circuit board edge connectors have their own gremlins, as do wiring plugs and sockets.
I assemble my own computers from readily available standard modules, and have a small network of four PCs and one laptop. I run Linux on all of them except the OpenBSD one. When Linux or OpenBSD fails, it’s almost always a hardware problem. Last year, the one I’m currently using, began to misbehave. Well, it was eight years old. I took the memory DIMMs out and looked them over then cleaned their edge connectors. To do this safely you need an anti-static mat and an anti-static wrist band which are connected to the house earth through the house wiring. The human body can routinely carry a static electric charge of about 200V. It’s too low for us to feel, but it can be fatal for circuitry which uses only 3V, such as computer memory chips. So I use and wear anti-static equipment rigorously. The memory DIMM edge connectors are gold plated and they do tarnish slightly. I clean them, after setting up my anti-static protection, by polishing them gently with a soft pencil-eraser, then flushing them with an aerosol can of switch contact cleaner (CRC CO Cleaner). I spray their sockets too, and insert and remove them—gently—a couple of times while the socket is still wet. I got a reliable year out of the machine before it suddenly started to play up again. This time it was a dead memory DIMM. I replaced it but memory under MemTest remained unreliable which implied the CPU, which contained the Memory Controller, may have sustained a little damage. That machine has now had a complete upgrade and is once again fully reliable.
I have an elderly motorcycle, made in Germany, which uses a lot of electronics. It was manufactured in 1985, and I’ve owned it since 2007. I’ve had to work through its whole electrical system with a couple of tins of contact cleaner and a jeweller’s screwdriver at least once. I’ve had to strip and clean tarnish out of the ignition switch, which uses silver plated contacts, three times. (I keep two ignition switch modules, now. As soon as the symptoms appear, I swap the spare in, take the `faulty’ one apart, clean it and use fresh silicone grease (electronic `barrier cream’ 🙂 ) on the contacts and put it on the shelf until its turn comes around again.)
My computers are in a warm and dry environment. My motorcycle is used in all weathers, and in all seasons. What about the devices in the Stevenson Screens? They’re subject to the whole range of daily temperature change, not to mention seasonal changes, and relative humidity changes. Their environment is not as benign as that of my household appliances and personal computers. Their environment is probably even more hostile than that my motorcycle experiences. Yet I have had significant contact and pcb faults (mostly intermittencies) across all those items in that time, all requiring significant maintenance effort on my part.
I don’t think the BOM’s equipment, even if it is built to be bullet-proof and is armored against everything the elements can throw against it, as it should be, could survive without regular maintenance, some of which I have outlined. I have a preventative maintenance schedule for my motorcycle and I don’t wait for problems to appear before enacting that schedule. Some still do, but that’s machinery for you.
The BOM’s `noisy’ temperatures, to my mind, `smell’ of needed maintenance/repair. Does BOM maintain it’s thermometers or do they have to die first?
Okay, I haven’t been involved with the equipment or the controversy in any way; I’ve been watching it from the grand isolation of the (wet and shaky) eastern isles. But I admit to some puzzlement at the BOM’s attitude. I may be wrong but it seems to be one of:
Hey, this is my sinecure, not your’s. Now butt out and stay out! I’ve got too many homogenisations to do.
If the `anomalous’ thermometer had been my thermometer, I would have taken the anomaly and the communication about that anomaly as a heads-up, and thanked , yes, thanked the individual(s) who drew it to my attention for drawing it to my attention. Hey, someone’s interested;. let’s encourage that. The software would have immediately been looked into: a big Bug report stamped URGENT sent to the software engineers, the hardware checked thoroughly and fully replaced if necessary. All this and the results and my findings would have been communicated to the informants publicly and openly.
But, no, that’s not what’s happening. There’s no short latte on tap at the site and the office arm-chair is neither motorised nor `climate controlled.’ Go away, you pests.
20
BoM, Met Office, NOAA. who runs them?
how come politicians everywhere, and of all stripes, refuse to investigate their data sets?
there are plenty of hints as to why this is on their Wikipedia pages, as incomplete as the information might be.
this interview is worth reading IN FULL.
it was written by Olivier Vergnault for the Western Morning News in 2014 but is only available at this website.
(from a brief comment on a BishopHill “Unthreaded” thread from Aug 2014, I did find out it was originally headlined “New UK weather boss is very much a man for all seasons”, tho the link provided didn’t work):
12 Aug, 2014: Chartered Director/CDir.org.uk: After 31 years with the Met Office, Chartered Director Rob Varley is to be the new CEO
By Olivier Vergnault, Western Morning News
Q: How did you come to work for the Met Office?
Varley: My father was a weather forecaster. He joined the Met Office in 1950 and worked as a weather forecaster for 34 years. I grew up with the Met Office and my dad was obsessed with weather. It must have rubbed off on me. I studied meteorology at the University of East Anglia then joined the firm in 1983. My dad retired a year later…
Q: What does the Met Office do?
Varley: Most people will be familiar with our Public Weather Service, providing forecasts and warnings via TV, radio, web and mobile. But as well as this we provide weather and climate services to a huge range of customers in the public and private sectors and to international clients. This includes two-thirds of the world’s long-haul aviation and the UK military wherever they are serving – we have had staff in Afghanistan since 2001.
Q: How does the Met Office make money?
Varley: We are a Trading Fund Agency within the Department of Business, Innovation and Skills. Eighty-five per cent of our revenue come from the public sector through trading agreements with various organisations such as Defra, the MoD, the Environment Agency, the Civil Aviation Authority, the Department of Energy and Climate Change. The other 15 per cent is from commercial contracts.
Q: What is the Met Office’s turnover?
Varley: Last year it was £208 million…
Q: Five years ago we were promised a full summer of barbecue weather. What went wrong?
Varley: Predicting conditions several months ahead is one of our big scientific challenges. ***It’s just not possible to forecast that far ahead with any certainty. All we can do is hint at how the odds are stacked, and in 2009 the summer didn’t follow the most likely pattern. Despite their limitations, our three-month outlooks can be useful for business planning, but we now recommend that the public wait until a week or two ahead before to get a useful forecast…
Q: Can you predict the impacts of global warming?
Varley: ***On a world scale the science of global warming is clear and unequivocal. But our understanding of the local scale impacts is still developing and there is much more to do. That’s a key reason why the Government is investing in more computing power…
Q: How closely do you work with other Met Offices in the world?
Varley: Very closely. Meteorology is a very effective international collaboration. We are all dependent on the weather and on each other’s data.
***The Met Office belongs to the World Meteorological Organisation, an agency of the United Nations…
http://www.cdir.org.uk/chartered-director-rob-varley-new-met-office-ceo/
60
“how come politicians everywhere, and of all stripes, refuse to investigate their data sets?”
Simple – as I mentioned in a previous post, there are certain Establishment memes and Social Engineering agendas that must be maintained at all times.
The pollies are just sock puppets, they will do as they are told.
The only way you could force them to investigate is to create such a damaging electoral stink they will do it to protect their own political hides.
60
Some memes that are “sacred cows” :
Meme – Speed Lills
solution – install speed cameras, benefit – surveillance and revenue
Meme – Climate Change
Solution – implement Agenda 21, benefit – dismantle australias economy, destroy australias middle calls ( aka implementing Communism )
Meme – Cholesterol
Solution – demonize animal fat consumption, benefit – forcing people slowly to vegetarian diet, implement Agenda 21
Meme – Central Banking
Solution – central control of all money, benefit – being able to crash a country on cue.
There are many others, but you get the general idea….
60
And here was I thinking the pollies do the hiring and firing! Starting at the CSIRO in December 1986.
30
No. They just put their puppets in place and they do it for them.
Neville. Wran. CSIRO. Chairman = End of integrity.
The cultural hegemony of Gramsci at work.
20
Here’s how I like to check things out. The highest official daily temp for Australia and for the southern hemisphere is that famous 50.7 at Oodnadatta on Jan 2 1960. That single number might mean a lot to some people, but not to me.
Being no genius in any area, I am nonetheless capable of checking out the context of that single reading, something a lot of very bright people would not consider as important as the bare highest-evah statistic but which is all-important to me. What I find confirms that the 50.7 was indeed a very significant weather event. On the last day of 1959 there was a reading of 47.1, very hot for anywhere. On New Year’s Day a phenomenally hot 49.2. Next day is our record: 50.7. Day after comes a reading nobody mentions: a near record of 50.3. Thereafter temps are only in the 30s and low 40s.
So it was a long event, not a moment, and the thermometer wasn’t stuck on high. Next I ask how widespread the event might have been, to allay suspicion of localised distortion of any sort. I check Adelaide and it’s just normally hot over those four days. Same with Mount Isa.
However, I then check Finke River PO up in the Territory, 234.4 k away from Oodnadatta, the closest inland reading I can find. Finke River had a four day scorcher including its highest daily reading in its shortish record (1938-80 with daily readings available post 1957), achieved on two consecutive days, and what was probably its second-highest, achieved on day four.
So 50.7 at Oodnadatta was part of an extreme event experienced over a fairly wide area over several days. Now I’m satisfied. My statistics are back in their cages and behaving because a human adult has been in charge.
Adults like context. In fact, they insist.
90
Insist on context… Wage,
wage war against the
lying and the fright.
Context’s the thing whereby
we may unearth the problem
situation of the king
(and troops,) or reliability
of temp-measurement stats.
40
Off topic, a new paper which may be of interest : https://www.nature.com/articles/s41467-017-00577-6 Rapid global ocean-atmosphere response to Southern Ocean freshening during the last glacial
Stuff news article – https://www.stuff.co.nz/national/96781940/swamp-kauri-reveals-ancient-antarctic-meltings-link-to-rising-temperatures
Turney said Greenland ice cores showed there had been 25 major D-O events during the past 90,000 years. The abrupt, massive, millennial-scale swings in temperature across the North Atlantic region happened too quickly to have been caused by Earth’s slowly changing orbit around the Sun.
“The scale of these swings is staggering: in some cases temperatures rose by 16C in just a few decades or even years,” Turney said.
So does that mean the changes in recent times are not really unprecedented at all and the panic can be called off?
50
Request for Tony From Oz:
Can you please provide references to show that power stations dont necessarily have a “Use By” date, but rather can keep recieving maintenance to keep it running?
The “use by date” meme is persistent, so it would be good have soemthing to counter that.
Thanks.
60
There’s not really a “hard” use-by date, it’s more like your car – the older it gets, the more likely it is to require expensive repairs. You can “keep going” as long as you are prepared to pay the associated costs in doing so. In most cases, there is a point where it is cheaper to throw it away and buy a new one.
The only “real” hard limit that I am aware of would be the structure itself – the 50Hz “hum” eventually damages the reinforced concrete structure enough that will become unstable. At that point, complete replacement definately makes sense – if you need to remove boilers, turbines and generators (plus coal crushers, heat exchangers, particle precipitators etc etc) to replace the structure, why not replace the bloody lot with new?
50
I may not have any references for you, but I do have a considered opinion.
I actually think that there might be a turn around in thinking on coal fired power, and those who don’t get on board now will be seriously damaged when the facts come out about coal fired power.
Back in 2007, before Bayswater and Liddell were sold off to AGL, they were owned by Macquarie Generation a corporation wholly owned by the NSW State Government. There was detailed planning to upgrade Bayswater by adding 2000MW USC plant which would have run alongside the existing plant, and the thinking here was that Liddell was getting long in the tooth, and when it closed down, then the new USC would effectively totally replace the 2000MW (when new) as Liddell rolled to a stop.
That USC plan went by the wayside, and AGL purchased both plants, and I would suggest, were not willing to proceed with the new plan.
However, it is actually still current, and if revived, would knock considerable time off the time between thought bubble and power delivery, perhaps two or three of the seven years.
If thinking turns around, and that would need to happen withing one perhaps two years, and that Bayswater Upgrade was to go ahead, then Liddell may only need to be extended by perhaps a year maybe two.
Okay, so to the ‘Use By’ date you mentioned, that time constraint is mostly dependent upon the furnace/boiler part of the whole generation system, and that was the major problem with the Hazelwood plant as well.
Now, you can spend tens of millions, perhaps more, hundreds, to upgrade those boilers, but the time it would extend the plant would probably (and note I only use the word probably here) not be enough to recover the cost of that boiler upgrade, considering everything else in that whole generation process is also aging as well, and keep in mind that while Liddell was 4 X 500MW when new, it only manages around 450MW per Unit now, and they are more prone to not running at maximum as they once did. Those boilers are a major safety problem, so it’s not just electrical maintenance, and are totally restricted to that time factor, just as they were at Hazelwood. (which will not re-open)
So, there’s the problem, and a private owner will not spend that sort of money on an upgrade of that nature, but, if opinion changes, they might be tempted to go that USC route at Bayswater.
That 50 years age thing, your ‘use by’ date is pretty much nominal, as there are some in the US as old as 70 years and even more. It all depends on how much money you want to throw at it, considering that they not only generate power, but lots and lots of money as well, considering this, that Bayswater, generating 17TWH a year sees an income approaching $1.1 Billion in the sale of that power. AGL also owns the coal mine with huge reserves, so they are using their own coal. The proposed Upgrade would be at this brown field site, so the main infrastructure is all in place already.
The same also applies for the Mt. Piper plant near Lithgow, now owned by Energy Australia, and that similar Upgrade, also planned in 2007 was further approved in 2010, and is still current, and that’s for a further 2000MW.
The recent Upgrade at Stanwell Unit 3 was done by the State Government owned Corporation, and that WILL see the full recovery of that cost, as they got in and did it earlier than Liddell and Hazelwood. Incidentally, after 12 weeks offline, that Unit 3 ran up late last week, stayed at around 160MW for a few days, testing I suppose, rolled up to 250MW for a day or so, and is now at its full output of 385MW, for the last four hours.
50 years is probably the right time for these types of plant, and seriously, new coal fired plants should have been thought bubbled ten years ago, just as this CO2 meme began. If Bayswater and Mt. Piper had have actually started even two years earlier, they would be up and running now, and this fiasco we now have would have never got this far.
Tony.
Link to Bayswater Upgrade
Link to Mt. Piper Upgrade
80
Tony you might not have seen this post at Catallaxy Files by Rafe Champion.
The cost, supply and use of power across the states. Check out the Coal Tracker especially Units Planned and Under Construction. China 583, India 217, Indonesia 145, Turkey 71, Vietnam 84, Japan 43, Australia 0. To a total exceeding 1500.
The green future. Doing the arithmetic on the production of batteries to back up unreliable energy sources. Endorsed in principle by Bill Gates who is putting money into research towards the next generation of power sources (whatever that might turn out to be).
THE links to these items are in the link below.
http://catallaxyfiles.com/2017/09/09/roundup-8-sept/
40
Thanks New Chum
Look, I know that this is horrendously off topic, but people will see that new coal fired power in such numbers and not even understand it. For example, note also the new article at the ABC. (at this link)
Ho hum, the main image shows the plant they refer to as Liddell, and such a pity that it’s the nearby Bayswater plant, and that’s two articles they have done that at now.
However, scroll all the way to the bottom of the article and note where it says this.
That’s what you get when a journalist writes an article without any knowledge of power generation, and just believes verbatim what a talking head with an agenda tells him/her. Everyone with an Electrical qualification is laughing their heads off when reading that wonderful little snippet.
Tasmania has 2261MW of Hydro, so, with an 18000MW Base Load, that’s around 8% of that Base Load, or if they run them flat out, it could cover the Base Load for around 47 minutes, theoretically speaking, because they couldn’t supply the power fast enough, and hey, that would be some pretty huge Interconnector, and Tassie Hydro supplying into Victoria maybe, but not anywhere else. The current Interconnector has a capacity of 340/490MW
Sometimes I really despair, but mostly I just sit here and laugh. It’s no good leaving comments anywhere explaining it, (other than here) because frankly, they just don’t want to know, let alone to try and actually understand it.
18000MW of Base Load means nothing to them, because they all know, hand on heart, that baseload has been discounted, to mean nothing other than a redundant adjective, and the battery to cover all of their consumption is just around the corner now, and will cost slightly less than a four pack of AA Eveready’s.
Tony.
60
Thanks Tony.
30
The fish in bass straight will complain from the warm waters as the cables flame out from overload
The Burnt Cable Award just keeps on giving….
30
Original Steve one problem with prolonging power plant life would be monitoring or replacing metal components (boilers) due to metal fatigue or creep fatigue from the constant heat cycles faced by these alloys, working in a plant partially shut down would raise the exposure to danger compared to a complete shutdown and retrofit of a new system, but cost vs return would be the overall decider.
40
That makes sense…..
Could you keep replacing boilers or would it become eventually too expensive?
Last time I was in a power statiion was in Williamstown, but I think that was gas fired and probably used direct fired turbines.
20
The BoM on their failed 2017 cyclone prediction:
“Being perfectly honest, climate change is a factor in most of our climate science these days but in terms of tropical cyclones you couldn’t put this season down to climate change,” said Dr Andrew Watkins the manager of climate prediction services at the bureau.
“There are several theories and at the moment the data is pouring in from satellites and everywhere,” he said.
http://www.news.com.au/technology/environment/climate-change/cyclone-blanche-is-latest-to-cross-land-in-second-consecutive-quiet-season-in-australian-history/news-story/220bd07cbd24d1db32cfd2175d3ec2ac
. . .
If the ‘climate change’ the BoM factors in to its failed computer climate models is the false temperature readings exposed here, that might be a clue for the BoM for ‘one of seven’ theories.
52
I haven’t read all the comments so this may already have been mentioned here. I have seen something along these lines in a comment on a previous post.
In the days before electronic measurement, I am quite sure that the people monitoringthe thermometers were not taking readings every second, minute or even every hour. There may have been a schedule, there may have been no discipline in it at all for some people. At least part of the “trend” could be explained by this
42
There is always the possibility of human error, but for the most part the people on the ground would have acted responsibly.
We have to accept that the trend is real, there has been no global warming for a couple of decades.
BoM has come up with WOW so that we can all delight in our favourite hobby.
http://www.bom.gov.au/wow-support/
40
No human error in CAGW it’s all fudged on purpose not accidentally
10
I’m not suggesting error or malpractice, just that it would be physically impossible for a person to monitor the thermometers around the clock like we do these days. The chances of someone being there for the absolute high and low each day are fairly slim
00
OT – Realism by our Chief Scientist!!!!!!
I’m amazed by the statements and recommendations attributed to Alan Finkel in this Power Engineering International article – they are all well reasoned, practical and solidly grounded in facts.
Why weren’t these in the report issued by his committee at tax payer expense?
60
…. not in the brief from the Office of Prime Minister & Cabinet maybe?
50
It is surely a no-brainer that the public interest requires /accurate/ records and forecasting.
90
Some politicians would argue that not mentioning alarming statistics, or worrisome political mistakes were in the public interest.
30
From the paper, λ is how many seconds to go from thermometer reading 1 degree less to 0.4 degrees less than the outside temperature. On a still day (or in a screen) that is 190 s. To get within 0.1 of the outside temp requires about 9 minutes.
30
No problem, thank you.
20
NO, thank you!
10
13 Sept: Crikey: Crikey Worm: Coalition abandons clean energy target, media reform deal close
The government doesn’t see the need for a clean energy target, and a media reform deal is so close we can smell it. It’s the news you need to know, by Max Chalmers.
TURBULL TAKES FINKEL TARGET OFF HIS BACK
The Coalition government will walk away from the clean energy target outlined by Chief Scientist Alan Finkel. According to the Australian Financial Review, the government will instead deliver a plan (LINK) that relies heavily on coal-fired power and a slower transition to renewables. The Fairfax papers also report (LINK) the government is considering shifting the emissions baseline from 0.6 to 0.7 tonnes of carbon per megawatt hour, allowing high-efficiency coal plants to gain credits.
A group of backbench MPs including Tony Abbott is pushing against any clean energy target (LINK), with Abbott telling the party room a CET on top of the existing 23.5% renewable energy target would be “a difficult position to sustain”.
After the Liddell power plant fracas a new plant could be headed for the spotlight with The Australian splashing the case of the Mount Piper (LINK) power plant today. The plant uses coal from the Springvale mine, which has had its operation extension blocked in court by green group 4nature over fears it will contaminate local water supply.
As a political storm rages around him(sic), Australian Energy Market Operator chief executive Audrey Zibelman seems to be keeping his(sic) cool, saying yesterday the operator has a plan for the grid with or without Liddell…
MEDIA REFORM DEAL CLOSE
Depending on who you believe, the government and Nick Xenophon are either very close to or already agreed on a deal that would alter Australia’s media ownership laws. Xenophon’s team has been haggling with Communications Minister Mitch Fifield, and the Australian Financial Review reports the South Australian senator is looking to secure funding for 200 cadet journalist positions in return for supporting deregulation. Other money will go to regional papers and towards innovation at an estimated cost of $20 million to $30 million a year.
A sticking point is whether foreign media outlets like The Guardian and The New York Times will get a cut, with The Australian indicating they will be excluded from the new funds. The support would instead flow to local outfits like The Saturday Paper and Crikey…
https://www.crikey.com.au/2017/09/13/coalition-abandons-clean-energy-target-media-reform-deal-close/
excerpts found elsewhere, as it’s behind a paywall:
13 Sept: Australian: Mount Piper power plant closure feared after court ruling
The potential closure would take up to 1400 megawatts out of the energy market, or the equivalent of 15 per cent of electricity supply to the NSW system.
The Australian has confirmed with EnergyAustralia executives that the prospect of a forced shutdown of the Mount Piper power station in central-western NSW, which has an operational life to 2042, was a “real risk” following legal action launched by green activist group 4nature against planning consent for an extension of the Springvale mine owned by Centennial Coal.
The uncertainty is believed already to be having an impact on power prices…
Energy Australia chairman Graham Bradley told The Australian that the company was now in a “diabolical” position which if unresolved could affect supply to more than one million customers in NSW. “It is an appalling situation,” Mr Bradley said. “It’s the newest clean-coal station in NSW and perhaps the whole nation. It would be a tragedy for it to be out of operation for want of coal supply.
“There are around one million residential customers relying on Mount Piper output to provide them with power … if we were to shut we do not have the back-up.
“We are in a diabolically compromised commercial position; unexpectedly so.”…READ ON
http://www.theaustralian.com.au/news/nation/mount-piper-power-plant-closure-feared-after-court-ruling/news-story/7f8355b1dc09f0c824e6869ef14a43a9
20
2 Aug: Lithgow Mercury: Springvale Mine approval ruled unlawful
by Phoebe Moloney
In September last year the court ruled against the environmental group.
However, in the Court of Appeal on Wednesday, August 2, three judges agreed unanimously that the approval was unlawful…
“The court ruled that the September 2015 approval of the Springvale coal mine was invalid,” 4nature spokesperson Andrew Cox said.
“4nature wants to find a reasonable resolution to the ruling. We are willing to sit down with the government to find a way that honours the intent of the judgment while addressing immediate safety and job concerns.”…
LinkedIn: Andrew Cox, CEO at the Invasive Species Council
Environmental Justice Australia, Vice Chairperson
Starting October 2013
President, 4nature
November 2010 – Present
https://au.linkedin.com/in/coxandrew
Facebook: 4nature.org
https://www.facebook.com/4nature.org/
this morning Alan Jones/2GB said the environmental group is not to blame, & said he had written to the Govt multiple times, objecting to an expansion of the mine.
Jones constantly says he’s pro-coal, but he has a funny way of showing it.
30
FakeNewsMSM got its scary headlines, that’s all that matters:
12 Sept: WaPo: Why the storm surge forecast for Irma wasn’t so bad, just incomplete
By Jason Samenow
The scariest part of the forecast for Irma was a prediction that seas would rise 10 to 15 feet above normally dry land in the Keys and Southwest Florida. The National Hurricane Center said the resulting inundation of homes and businesses would be “catastrophic.”…
Did the National Hurricane Center overstate the threat?
No, according to the Hurricane Center’s Jamie Rhome, who leads the storm surge unit. He said the big surge came as expected, just not where a lot of people live.
“All indications are that a 10-plus-foot surge did occur from Marco Island eastward and around Everglades City,” he said.
Data from this region is not yet available to confirm Rhome’s assertion…
The question then arises as to whether the Hurricane Center and media effectively communicated that it might not be so bad everywhere.
Rhome contended that these forecasts shouldn’t be qualified…
If the storm had moved just 10 to 15 miles farther north in the Gulf of Mexico before making landfall, the devastating surge that hit farther south would have focused on the more densely populated Naples and Fort Myers area, and no one would be questioning the storm surge forecast…
Hal Needham, a storm surge expert at Louisana State University, said he understood the rationale for the Hurricane Center forecast. “I don’t think their forecast was inappropriate,” he said. “If it had stayed offshore longer, it would have changed the surge big time. Naples lucked out.”
But one does wonder whether the Hurricane Center could add some language in its advisories to fully explain its forecast, just for the sake of completeness and transparency.
***Media outlets and forecasters rely on the Hurricane Center and take its forecasts as gospel…
https://www.washingtonpost.com/news/capital-weather-gang/wp/2017/09/12/why-the-storm-surge-forecast-for-irma-wasnt-so-bad-but-not-totally-complete/
11 Sept: NYT: The Monster Surge That Wasn’t: Why Irma Caused Less Flooding Than Expected
by Henry Fountain and Brad Plumer; Lizette Alvarez contributed reporting from Miami and Christine Hauser from Marco Island.
NAPLES, Fla. — Across coastal Florida, the dreaded storm surge from Hurricane Irma — caused when ferocious winds pile up ocean water and push it onshore — was not as bad as forecast…
That bit of good fortune was the product of some meteorological luck.
Because a hurricane’s winds blow counterclockwise, the precise path of the storm matters greatly for determining storm surge. Had Irma lingered far enough off Florida’s Gulf Coast, its eastern wall, where the strongest winds occur, could have shoved six to nine feet of water into parts of Fort Myers and Naples, while swamping Tampa Bay and St. Petersburg as well.
At the last minute, Irma unexpectedly veered inland right before it got to Naples, taking its eastern wall safely away from the ocean. That meant that as the storm tracked north over Naples, Fort Myers and Tampa Bay, the winds at the head of the storm were moving west and actually pulling water away from the shoreline…
Tampa and St. Petersburg saw just two to three feet of storm surge, according to data from Hal Needham, a storm surge expert and founder of the private firm Marine Weather & Climate.
“That initial draining of water acted as a crucial buffer,” said Rick Luettich, director of the University of North Carolina’s Institute of Marine Sciences and an expert on storm surge…
Sea-level rise caused by climate change also worsened the storm surge that did occur in many areas. In Miami, sea levels have risen roughly 10 to 12 inches in the past century. “That may not sound like a big deal, but when combined with a four foot surge, it can mean the inundation of thousands of more buildings,” said Dr. Needham…
Chuck Watson, a disaster modeler for Enki Research in Savannah, Ga., had initially predicted total damages as high as $150 billion to $200 billion, which would have made Irma the costliest storm in United States history.
But once the storm shifted inland, Mr. Watson downgraded those initial estimates to around $50 billion, which would still make Irma one of the five costliest hurricanes on record in the country…
Experts also warn that Florida’s west coast should not get too complacent after this bout of relative good fortune.
***If a major hurricane were to travel from the Gulf of Mexico and barrel northeast directly into Tampa Bay, that could produce surges of 15 feet or more…
https://www.nytimes.com/2017/09/11/us/storm-surge-irma-flooding.html
00
no shame, when trillions are on the line!
12 Sept: Thomson Reuters Foundation: Laurie Goering: As climate threats grow clearer, risk-lowering investment is crucial: bankers
As worsening mega-storms, floods and droughts claim more lives and cause billions of dollars in damage around the world, recognition of the need to act quickly to curb climate change is growing, banking experts say.
But getting trillions of dollars in cash to the projects that can quickly make a difference – from electric vehicles for Mexico to big-scale solar power for India – remains hugely challenging, they say…
“We’re confident the money is available at the scale we need it,” said Ed Wells, a sustainability expert and head of global markets policy at HSBC Bank in London.
Right now, “the supply of projects is what’s short, not the supply of money,” he said.
To kick-start a bigger pipeline of investment-friendly climate projects, international bankers and officials from Mexico, Nigeria and Colombia are meeting in London this week to try to thrash out a first set of ready-to-fund climate projects.
Vietnam is also participating in what’s being called the Climate Finance Accelerator effort, though as an observer…
“You can’t green the whole world at the same time. Let’s start with the four countries here today,” (Ed Wells/HSBC) said on Monday at the launch of the week-long effort at the London Stock Exchange…
Making the kind of changes needed around the world could cost $90 trillion, said Roger Gifford, chair of the Green Finance Initiative, an effort to make London a leader in climate-friendly lending and investment.
But Wells, of HSBC, said two-thirds of that is already potentially available, in the form of private investment looking for good projects.
“Most of the money is there if we can just create the structure to let it flow,” he said…
“Financing the transition to the low-carbon economy is possibly the biggest opportunity (HSBC) has ever faced,” he said…
With a string of hurricanes slashing across the Caribbean and the United States, and cities from Houston to Mumbai recovering from flooding, climate risk is increasingly easy to see, the experts said.
“Anyone who switches on the TV at the moment feels like they’re in a climate disaster movie,” (head of international projects at Ricardo Energy and Environment Chris) Dodwell said…
https://www.reuters.com/article/us-climatechange-finance/as-climate-threats-grow-clearer-risk-lowering-investment-is-crucial-bankers-idUSKCN1BM25C
from Carbon Brief Daily Briefing 12 Sept 2017:
Big investors to put more money into tackling climate change
More than two-thirds of institutional investors are planning to increase investments related to tackling climate change, according to a new survey that suggests “green finance” is moving from the margins to the mainstream of global markets.
But more than half of the 497 institutional investors surveyed said they are receiving “highly inadequate” information from companies about their risk of disruption from climate change — as well their ability to benefit from the shift to low-carbon technologies.
The FT says the findings, in a study commissioned by HSBC, will “add weight to calls from Mark Carney, governor of the Bank of England, and others for greater disclosure of ‘climate risks’ in the corporate and financial sectors”.
10
In 2015 the German newspaper “Augsburger Allgemeine” had an intervju with a meteorologist, Klaus Hager, about this.
Link to the article (in german): http://www.augsburger-allgemeine.de/bayern/Meteorologe-findet-Diskussion-um-Klimaschutz-laecherlich-id32569342.html
Link to the article in English (Google translate): https://translate.google.com/translate?sl=de&tl=en&js=y&prev=_t&hl=no&ie=UTF-8&u=http%3A%2F%2Fwww.augsburger-allgemeine.de%2Fbayern%2FMeteorologe-findet-Diskussion-um-Klimaschutz-laecherlich-id32569342.html&edit-text=&act=url
00
ager: Glasthermometer was replaced by the year 1995 by electronic thermometers. And they react much more sensitively to temperature differences, they display faster. For eight years I carried out parallel measurements on the Lechfeld. The result was that the electronic thermometers showed an average temperature of 0.9 degrees higher than their predecessors. So, even though you measure the temperature here and there, you compare apples and pears. It is never said.
That is, by using other measuring instruments alone, do you get a higher temperature? And that is a weighty argument in discussions about climate protection.
Hager: That’s exactly how it is. Climate change and climate protection have become ideologically laden and polluted topics. Because you dare to contradict, because you are placed right into the corner of the environment. Especially when it comes to the targeted reduction of CO2 emissions, people are led around the nose. Whoever brings the so-called “greenhouse effect” scientifically or politically to the denominator CO2, should first think. The carbon dioxide is a nontoxic and natural gas necessary for photosynthesis. In addition, our weather is dependent on a two-digit number of individual factors of very different weighting. Weather and climate remain uncontrollable in their chaotic complexity.
The human influence on the climate is being exaggerated
…
Meteorologist finds discussion about climate protection ridiculous – weiter lesen auf Augsburger-Allgemeine: https://translate.googleusercontent.com/translate_c
30
And of course that replacement took place from 1985 through 1995, matching the 0.5C ‘sudden’ increase in temperature, a change which has stopped since. The 0.5C in ten years was multiplied to be 5C in 100years and we had the story of the ecopolypse driven by the motor car and the carbon cycle, from CO2 to carbohydrates (hydrated CO2) was blamed. Life on earth is threatened by life on earth. It is beyond logic or parody. Politicians should never be left in charge of anything.
20
There is tragic climate news from IRMA just in. Eight residents of an aged care facility have died after IRMA knocked out the electricity for their airconditioning. In the US that is a climate tragedy. In Australia, that is the intention of at least two state Premiers, using faux warming as their excuse. In fact they are doing precisely what they are pretending to stop.
20