
Click to enlarge
We can always rely on Peter Hannam of the Sydney Morning Herald to accidentally advertise the unscientific stars of the Climate Church.
“Spike in global temperature fuels climate change fears”
It used to be that science was symmetrical — the laws of physics worked every day. You know, thou shalt not create nor destroy energy, it’s one of those unarguable things. But UNSW has a new “special” kind of science where the global temperature can pause for years and billions of quadrillions of joules of energy can disappear and who cares? In politically correct science this is noise. But one hot month, caused by an El Nino and strap yourself in, glue on the Armageddon-helmet. Panic-now, Panic-later, Fear and Hellfire. The Mystical Sign has cometh!
![]()
Prof Rahmstorf seems a bit confused about what’s “noise” and what’s “signal”:
“It’s important to take this hot spike as a reminder that this is a really urgent problem” said Professor Rahmstorf, who until last week was also a visiting professorial fellow at the University of NSW. “We are running out of time to avoid a 2-degree world.”
Try and imagine him saying this:
“It’s important to take this cold spike as a reminder that this is a really not an urgent problem” said Professor Rahmstorf, who until last week was also a visiting professorial fellow at the University of NSW. “We have lots of time to avoid a 2-degree world.”
Does the Prof’s reasoning work every month or just on “special” ones? Looks like the new “special” science to me.
And here is the Yale grad, and UNSW Prof Stephen Sherwood (the man who changed color scales to make “zero” look red-hot).
Officially he’s a Climate Prof, but this sounds like a Climate-Prophesy.
He has the special gift, a personal crystal ball:
Slowdown is over
Stephen Sherwood, an atmospheric scientist at UNSW-based ARC Centre of Excellence for Climate System Science, said the recent surge in warming indicates the slowdown in surface temperature increases of the past 10-15 years is over.
So sayth the man who “predicted” one hot month in two decades and finally got lucky? Now, despite the models being wrong for 18 years, in a flicker they are “right”. Three years from now if the pause still exists will he give up his job and pay back the salary?
“We knew that was never going to last,” Professor Sherwood said, referring to what had been dubbed a “warming hiatus”. “We’re back on track to where the models were predicting.”
So climate models got one month right out of 18 years? Err, “Congrats”.
My prediction is that if the world cools by 2023, Sherwood and Rahmsdorf will still not have the honesty to admit they were wrong.
Despite facing “an emergency in slow motion,” political leaders have largely failed to take major steps to start cutting emissions, he [Sherwood] said. “We’re not even fighting the battle, so of course we’re losing”
This is an emergency in slow motion, but Sherwood is a case study. Our top universities are employing UnScientists and calling them Professors. They break the most baby basic rules of logic and only people who are free of the university-system and other vested interests, can point out the bleeding obvious. What kind of scientist doesn’t understand signal from noise?
So called “journalists” who are supposed to spot this sort of failure are trained by the same universities to be blinded by the starring glow of a title that meant something 30 years ago. No wonder no one wants to pay for the poor reasoning of the Fairfax SMH, they get this sort of fallacy from the ABC for “Free”.
The government is strangling science.
____________________
Australian abbreviations:
ABC — Australian Broadcasting Corp. (Publicly funded like BBC, CBC.)
ARC – Australian Research Council (Hands out the grants.)
SMH – Sydney Morning Herald (owned by Fairfax)
USyd – University of Sydney, NSW, Aust.
UNSW – University of NSW, Australia.
UWA – University of Western Australia.
Image: adapted from wikimedia Daderot


One swallow does not a summer make…
Sounds to me that Sherwood has taken a couple of real, big gulps.
221
Let the alarmists have their fun with this current highly predictable temperature surge, it will all be over soon.
This month is likely to be close to last month’s level and perhaps April as well, after that it is a long slippery slope down into media oblivion.
70
Nice graph showing a steady average climb over the last 35 yrs
[Righto Frank. What do you call it when Jo is willing to post the graph? Denial? What Frank?
Apology accepted Frank.] ED
56
..but isn’t supposed to be getting cooler??
05
Its a pretty graph, but reality unfortunately looks like this.
https://i.guim.co.uk/img/media/7626d9c85d8dc0d15a3bfb463124f2c37820d905/0_0_677_461/master/677.jpg?w=620&q=55&auto=format&usm=12&fit=max&s=3eab9bd267c4b378e431f65a42f4a842
05
Dear ED
I point out the graph’s climb in temp and you want me to apologise ?
Also, it highlights the 1998 hiatus BS because the big picture was ignored.
13
Pause BS? Righto — so you disagree with Pachauri, Jones, Meehl, Lean, Trenberth, etc. Goes against the religion eh?
As for the big picture – Dream on.
41
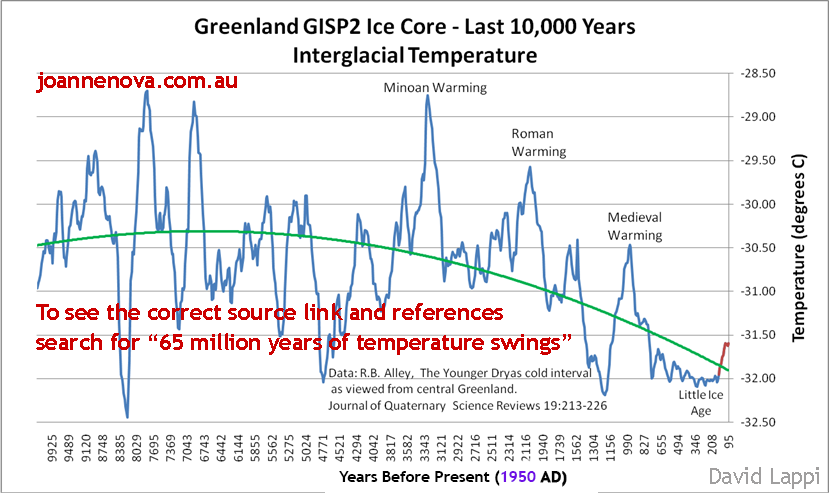
Why only Greenland and only go to 1950, seems a bit odd really.
20
ED
Those guys are in the tiny minority- and for good reason.
This graph should go further back showing when the Earth was really warm, are you trying to prove global cooling ?.
What counts is the post industrial red bit.
03
I suspect Jo’s “proof” uses some form of radioactive dating, hence the lack of measurement post-1950. Splice actual Greenland warming from that date and you’ll find yet another hockey stick.
21
Frank says, “Nice graph showing a steady average climb over the last 35 yrs”
This is obviously some new and mysterious usage of the word “steady”.
00
It’s my birthday today and realised the last 38% of my life has been in hiatus, despite the Sherwood’s of the world I expect to get the cold shoulder for the next 38%.
193
Happy Birthday
160
Happy birthday from me, too (also, as well). 26th of March is an auspicious day. It’s my 33rd wedding anniversary 🙂
111
Happy Anniversary. 33 years is no small milestone in these days of disposable mates. 🙂
80
and disposable everything else. See http://balance10.blogspot.com/2016/03/then-theres-just-small-matter-of.html
00
Happy Birthday Yonnie. It’s a special day for us too, also a family birthday.
80
Now, if you care to share the place and reasonably accurate time, including the year, of your birth, I, or more accurately my wife, will cast a horoscope that will predict your future. I’ll bet it will be more accurate than the computer models of climate.
Nonetheless, Happy Birthday.
50
I’m sure that you will see colder weather in the next so many years.
From a technical analyst’s reading of the chart in this article I can describe it as follows.
1/ There is a sub wave going up from the low on the chart half way between 1990 and 1995 (mid 1992). This subwave is now complete because of the Feb 2016 high. Also its shape and the number of complete sub waves within it and its internal sub waves have completeness in relative internal symmetry.
2/ This sub wave going up finishes with the top made by the high value in Feb 2016, so the Feb high is a toping structure.
3/ All the temperature action over these approx. 22 years appears correctional as opposed to trending, because there are hardly any new highs in temperature values with most of the intermittent readings either lower or caught in a range moving sideways. This means that this up move in temperature is a correction to a much larger wave in the opposite direction (down) that is trending or more sharp in its overall movement than this 22 year sub wave.
If the data in this graph is accurate and not fiddled with one can therefore conclude the following:
There has been a longer period, say over the last approx 100 years or so where temperatures have been declining. This last 22 years starting in 1992 have been an internal corrective subwave in the opposite direction up, culminating in a current toping formation. The internal part of this 22 year up subwave has collapsed leading to the ‘hiatus’. The next sub wave starting around about now will be down and trending. It will be at least as long as this small upward corrective subwave, so expect a downward movement in temperatures for at least the next 22 years to 2038.
210
Ummmmm… People laugh along at the unscientific statements by UNSW ‘scientists’, and then mark up a comment with no underlying scientific merit whatsoever? Just goes to show how tribal the marking system is. Feel free to demonstrate your lack of scientific understanding by marking me down.
712
Peer review may not be perfect but Birthday threads are more for appreciating, even the grumps.
50
Bulldust, for the benefit of the blog readers here, I thought it important to post a few words in defense of properly implemented technical analysis of dynamic cyclical phenomena in the natural world.
This approach to cyclical dynamics is indeed highly scientific in its method. Complicated internal relationships do exist within cycles shown by accurate data. Empirical scientific research into cycles is only possible through employing a very scientific method and employing quite complicated mathematics. And of course, there is the need for highly accurate data.
One should not confuse the above with data analysis activities such as the popular ‘Fibonaci’ ratios, ‘momentum analyses’ and ‘pattern recognition’ etc. made popular by numerous authors starting with Elliot. These publications in some cases were inspirational in pointing to further research but mostly were of the type of content that may deserve the sort of comment you made.
61
I wish you would post your own concurrence to the huge difference between somewhat repetitive, (occurrence of some small fixed string of digits in the decimal expansion of PI), the cyclic (exact repetition at some fixed time interval), and what is observable in this physical, which resembles neither of the above!
All the best! -will-
17
Patterns in any series not explained by an underlying scientific model are no use whatsoever. Humans are very adept at ‘seeing’ patterns and equally adept at fooling themselves into believing they mean something. That is my polite response. I see at least seven scientifically illiterate people disagree with me. No matter, as their opinions are of no worth in such a point completely beyond meaningful debate. Properly implemented technical analysis… Funny that, but sad.
25
Respectfully, you can’t really make such comments on something you have no experience with and clearly, have no knowledge or understanding about.
31
And if you re-read my post above you will see that our analysis has nothing to do with patterns or pattern recognition, Cheers
30
I don’t have to be an expert on technical analysis (which would be a complete waste of my time) to know the gist of it. Name one scientific underpinning of your “not pattern recognition” methods. If you are simply looking at time series data and spotting trends, patterns, waves, or whatever you want to call said shapes in the data, it is the antithesis of the scientific approach. There is nothing else that should have to be said on the matter, but you seem determined to validate said “system.”
When you speak of seeing “sub-waves” and “topping structures” yes, you are looking at patterns. Shapes in the data. Whatever you want to call it, and it is the scientific equivalent of a half step up from reading tea leaves or animal entrails. At least you are looking at the data, rather than the animal guts, but without an explanation of why you see said shapes the analysis is all but worthless.
I have explained this very simply, so I don’t see why this is difficult to grasp. It’s one thing to guess the future correctly, but it is far more important to know the reason for the changes in the data.
14
Are you for real Bulldust? Great name choice by the way, really suits you.
30
No response so I presume you concede the point. Ad hom … wow grats.
03
Here’s a fair proposal. Take your ideas to WUWT on an appropriate thread, and let’s see how the scientists blogging there react.
13
you are talking unadulterated tosh. Bulldust is being kind.
13
Tell someone who cares what you think Gee Aye
[We can appreciate your sentiment. But it doesn’t really contribute anything interesting. So let this be the end of such comments.] AZ
00
Robert, did you use a random nonsense generator?
37
If you did I’m sure Sherwood and Rhamstorf would be interested.
17
I thought Robert was having a bit of fun.Anyway it was far too technical for me
30
No, I used something better……..25 years of practical research into chart analysis. Sounds amazing but works for me in other areas, so why not temperature data ha?
130
Happy Easter to everybody by the way
100
Happy Birthday, Yoni.
And you’ll get no cold shoulder from any of your numerous friends here — strictly unthinkable to do that. 🙂
Let not the weather be of any concern either because you see, if you don’t like it at the moment, all you need to do is stick around a while and it’s sure to change (not a direct quote). I’m no longer sure who made that a famous axiom but it is true, the weather changes frequently.
40
One month out of two hundred odd doesn’t really prove anything, but every drop of evidence supporting AGW is emphasised by the media whilst the bucketful to the contrary is ignored; that’s the political bias.
212
Additionally, the professor does not elucidate how CO2 is implicated in any of this hiatus/spike thingy.
141
I expect they would say “There, we told you so, all the heat was hiding in the deep dark oceans and now it’s gonna fry us”.
I’m sure we’ll see soon enough how wrong that is.
70
The spike required a 1.4W/m2 imbalance, with 0 rather than 90% shared with the deep oceans.
Still doesn’t fit the modelling.
10
‘Climate-Prof’, ‘Climate-Prophet’, nah….’Climate Playboy’ more like.
These funded ‘Climaterati’ are eco-political dilettantes. They love the lights, policy power and centre stage. In fact, they’re addicted to it. They’ll do or say anything to get their fix and they can’t see the writing on the wall.
AN ESTIMATE OF THE CENTENNIAL VARIABILITY OF GLOBAL TEMPERATURES
Lloyd PJ. Energy & Environment · Vol. 26, No. 3, 2015
Keeping to 2C shouldn’t present the slightest difficulty for business as usual.
132
The radical leftists never seem to amaze and disappoint.
71
Oops that should have read the radical left never cease to amaze and disappoint
61
Works both ways.
50
Why fix what wasnt broken?
50
The maximum temps here in Broome at this time of year are jet aircraft fuelled. I guess many other weather stations are too. Jet powered maximum temperatures.
Then the hottest years in Broome were in 1948 and 1954. Would like more of that.
Hey, Peter Hannam, you need to get out some more. No wonder Fauxfacts is in dire straits.
82
Tom,
I’m suggesting a new word for the likes of these
Empixellated
To describe those who spend too much time looking at computer screens and not enough in the real world
81
The paws of physics? The pause of physics? The laws of physics? How can one tell.
40
If it forms a basis for making predictions from and most of the preditions come mostly true, then it’s physics.
If none of the predictions come true or prove to be totally wrong, then it’s CCS (Cargo-Cult Science or pseudo-science). That’s how you can tell.
70
And if it leaves footprints in the butter, then there are paws at work in there.
30
IPCC physics is full of pores.
10
Pausible I guess.
10
” SPIKE in global temperature fuels climate change fears ” a spike has a sharp up slope followed by a sharpe down slope , so they inadvertently admit that the recent uptick will soon drop back down to hiatus levels again , and the fear they try to extract from the uptick is baseless .
161
‘the recent uptick will soon drop back down to hiatus levels again …’
Or perhaps a cooling trend could develop and its curtains for them.
https://i2.wp.com/i38.tinypic.com/11s30c7.jpg
90
Jo says:
From having read some of Rahmstorf’s papers, some confuddlement and befusal almost seems to be situation normal.
We should take note of Prof Sherwood’s utterances so that during the La Ninja which follows the El Nino, they can be played back to him, publicly. Just in case he forgets his Prognostications.
141
The “La Ninja” is bound to catch him underwears. 🙂
50
I’ve read that the mature Thomas Malthus did look with skepticism on the prognostications of his younger self. Our current crop of soothsayers never look back, so being wrong isn’t a problem. They simple forge ahead making up new stuff.
Consider Paul Ehrlich as a prime example. He acknowledges things haven’t come about as fast as he expected because human ingenuity has intervened, but those awful things are still coming.
Somehow being clever, original, and inventive ceased with Archimedes, Newton, Einstein, or maybe Bill Nye. Nye was a young man when Ehrlich was promoting “the population bomb” and Stefan Rahmstorf just a kid. They believe, and unlike a good leader they never look back to see if anyone is following.
40
I thought the story really needed a graph to capture the scientific flavour. So I added one.
131
Second best hockey stick I’ve ever seen Jo. 🙂
31
The handle is a bit rough, but that should give it some … traction. 🙂
00
Use a simple scaling ‘law’ where 1 month of weather is equivalent to 1 year of “climate”. Then, woodfortrees provides a handy way to plot up the UAH satellite data, and by carefully selecting the start date (one of the features of climate science), it is possible to create a wonderful hockey stick with a start date of 2013.4. Really quite stunning:-)
And of course, the same process can be repeated for data starting at 1995.3 and extending for the same 2.8 years. And if I remember correctly, this hockey stick of two decades ago was also labelled climate change.
70
Joanne,
Can you please explain just how that “anomaly” thingy works? A difference in a variable from any reference is called the first derivative of that variable with respect to the reference. For a functional variable the variable must be a function of the reference, can be a constant, or anything else containing a symbol that represents the value of the reference!!! Your graph indicates a function of something, or the first derivative of something with respect to calender time. But in your graph the function of temperature with respect to calender time is completely missing so that there is no possible meaning to the value of the anomaly. Is the premise here that temperature with respect to calender time is supposed to be a constant? What constant? Is the temperature with respect to calender time supposed to be some periodic, non periodic, exponential, series expansion, or any other “function” of calender time? What is it from which an anomaly can be established?
The CAGW proponents claim, with 97% certainty, that surface temperature is supposed to be some monotonic function of atmospheric CO2 percentage; that by measurement (from Mauna Loa) is an annually cyclic but monotonically increasing over the repeated annual function. Should not then your graph of temperature “anomaly” with respect to calendar time indicate a continual increasing negative anomaly?
Have we been “had again” from this fraudulent concept of anomaly?
All the best! -will-
[“Fraudulent” will get you into moderation and usually would be snipped out. But I’ll leave this one so Jo can answer you on the matter of whether the concept is fraudulent or not.] AZ
07
[Will, don’t push it too far. I approved your perfectly good comment with an explanation as to why it was moderated. There is a reason some words get trapped. And I only get to enforce the rules or in some cases, decide I can make an exception. This time I could make the exception. Don’t throw that back in my face when I was looking out for your interest.] AZ
Thank you AZ and Thank You Joanne. I was trying to not write anything derogatory of an identifiable individual as to reflect badly on Joanne’s blog. Here in the US, courts are quite lenient when calling out governmental organizations trying to fool both the public and that same government.
Academic organizations teaching this BALDERDASH! need even more severe treatment. Is that the proper term for you Aussies, Kiwis? Here it is Hog’s-wallow or Hog-swallow.
All the best! -will-
00
Jo
These folk ought to do a bit of acknowledging!
“This is not to say that supernaturalism does no good whatever. Strabon of Amasia, the great geographer of the time of Augustus, knew what he was talking about when he remarked: “The great mass of women and common people cannot be induced by mere force of reason to devote themselves to piety, virtue and honesty. Superstition must therefore be employed, and even this is insufficient without the aid of the marvelous and the terrible”.
L. Sprague de Camp (1963). “The Ancient Engineers”.
80
I am so tired of discussions on ‘global temperatures’ that I barely skim the text these days looking in desperation for any science of radiation from gasses in the atmosphere. My own studies have convinced me that the true ‘greenhouse gasses’ of the atmosphere are nitrogen, oxygen and argon. Time and time again I read the statement that warm air rises and cools but never any explanation as to where the energy went. Science tutorials on the net claim energy cannot be created or destroyed only transferred, so where did the cooling air transfer its energy?
I would be very interested in reading about the theoretical adiabatic lapse rate for an imaginary planet with a pure nitrogen atmosphere, no other gasses what so ever. Any takers?
By the way, CO2 molecules radiate effectively over the 13 to 17 micron band from anywhere in the atmosphere as long as the local temperature is above MINUS 30C. Next question; IF CO2 is absorbing any photons in that range why don’t they absorb photons from other CO2 molecules which are all around not just underneath like photons from the surface?
65
I’ll have a go:
Last question first, CO2 does reradiate in all directions. Some of the radiation reflected from earth is absorded by co2 and other tri-atomic molecules(or quads for that matter).
Nitrogen and oxygen make up the bulk of the atmosphere but they are di-atomic, and do not have the same degree of modes of vibrations within their structures to absorb energy. For that reason they are not considered “greenhouse”. H2O is the most prevalent tri-atomic molecule and shifts enormous amounts of heat to the upper atmosphere and beyond, especially since it has the ability to change phase, fall to earth,change phase and rise to dump it’s heat in the upper atmosphere. My logic tells me that most of co2’s Re emitted heat would be absorbed and dispensed with via the H2O route as discussed by David Evans in his earlier posts.
91
P.S.from the upper atmosphere the energy is radiated into space.
40
Robk , thats the first time ive come across the term tri-atomic molecule , thanks it helps my understanding . PS is that why CO2 molecules tend to want to sink thru the atmosphere rather than rise thru the air , as in CO2 has an extra atom compared to Nitrogen and 0xygen ?
21
The molecular weight of CO2 is greater than N2 or O2 gases but it would be only in confined areas, such as poorly ventilated mines that air is still enough for the CO2 to settle and be an asphyxiation hazard by excluding O2.
40
” that air is still enough ” thanks Robk , but that might only be a general rule of thumb , with ” lake overturn ” being an exception to the rule , when a lake bed is disturbed large quantities of CO2 can escape to the surface , creep along the land surface ( in an open atmosphere ) displacing oxygen and suffocating every living thing in its path . Sorry to be off topic , was just curious thanks
30
I understand there are instances of “out gassing” of CO2 from various sources that can lead to that situation, yes. It’s also a potential hazard when co2 is liquified and sequestered in the ground under pressure.
50
Richard,
A. Comprehensive descriciption of the Earth ‘s radiation to space has still to be developed. H2O and CO2 both radiate at their characteristic wavelengths and there is an atmospheric window, where there ground/sea radiates directly to space, if there is no cloud cover.
Perhaps you are correct. The non radiative gases help keep the heat in the atmosphere.
22
I recall reading somewhere that an atmosphere of only nitrogen would increase the earth’s surface temp by 30 deg C compared to having no atmosphere. The present atmosphere does a good deal more “blanketing” or “greenhouse” but I don’t recall the details of the estimates.
42
I’m a long retired electronics tech but still remember some of my math (I hope 🙂 ).
Take standard sea level air pressure; I calculate this gives us about 10,300 kilograms of air on every square metre of the surface. 0.04% of that is 4.12 kilograms, but CO2 is a heavy molecule and my rough calculations make it about 6 kilograms of CO2 for every 10,300 kilograms of air. Now look up the heat capacity of all the gasses in the atmosphere. If anyone tells me that 6kg of CO2 can keep 10,300kg of air some 30 degrees warmer than expected all I can say is “C’mon! Pull the other one!”
43
Isn’t it the water vapour supposed to do most of it with the CO2 warming acting primarily to increase the water vapour and causing a tropical tropospheric hotspot if it was happening ?
40
That’s the hypo*cough*thesis.
The problem with that of course is that more water vapor means more clouds, which has a cooling effect.
Of course none of this has happened. Atmospheric water vapor has declined (despite warming!).
Warming from CO2 is less than even luke warmers admit.
The cause of 20th century warming is in fact due to less cloud cover.
Svensmark explains it all and when this is all over he will get a much deserved Nobel Prize.
73
“Take standard sea level air pressure; I calculate this gives us about 10,300 kilograms of air on every square meter of the surface.”
By what means do you consider that the 2 dimensional surface pressure (a scalar) divided by the force of gravity on a singular mass (a vector) results in the mass of the 3 dimensional atmosphere? Where has gravity’s compressive process on a fluid with no fixed volume ever been scientifically considered? High time to consider the Yang Mills theorem and Yukawa potential on the geometry and try to discover how an atmosphere may respond within a planet’s gravitational field. The ideal gas law has no provision for gravitational influence.
This is the same sort of ‘off the cuff guessing’, with no thinking, that is widely used by academic meteorological astrologists. The very same ones that brought you CAGW!
All the best! -will-
46
A bit late for me to look at stuff like this but for anyone interested…
http://michaelnielsen.org/blog/yang_mills.pdf
I will try and work with the ‘ideal gas’ laws and the kinetic theory of gases. I agree the square metre column of air is an over simplification but I find people who have never discussed this subject can appreciate the extent of the CAWG hoax when explained like this.
More highlights… a cubic metre of air in front of your nose is 99.9% NOTHING! The same emptiness as found between the stars. This leads to discussions of heat (molecular vibration) and kinetic energy, air pressure (gravity) and temperature. Talking rocket science to the man in the street is not effective.
24
That abstract algebra is a real bitch! I do not claim to understand such. The main point of your excellent reference to Yang Mills is the idea of scale!
The meteorological rhetoric is that “exists” some partial derivative of atmospheric pressure with respect to altitude called the hydrostatic equation: ∂P/∂z = -g
This little puppy has so many incorrect assumptions with intent to deceive that it is everywhere false! That partial cannot exist; as any partial demands all except the terms of the ratio remain constant. In this atmosphere there is only the triplet of pressure, density, and temperature all simultaneously decreasing with increasing altitude. Yet this same intentional falsehood is used in every global circulation model!
Back to the scale part. The typical scale for a gravitational field is astronomical distances. There the magnitude of the potential force field decreases as 1/r².
Near the Earth’s surface (location of atmosphere) at radius 6,365 km, most assume that for a singular local mass (blob of stuff); gravitational “acceleration 9.8 m/s²” and is independent of mass of stuff, but the “force 9.8N/kg” is proportional to the mass of stuff!
At the molecular scale of atmospheric gas 10 nanometers is a huge distance. The distance ‘tween molecules at a pressure altitude of 10kPa. Here the compressive force of gravitational attraction on each molecule comes close to the expansive electrical coulomb repulsion of that same molecule. Both are Yukawa potentials within this scale. Below that altitude the force of gravity no longer has any acceleration potential on atmospheric molecules.
It only can attempt to maintain the triplet of increasing increasing density, pressure, and temperature with decreasing altitude as prescribed by the gas law; at the speed of sound, throughout the entire current volume of the whole atmosphere! Atmospheric dynamics prevent any actualization of the above equilibrium.The atmosphere itself exhibits none of the concept of ‘heaviness’ called weight!
All the best! -will-
16
Thanks Will! You put into words very well what I’ve often suspected.
Cheers
04
Water vapor is the most important component of the so called “greenhouse gases”. Water vapor has the highest heat content of all the atmospheric gases. Water is unique in that it has a rather high boiling point and freezing point for a substance of such low molecular weight. This phenomenon is attributed to “hydrogen bonding”. The evaporation of water and condensation of water vapor are important heat regulating mechanisms and keeps the temperature of Earth within the bounds favorable for life.
40
All good points Howie, but there is much, much more.
Chemistry chappies have a unit called a ‘mole’ for recording the masses of different gasses at specified temperature and pressure. Nitrogen, N2 is 28 grams per mole, Oxygen, O2 is 32 grams per mole, water vapour, H2O is 18 grams per mole and carbon dioxide, CO2 is 44 grams per mole and all have equal numbers of molecules per mole. If we take the average mass of the atmosphere to be 29 grams per mole ( 4 x N2 + O2 ) we see that CO2 is 150% of average mass and H2O is 62% of average mass. Figures are rounded to help the explanation.
Let us assume we have a dry day with only 1% water vapour on the atmosphere. 1% of 10,300 kg is 103 kg, 62% of that is 63.86 kg, call it 64 kg of water vapour in our 10,300 kg square metre column of atmosphere. Well now, in this same column of atmosphere we have 6 kg of CO2.
Now we need to look at the respective radiation characteristics of H20 and CO2. We will see that H2O completely swamps CO2 except for the 4.3 micron band. When the sun is shinning H2O has 7 times the absorptive action as CO2 thus warming the surrounding atmosphere much more heavily than CO2. Also this absorbed sunlight does not reach the surface, a very effective coolant. When the sun is not shinning we must look at the 10 micron band and beyond. CO2 is active over the 13 to 17 micron bands and H20 is active over the 14 to 70 micron bands.
Which ever way you look at it for just 1% water vapour in the atmosphere giving TEN times more H2O molecules than CO2 molecules how can anyone claim CO2 controls anything?
62
Richard111 Thanks for the chemistry refresher course. Guess I’ve forgotten a lot since I received my PhD in ORGANIC PHOTOCHEMISTRY in 1970. A long time ago to be sure. I agree that carbon dioxide is not important in global warming. However, to call oxygen and nitrogen greenhouse gases is just plain wrong. For a molecule to absorb/emit IR radiation it must have a net dipole in one of its vibrational modes. Neither nitrogen, oxygen or argon have a net dipole in any of their vibrational modes. Carbon dioxide, water vapor, methane and ozone all have one or more net dipoles in their vibrational modes.
10
Howie from Indiana March 27, 2016 at 10:54 am
Nice catch for most deliberate consideration
“Richard111 Thanks for the chemistry refresher course. Guess I’ve forgotten a lot since I received my PhD in ORGANIC PHOTOCHEMISTRY in 1970. A long time ago to be sure. I agree that carbon dioxide is not important in global warming. However, to call oxygen and nitrogen greenhouse gases is just plain wrong. For a molecule to absorb/emit IR radiation it must have a net dipole in one of its vibrational modes. Neither nitrogen, oxygen or argon have a net dipole in any of their vibrational modes. Carbon dioxide, water vapor, methane and ozone all have one or more net dipoles in their vibrational modes.”
Have you considered the scale? No gas molecule is 100% transmissive nor 100% reflective at any wavelength/frequency. That wee leftover emissivity accumulates with path length and molecular density along that path. A strait path from 1000 km altitude, tangent to Earth’s surface, out to another 1000 km altitude, has what emissivity and apparent temperature, at each wavelength quite independent of your silly vibrational modes.
What is measurable not hypothetical?
All the best! -will-
15
Did you mean 1000m, Will?
10
No! the whole 2000km radiative straight tangential atmospheric path length, now slightly curved via gravitational attraction to even mass-less EMR. The emissivity at every wavelength must be now be 1-1/e, 63% by definition. What effective temperature at each frequency, however is left as an exercise for the students!
All the best! -will-
14
Howie, a greenhouse retains heat. CO2 and H2O do not but N2 and O2 and Ar do retain heat. By this definition which are the greenhouse gasses?
04
I gave the definition of a greenhouse gas above at 13.3.1.1. This stuff is old hat to the regulars on here. Certainly CO2 is not nearly as important as water vapor. In fact CO2 might have a net cooling effect since it remains a gas at high altitude.
15
Howie, not trying to give anyone a chemistry course, this is all stuff I read on the internet. The idea is to give readers an explanation as to why there is always (usually) more H2O than CO2 in the atmosphere and to question the claim that CO2 is responsible for increased H2O when H2O is a far more IR active than CO2 and then to think about the heating/cooling effects of these gasses in the atmosphere.
05
“Let us assume we have a dry day with only 1% water vapour on the atmosphere. 1% of 10,300 kg is 103 kg, 62% of that is 63.86 kg, call it 64 kg of water vapour in our 10,300 kg square metre column of atmosphere. Well now, in this same column of atmosphere we have 6 kg of CO2.”
———————————————-
More thoughtless arithmetic with no attempt at understanding! Your claimed 10,300kg/m² atmospheric mass would be 1030 g/cm² and 0.64 g/cm² of water in some phase of H2O, (your numbers)! Such is but trivial numbers with no weather. The average atmospheric column water (measured) is 2.4-2.7 cm or 2.4-2.7 g/cm². This goes from 0.1 cm (winter poles) to 15 column cm sunside thermal equator. Even with your ridiculous estimate of atmospheric column mass 1030 g/cm², (should be 350 g/cm²), the entire atmosphere must be above 30° Celsius to support the concept of 2.4 g/cm² water vapor.
For thoughtful consideration! Most all airborne water condensate (with little latent heat), but not WV, remains invisible except for cloud aggregates of greater than a smallest ‘barley perceptible clumps’ of a billion water molecules or more. This implies that invisible airborne water condensate is continually converting insolation power sunside (flux 1 kW/m²) into latent heat of evaporation of water at the rate of 2500 W-seconds/g!
This latent heat of evaporation spreads such accumulation of insolation power to all points on the globe, while creating interesting weather such as tornadoes and hurricanes, before being dispatched to space as entropy by the very same atmospheric water molecules. No part of Earth’s surface is actually needed for such fun games!
All the best! -will-
15
Regarding your imaginary planet with an atmosphere of pure nitrogen the lapse rate would be about the same as here on Earth. The reason it would be about the same is because the lapse rate is dependent on the ratio of two constants, one being g, the acceleration due to gravity, and the other Cp, the heat capacity of a diatomic gas at constant pressure. This would be true as long as your imaginary planet has the same mass and diameter of planet Earth and also the same number of gas molecules per unit volume in the atmosphere. Also there would be no weather on your planet as we have here on Earth since there is no water present.
20
“Regarding your imaginary planet with an atmosphere of pure nitrogen the lapse rate would be about the same as here on Earth. The reason it would be about the same is because the lapse rate is dependent on the ratio of two constants, one being g, the acceleration due to gravity, and the other Cp, the heat capacity of a diatomic gas at constant pressure. This would be true as long as your imaginary planet has the same mass and diameter of planet Earth and also the same number of gas molecules per unit volume in the atmosphere. Also there would be no weather on your planet as we have here on Earth since there is no water present.”
You have accepted this meteorological (astrological) fantasy for what sane reason? Have you any expressible theoretical or scientific idea of why this Earth has the amount of atmosphere it has? That total amount of atmosphere appears to be dependent on “ice ages” vs. “inter-glacials”.
All the best! -will-
15
That total amount of atmosphere appears to be dependent on “ice ages” vs. “inter-glacials”.
I’m intrigued. How does that work?
10
(“That total amount of atmosphere appears to be dependent on “ice ages” vs. “inter-glacials”.”)
“I’m intrigued. How does that work?”
The gas laws state that Pressure/density is proportional to temperature. Better stated as the kT/t noise power of gas, is a function of some “imaginary temperature” but proportional to the P/density of the atmosphere at any location within this atmosphere. If the whole damned thing is reduced in ‘temperature’ part of that atmosphere must become ‘not an atmosphere’. Sorry if this is not clear to you. I can only curl up in a ball and weep!
All the best! -will-
15
That’s clear enough, thanks. I thought you were implying something else.
12
Regarding the imaginary planet with the pure N2 atmosphere… since the N2 cannot cool by radiation the kinetic speed of individual molecules will eventually exceed escape velocity of some 3,000 meters per second and that N2 atmosphere would eventually vanish.
Luckily here on our planet we have oceans of water, multitudes of volcanoes and many, many tons of space debris to reduce that loss.
The idea that a volume of gas has no mass strikes me as strange. I wonder what made my sailing boat move about on the water?
05
Richard111 says ” since the N2 cannot cool by radiation ”
I’m not sure that’s right. Everything that has a temp above absolute zero radiates energy to a colder place AFAIK . Gases have energy proportional to the average velocity of their molecules. Radiative gas molecules store additional energy in the bending\flexing\twisting of the bonds between their component atoms.
If you had a translucent sphere containing compressed heated nitrogen, in outer space, would it not radiate? Of course if the gas is held in place by a gravitational field things may change, but this is beyond my understanding. 🙁
30
So the mathematics is +0.2 in one month, +2.4C in a year, +24C in a century. We are doomed! Tim Flannery, we didn’t listen to your wisdom. No point cutting CO2 now, the proven cause. Carbon taxes will not help. It’s all too late. No point doing anything now. We should just keep going as we are and enjoy. Good thing Australia owns a large part of Antarctica. We can start again, this time without fossil fuels or wood or the internet.
182
Sorry again, +24C in ten years, +240C in a century. Its the end. No need to put those Hot Cross buns in the oven. Just leave them outside.
142
Plenty of fossil fuels in Antarctica. Ownership is a bit iffy when push comes to shove.
51
O/T but breaking news
http://blog.heartland.org/2016/03/peter-gleick-resigns-as-president-of-pacific-institute-because-of-fakegate/
H/T Paul Homewood
https://notalotofpeopleknowthat.wordpress.com/2016/03/25/peter-gleick-resigns-as-president-of-pacific-institute-because-of-fakegate/#comments
50
As yet we don’t know why he resigned, apparently in a hurry.
But the fact that the Statute of Limitations on the two crimes he has admitted to doesn’t expire for another 10 months is interesting.
30
But of course it would be politically incorrect for the politicians currently in power to allow the relevant authorities to prosecute him so I am sure the establishment will illegally turn a blind eye towards the matter and Gkeick will get off Scot free.
30
Certainly that is the reason he has not as yet been prosecuted.
But between now and the Statute of Limitations expiry, there is a US election, uncertain in its outcome. It seems at least possible to me that the Pacific Institute is carefully protecting its’ donor base from possible damaging controversy. Gleick was the Director in charge of Ethics when he committed the admitted offences !
11
Four years later you can see that Gleick is so delusional [snip]
“And you’re right about political motivation, fudging of data, and outright fraud: but it is on the part of climate deniers and their funders, not climate scientists.”
00
I made the following comment on Homewood’s site:
“The facts of his crimes are known but the rest is speculation. Someday we may learn more but then again maybe not.
There are alternatives to the speculation. For example, 13,000 people die of Glioblastoma mutliforme each year. Maybe Gleick is getting ready to check out.”
20
“Back on track” !? given the gap between the average model and real world temperatures I would have thought the El Nino would have to keep going for some time yet. Clearly that isnt going to happen since a La Nina is already lining up her appearance Sherwood is set to be disappointed. Indeed, the pending La Nina looks like it could be a big one.
I have a question. Does the Nino Nina cycle produce a net temperature rise and how much is it ?
42
If it’s anything like the last big one in 1997/98, about 0.3°C, which would make a two step. As opposed to all the work being done to make temperature series confirm to a linear trend.
21
Given the heat capacity of water & over 2/3rds of the planet’s surface is covered in the stuff isn’t it entirely posdible that averaged surface air temperature is driven by oceans and it’s a bit of a toss up when it gives some up next – as has just happened ?
50
Everything pretty much depends on whether the massive amount of heat that has been released by the oceans is replenished.
Don’t expect CO2 to do that…..
Sunspots are declining, which means more clouds and less warming of the oceans and land. I expect cooling.
41
This is not correctr. While it’s true that a step up in temperature coincided with an El Niño in 1998, the cause of the uptick is less cloud cover (which also pushed the El Niño).
This time we are looking at an increase in cloud cover happening, so it will go the other way.
40
diogenes2 –
more detail:
25 Mar: HuffPo: An Open Letter From Peter Gleick: My Transition at the Pacific Institute.
As readers of this column may already know, earlier this week the Pacific Institute and I announced an important and exciting change: on July 1st after 28 years as co-founder and President of the Institute, I will be moving to a new position as President Emeritus and Chief Scientist. A wide search for a new president has been launched.
I’m neither resigning nor retiring. In my new role, I will continue to do research and writing on global climate, water and sustainability issues, and I will continue to speak out on science and policy issues in public forums, with the press, and on social media channels like this one at National Geographic ScienceBlogs and at Huffington Post…
On a practical level, before I transition to my new role, the selection of a new president is currently being led by a board-appointed committee (including staff members), which has retained California Environmental Associates, a San Francisco-based executive search firm to carry out the recruitment process. Here is the job description; please share it with appropriate friends and candidates…READ ON
http://www.huffingtonpost.com/peter-h-gleick/an-open-letter-from-peter_b_9548492.html
40
This is the process of “putting out to grass”. He was President but is being replaced, although he has neither retired or resigned. Instead a position has been created for him. However, if they have not changed their constitution, he has no status and the institute can distance itself from any future embarrassing events (i.e. criminal charges).
By the same process I am the “life president” of a professional body and for the same reason – I am past it.
20
Does this mean that he’s confined to pissing inside the tent?
40
No, anywhere but, he will soon be be saying –
“you see me here, you Gods, a poor old man as full of grief as age, wretched in both”.
King Lear Act 2 Scene 4
10
President 28 years since (co-)founding. Sounds pretty much like his baby.
Time for throwing out the bath water perhaps ?
20
Noise is a well understood concept in radio communication. There are even measurements for it – noise level, signal to noise ratio. Noise is a non coherent signal, it is random. It can have a spectral shape – white noise, pink noise etc. .
41
Noise is we’ll understood as opinion you get from the Guardian masquerading as Science, like this predictable piece by a well known satellite expert suggesting UAH must be wrong, ( since RSS has been bought into line).
51
“(since RSS has been bought into line).”
As yet, is no version 4 RSS of the lower troposphere.
40
Guardian noise may show little coherence but it is quite predictable from sampling of the hive mindset over time.
40
Noise is a well understood concept in radio communication. There are even measurements for it – noise level, signal to noise ratio. Noise is a non coherent signal, it is random. It can have a spectral shape – white noise, pink noise etc. .
20
You can even remove the noise by predicting & subtracting an image of it, as it happens.
30
Priceless:
“We knew that was never going to last,” Professor Sherwood said, referring to what had been dubbed a “warming hiatus”. ”We’re back on track to where the models were predicting.”
…we just didn’t know how long it might take
70
If we look at the graph of model predictions….no, we are not.
41
We’ll if he means the spike is pointing to where it should have been, perhaps.
20
No, it’s still nowhere near it.
30
One hot month in eighteen long years,
Has confirmed some Professors’ worst fears,
That this rare spike is due,
To man-made CO2,
Which no doubt was reviewed by their peers.
250
Priceless! Where do you get ’em? Never mind..
30
How he punctures climate sophistry
Seems a part of Ruari’s mystery.
Just enjoy the gifts from that nick,
Do not probe the magician’s trick.
30
Att! Peter Hannan:
Can you describe the steps you’ve personally taken to “wean yourself” from “dirty & dangerous addiction” to fossil-fueled travel?
~ ~ ~
Oct 2015, Peter Hannan, twitter:
Sydney to Canberra, fly or drive? Unscheduled repairs at SYD suggests I should have driven.
41
Yeah. I reckon he should ride a bike…or perhaps kayak up the East Coast……whichever is more dangerous.
(spell check just gave me “sanger oyster” when I mistyped “dangerous”). Never have had an oyster sanger….
60
You can hear them dancing in the streets as what they say is an unstoppable planet ending catastrophe is happening after all? Vindication. I told you the world was going to end and you only built 250,000 windmills! I suppose it is all they have after nearly twenty years of nothing. One month of hope.
121
It will be fun to watch them over the next several months as the peak subsides, and the plateau re-emerges and lengthens, maybe eventually to the full length of the satellite record. 🙂
Will they dare to poke their heads out of their crevasses, or will they run and hide with their b***s clamped firmly between their legs?
101
Nope. Andy, they will just torture the data till it falls down on the left and rises in the right side of the graph. Then they can say warming is worse than we thought.
11
@C.J.Richards – it’s not a matter of predicting it but rather having a raw version of it that does not have the signal in it that you want – as happens with noise cancelling headphones. If noise could be predicted then it wouldn’t be noise (it would have coherency).
50
Sherwood = https://en.wikipedia.org/wiki/Straitjacket#/media/File:Straitjacket-rear.jpg
10
Very minor correction to a minor sentence:
“The mystical sign hath come”
Although it’s more common in archaic speech to say “… is come”.
30
@Kim is right of course. It is correlated ‘noise’ I was thinking of like the echo on telephone channels which must now be routinely cancelled on mobile & internet telephony.
40
Could this be the last big El Nino before the effects of the observed solar slowdown take over?
50
I think so.
30
Its all about the planet trying to balance inputs vs outputs.
A lot of energy has been released from the oceans, and moved quickly to the upper NH, where it can be easily and quickly removed.
20
Aristotle (384 BCE – 322 BCE): “One swallow does not a summer make, nor one fine day; similarly one day or brief time of happiness does not make a person entirely happy.
So many people must be hoping for another +0.2C next month, or has this one just taken too much to organize?
50
But you’ve got to make the best of every one when living from one El Niño for the next.
61
I don’t know what the name of this phenomenon is but I’ve seen it several times and what happens invariably falls in one of two cases.
Using climate change as an example:
1. If you were never told that climate change was going on, that it’s a danger, then a hot month would be just a hot month. There’d be a lot of commentary and complaining about it but I don’t think anyone would ascribe any meaning to it other than, “It sure was hot last month.”
2. Or you’ve been told that climate change is happening and is dangerous, in which case, a hot month scares that pants right off of you.
In neither case does anyone — and I mean anyone at all, period — actually know anything just because, “It sure was hot last month.”
Aa a rough analogy, all it takes is priming the pump a little to make the difference.
It happens with computer users too. At the first sign of trouble it must be some malware attacking you. After all, they are out there looking for a way to get you. Yet most cases of trouble have more mundane causes such as what I’ve done more than once, you turned off the master power switch before Windows had completed shutting down or there was a power failure at the wrong time (same difference). And yes I do have a master switch. It lets me cut power to a number of things that aren’t needed when the computer is off: monitor, external hard drives, speakers, etc.
40
” “It sure was hot last month.””
NO.. it wasn’t.
Most of the positive temperature anomaly was in eastern Europe and especially northern Russia.
It is winter time up there.
They had a much less severe winter than usual.. and I bet they loved it !!!
51
Special Science, Jo? Sounds like the non-evidence based Evidence Based Medicine that John Ioannidis has been investigating.
Courtesy of RetractionWatch, there’s some nice nuggets of dynamite in here:
The IAC tried that on the IPCC once, then there was Donna Laframboise’s expose of the same, but we know how all that’s turned out.
With a hypothetical Exxon RICO case being rumoured in the USA, one wonders how publications about the One Hot Month could be used to argue adverse impact of “climate inaction”. Perhaps the special Sherwood science of this One Hot Month is what one New York attorney might describe as having “quasi-reliability” or “not-quite-reliable” if he’d been talking about climate and not medicine:
Concerns of reliability in the One Hot Month actually prompts the question: is the scientific statement “special” when the scientist creates it in the “special science” way, or is the statement special only after a journal or government spokesperson has bestowed specialness upon it? I ask you, is “special science” born or made? 🙂
50
[…] Joanne Nova We can always rely on Peter Hannam of the Sydney Morning Herald to accidentally advertise the […]
30
Rahmstorf is a disciple of Professor Hans “call me John” Joachim Schellnhuber; chief soothsayer to the court of Empress Angela the Welcoming and to Pope Francis the Innumerate.
Warm Hans Schellnhuber is infamous for his catastrophic climate prognoses which rival only those of our own Flim Flannery.
60
I just had to fix one of the images Hannam used…..
20
http://i67.tinypic.com/2n1xi02.png
20
Hello Jo Nova
When reading on iPad, the graph is party covered by ads.
And one more thing: as a Norwegian I am not familiar with the abbreviations. Please explain them in the text.
30
Thanks for the feedback Morten. I’ve updated the Abbreviations page to help you. Good point. It is a dilemma. Adding long acronyms to the text would be better for newcomers but would slow things down for the regulars. I’ve added a short list to the bottom of the post with the most common ones. Does that help? I may try to make the abbreviation note a regular addition to posts. — Jo PS: Im not sure how ads display in an ipad (and I have hardly got any ads?). I will have to find one to test. Thanks!
61
that happens sometimes with images from an iPhone, running into the sidebar.
The Vostok ice core graphs are another good example though with those there is the option to click a link to a full page image without the problem.
Have emailed a couple of screenshots to illustrate.
20
I have the same problem on my iPad, Google phone and laptop.
I reduced the text size one notch in Firefox which fixed the problem on laptop.
20
Using Firefox ‘reader mode’ with my phone solves the “problem”.
10
Doesn’t your blog software have a mobile device plugin?
I’m on a tablet and same thing, part of the graph is obscured by the right column.
10
That’s fixed it Jo.
Can you imagine, some of us browsing on a screen no larger than a credit card and now it’s fine.
00
Seeing as nobody has said it yet:-
How conveniently “just in time” for Chairman Mal’s electoral campaign.
( I wonder if Goldman Sachs will kick the tin for him or whether he will have to repatriate some of his tax haven funds?- DO AS I SAY, NOT AS I DO!!!!)
40
The very first thing I was ever taught in statistics all those years ago was: Beware the single point trend.
60
As in
A statician will fit a curve (under protest) through three points
An engineer through two
An ecofadist through one
41
“Beware the single point trend”
In target rifle shooting making a sight adjustment on the result of a bad shot is referred to as
“Error Chasing”
00
The pentagram on Tisdale’s graphic needs to be rotated 36° so a point is directly downward, reflecting the devilish insipidness of climate science.
41
I was waiting for this Jo, having read Hannam’s SMH article beforehand.
The “spike” is only actually seen in the NH temperature series:
GISTEMP LOTI NH & SH
https://bobtisdale.files.wordpress.com/2016/03/figure-8.png
How exactly, is this a “surge in warming” (Sherwood)?
61
Makes sense to the Climate Council. 90% of the CO2 is generated North of the Equator, so they get more of the global warming. There was probably a big spike in man made CO2 that month, perhaps the US elections?
61
Plus methane.
00
Talking of journalism, Whitehouse has a closer look.
http://www.thegwpf.com/arctic-ice-and-another-little-ice-age/
20
Don’t you just love what comes out of the UNSW-based ARC Centre of Excellence for Climate System Science?
So many professors, all “experts”, including Profs Pitman, England, Karoly, and Steffen, laureate fellow Sherwood, and visiting Prof Rhamstorf, many of whom will be recognized on this blog for their fabulous predictions.
All funded by our taxes.
With so much expertise and excellence all in one place, they knew this spike was coming, and now courtesy of the analytical reporting of Peter Hannam of the SMH, we have been warned of the imminent catastrophe. We are all doomed!
But before we reach this catastrophic “2 degree world” (or didn’t the Paris COP21 agreement prefer 1.5 degrees?), perhaps Peter Hannam could do some real investigation and get some answers from this UNSW-based CoE of the following:
– What will the global temperature be in July 2016 and December 2016?
– In what year will the global temperature reach 1.5 degrees above pre-industrial times?
– In what year will the global temperature reach this “must be avoided” 2 degree world?
– What will happen in the first year when we reach this 2 degree world?
With this information, I will be able to plan my future with confidence.
71
Robber
“With this information, I will be able to plan my future with confidence”
I don’t know if you ever heard the modified version of a well known APC powder add which went
“She took Vincent’s with confidence and now she’s after Vincent”?
30
20 years of unpredictable ‘Natural Variation’ and now this happens. To real climate scientists like Flannery this month was man made warming and obviously due entirely to CO2. How they can tell is a mystery to non professionals.
31
You have to love the big events, La Nina and El Nino. Neither are predicted or predictable by any of the infallible computer models and they can dominate the weather for decades, ruining global warming predictions. Polar jet streams and adiabatic winds from Antarctica for Prof Turkey, trade winds cooling countries. Professional (they earn their living from it) warming enthusiasts can pluck these things out of the air to explain any phenomenon or failure but if a single reading anywhere goes their way, it is clearly an absolute proof of their fractured science. You have to feel the Southern Hemisphere and Australia in particular are letting the team down, being responsible for 1/3 of a planet. Homogenize faster!
51
This has likely been stated here before, but then I’ve noticed that what may be considered as known concepts somehow keep slipping through the cracks.
There is hard, irrefutable geological evidence from drillhole cores on both sides of the Pacific Ocean that the ENSO oscillations have been occurring for over 11,000 years. No mention of that fact from the CAGW advocates.
42
So these guys are not ‘climate experts’ but weather worriers.
32
The global warming alarmists (including many so called scientists [snip]) should really surrender themselves to an insane asylum. A proper scientific approach would be to wait another 10 years to see if this is an anomaly.
21
26 Mar: Haaretz, Israel: JTA: Netanyahu Denies Claims He Received Perks From French ‘Fraud Mastermind’
Prime Minister Benjamin Netanyahu denied a Haaretz report that a defendant in a major fraud trial set to begin in Paris donated funds to Israel’s Likud party and gave personal favors to Netanyahu before he became prime minister…
Mimran, who was convicted of tax offenses in France in the late 1990s, is accused of using front companies to collect VAT returns from France on carbon emissions permits that he bought from countries that did not collect VAT on them, like the Netherlands. Known as the carbon emissions scam, it is believed to have caused billions in damages in 2009 by fraudulently exploiting the differences in how industrialized nations encouraged reducing emission of greenhouse gases…
http://www.haaretz.com/israel-news/1.710974
25 Mar: Haaretz, Israel: Dov Alfon: Benjamin Netanyahu’s Shady French Connection
An unfolding investigative report details Netanyahu’s affiliation with a family accused of stealing anywhere from 300 million to 1.6 billion Euros.
The trial of Mimran, who denies all of the allegations against him, will begin in Paris on May 2. He is out on bail of 100,000 euros, after spending 10 months in jail awaiting indictment, on charges including extortion, in a different case. Police are also investigating his possible involvement in other cases, including the mysterious murder of billionaire Claude Dray, his ex-wife’s father…
In a series of articles slated to be published over the coming weeks, whose details were shared with Haaretz, Mediapart will claim that Mimran benefited from wide-ranging connections that managed to delay his trial until now…
According to the current indictment, which will be read out in a Paris court on May 2, Mimran and his partners stole at least 282 million euros from the European Union over the course of 10 months, from summer 2008 to spring 2009. Let’s pause for a moment over the fluid definition of the charge sheet, “at least 282 million euros.” If that’s the minimum, what’s the maximum? According to a report by an investigating magistrate, a copy of which was obtained by Haaretz, the sum that went missing from the French republic’s coffers is 1.6 billion (1,600,000,000) euros…
How did Mimran manage to steal hundreds of millions of euros in such a short time to begin with? According to the indictment, very easily.
In 2005, most of the nations of the world decided, as part of the Kyoto treaty for reducing carbon emissions, to allow industrialized states to trade carbon emissions permits. A country that had reached its allotted cap for carbon emissions could buy permits for additional emissions from countries that did not use their quota.
After this agreement — which Israel also signed — was concluded, France decided that all trades in carbon permits within its borders would be subject to value-added tax. Warnings by United Nations economists about the dangers of creating nonuniform conditions for global carbon trading had no effect; in 2007, the French Finance Ministry began collecting VAT on carbon trades carried out in France.
The trades were conducted on a special exchange called BlueNext, with brokers earning the standard 2-percent fee. People like Mimran had no trouble identifying the loophole that allowed them to turn 2 percent into 20 percent. “It was like leaving a Ferrari in a dark street with the key in the ignition,” one of the accountants involved told the investigating magistrate.
According to the indictment, Mimran bought hundreds of tons of carbon emissions permits on credit from industrialized states that did not collect VAT on them, like Holland. He then sold them back to France with VAT added, through bank accounts in Dubai, Hong Kong, Beirut, Tel Aviv and the Virgin Islands — a huge carnival of fictitious deals that sometimes passed through over 100 shell companies that were opened and closed within the span of two days. When the swindlers received the sales payments from France, including the 18-percent VAT, that 18 percent disappeared into the banking labyrinth.
After 90 days, the maximum period for paying VAT on exchange trades, the tax authorities began going after the VAT, plus fines. But at that point, they discovered that the company which had signed the VAT receipt had gone bankrupt, and its directors were homeless people or people who didn’t exist…READ ON
http://www.haaretz.com/israel-news/.premium-1.710864
10
I look at the graph and I see flat at -.15 to 1998 then flat at +.15 to 2016.
The question is -: will the graph drop to +.03 after this spike or drop back to +0.15? If 0.3, I think that may be significant since it may be a deviation from Akasofu’s model, which is still the only resonable prediction on the data we have at present.
20
26 Mar: Courier Mail: Daryl Passmore: Greenpeace again caught using misleading photos in Great Barrier Reef campaign
The environmental group this week tweeted a composite image of two photographs taken just months apart showing dramatic coral bleaching…
The accompanying caption read: “Time to listen to nature. The #GreatBarrierReef bleaching is a clear message – No more coal” and linked to media coverage of dying coral in north Queensland.
But the photographs were taken thousands of kilometres across the Pacific at Flowerpot Rocks, in American Samoa.
Greenpeace said the incorrect picture was posted accidentally…READ ON
http://www.couriermail.com.au/news/queensland/greenpeace-again-caught-using-misleading-photos-in-great-barrier-reef-campaign/news-story/7d2dd346c69006b3db81ec65c9768ad4
20
Top story on Climate Depot right now
40
“Hot Month Special Science” on JoNova … so hot right now.
10
Here at the NFF in Canberra it is unusually hot.
Is easter early this year?
11
“Is easter early this year?”
Yep.
10
Keith, I know the question was rhetorical, but Easter is at its earliest this year, well as close as you can get to its earliest.
It’s the Sunday immediately following the first full moon after the Vernal Equinox, for the Southern Hemisphere that is.
Easter can never fall earlier than 20th March, nor later than April 25th.
As a rough guide, it will be the Sunday immediately following the third full moon after Christmas, and as Christmas is a set calendar date, and the moon phases vary, then if the full moon falls prior to Christmas Day, then Easter will be late, and if the full moon is after Christmas Day, then Easter will be early.
Tony.
30
Sorry, forgot to add that as the Vernal Equinox fell on the 20th March this year, (last Sunday) then in cases like that, Easter is the following Sunday, hence today, the 27th March.
Tony.
20
Thanks Tony & Andy and no it wasn’t rhetorical.
🙂
11
Some Christians observe the original form of Passover for the death and resurrection of Jesus tied to the Jewish calendar date of 14th of Nisan, which this year happens to be April 22nd (one month later than usual) due to it being a Jewish “leap” year. Then there are the Eastern Orthodox Christians (Russian, Greek, etc.) who base their calculations on the Julian Calendar system and so their Easter Sunday falls on May 1st this year. Next year it happens to fall on the same day as that followed by the Western Churches – April 16th. This happens on occasion.
20
It should actually coincide with the Jewish Passover.
20
Well said! These faux scientific parasites are particularly nasty when the political economy they have infested acts to reject them.
21
25 Mar: BBC: Richard Westcott: UK car pollution checks dropped five years ago
But a Freedom of Information request for the BBC shows that the spot-check scheme was dropped in 2011.
That left the carmakers to police themselves…
However, the government has not broken any rules.
EU regulations only oblige carmakers to test their own vehicles. Manufacturers hand their results over to the relevant type-approval authority, but it would appear no-one independent sits in the lab, double-checking what’s going on…
After the VW scandal, the UK government actually began car spot-checks again. The BBC was invited to see them in action.
But it’s a one-off programme and it will stop in the spring.
http://www.bbc.com/news/business-35844778
10
UCAR-NCAR May 2007: Study predicts permanent drought in USA Southwest
“Published in the April 9 issue of Science, “Model Projections of an Imminent Transition to a More Arid Climate in Southwestern North America” predicts that climate change will permanently alter the landscape of the Southwest so severely that conditions reminiscent of the Dust Bowl days of the 1930s could become the norm within a few decades.”
25 March, 2016: California’s largest reservoir filling too fast thanks to El Nino, must release more water
. . .
* Texas permanent drought over.
*Australia’s ‘permanent drought broken in 2011:
Ocean temperature made Queensland floods worse: study
“Matthew England, who was not involved in the study, said ocean temperatures off northern Australia were the highest on record at the time of the Queensland floods.”
Peter Hannan tweets: 27 March, 2016: Awash. The #Sydney #coast is still experiencing very warm waters.
2-3 degrees above average
Prepare for 97% global warming floods.
11
Oops.
Missing link:
Ocean temperature made Queensland floods worse: study
http://www.canberratimes.com.au/environment/weather/ocean-temperature-made-queensland-floods-worse–study-20120516-1ypvy.html
00
Peter Hannam can’t compete with BBC though…given the BBC’s audience reach.
the following half-hour program is not a one-off, apparently, but an occasional feature on BBC World News Channel.
Miller packs in every weather event imaginable, all ultimately under the CAGW umbrella. video not available outside UK:
VIDEO: 25 Mar: BBC Weather World
Weather World’s Nick Miller visits York to examine why the historic UK city has been making the headlines and looks back at three months of extreme weather around the globe
http://www.bbc.co.uk/iplayer/episode/b0759g2k/weather-world-25032016
found a rough transcript here, check for the Australian sections, etc:
27/3/206 Weather World
Transcript…
http://subsaga.com/bbc/weather/weather-world/2016/03/25.html
below a couple of my favourite bits from the program/transcript above, especially as both scenes are filmed in virtual whiteouts (if that’s the proper way to describe it).
it’s particularly hilarious when Peter Gibbs enters the Antarctic Met Office room & says “We get a panoramic view of the ice shelf”, yet the camera doesn’t go near the windows because it’s obvious u can’t see a thing outside:
EXCERPTS: Weather extremes forces to make decisions about how protect ourselves, but what if the food we need to survivors under threat? Somebody has thought about that, David Shukman went to see them in the Arctic.
In the punishing cold of an Arctic mountain in the remote Svalbard island is a doorway to what is meant to be the safest place on earth.
Scientists are on their way, approaching through this isolated and hostile to rain. I am with them as they carry a precious cargo of seeds to be kept out of the way of whatever climate change might bring…
***So in these Ramon ‘s mountains, this place is meant to be a safeguard against Apocalypse, an insurance policy for a warming world.
And now from the top of the planet to the bottom, Antarctica.
BBC meteorologist Peter Gibbs worked there in 1980 at a British research station which discovered the hole in the ozone layer. A few months ago, he returned…
Through another one of these big, heavy doors, now we will go upstairs to the best view here. It is the Met Office observation deck.
***We get a panoramic view of the ice shelf. Today it is cloud covered. Finally, in one corner, the machine that discovered the ozone hole…
10
pat mentions this: (my bolding here)
All said from the inside of a nice warm room.
Antarctica, now there’s a place where they need constant reliable 24 hour electricity.
Hmm! Wonder how many solar panels and wind towers they have on that Continent to service the 4000 people in Summer and more importantly, the 1000 people in Winter, when, umm, the Sun don’t shine, and the wind is too strong for ….. ah, Tony, forget it.
Tony.
41
Hmm, I bet there some of you out there reading this who might be thinking that solar panels would be great in Antarctica in Summer, because well, you know, the Sun never sets, so there would be power generation for 24 hours a day.
What you need to realise here is that word ….. insolation. (and no, it’s not that stuff you put in the roof.)
The image at this link shows a typical insolation (and, by extrapolation, power generation) curve for a solar panel array, and here I have purposely chosen a good one, a (relatively) cloud free day in mid Summer, and even this one has a few vertical negative spikes when cloud covers the Sun, even momentarily.
Note how it is similar in nature to a half wave sinusoidal curve.
As the Sun rises in the sky, insolation increases, hence so does power generation. Power Generation is at its peak when the Sun is at its peak, and is lower either side of that.
In Antarctica, at no stage is the Sun even close to directly overhead. Even in the days of 24 hours of sunlight, the Sun still only rolls around the sky just above the horizon.
This equates to early AM/late PM on the curve at the linked image, and as you can see from that, insolation is very low, hence power generation is also very low, and at that height, the best would probably be around 5%, if that at all.
So, expanding out from that, you now get an idea why the same power rated array will generate lower amounts of power the further South (here in Australia) you are.
Hence, total power generation from any solar installation, be it rooftop, or commercial sized power plant, then the further South, the lower the capacity factor is, the less power generation.
Tony.
70
Another example of the tail wagging the dog. Nothing new here, lets remember CC (not ISIS) is the greatest threat to our national security. /s
10
This spike is no more an indication of climate than a rogue wave is an indication of sea state.
10
My prediction is that if the world cools by 2023, Sherwood and Rahmsdorf will still not have the honesty to admit they were wrong.
In all seriousness, they’ll surely blame it on anthropogenic climate change.
20
There was a pause from 2003 to 2009, but RSS Satellite data shows that it’s rising again, http://goo.gl/K3H2YB.
00