It’s the news you’ve been waiting years to hear! Finally we find out the exact details of why the BOM changed two of their best long term sites from cooling trends to warming trends. The massive inexplicable adjustments like these have been discussed on blogs for years. But it was only when Graham Lloyd advised the BOM he would be reporting on this that they finally found time to write three paragraphs on specific stations.
Who knew it would be so hard to get answers. We put in a Senate request for an audit of the BOM datasets in 2011. Ken Stewart, Geoff Sherrington, Des Moore, Bill Johnston, and Jennifer Marohasy have also separately been asking the BOM for details about adjustments on specific BOM sites. (I bet Warwick Hughes has too). The BOM has ignored or circumvented all these, refusing to explain why individual stations were adjusted in detail.
The two provocative articles Lloyd put together last week were Heat is on over weather bureau and Bureau of Meteorology ‘altering climate figures, which I covered here. This is the power of the press at its best. The absence of articles like these, is why I have said the media IS the problem — as long as the media ignore the BOM failure to supply their full methods and reasons the BOM mostly get away with it. It’s an excellent development The Australian is starting to hold the BOM to account. (No sign of curiosity or investigation at the ABC and Fairfax, who are happy to parrot BOM press releases unquestioned like sacred scripts.)
Graham Lloyd sent the BOM a draft of his feature article for The Australian last Tuesday or Wednesday. The BOM finally replied at 5.30pm on Friday night as the last draft was almost ready to print. I’ve copied the whole BOM response here. I explain below why this is a good response for skeptics.
The BOM rely on the usual vague wordy explanation with the unscientific reasoning that homogenization is necessary according to “international literature”. (I guess there is a consensus then, and we all know what that’s worth.) It is the scientific equivalent of saying “we’re experts — trust us”. No one would accept that from a company accountant, why from a scientist?
Here’s the Amberley graph again:
 This is the odd case of Amberley minima laid bare. The people living in Ipswich nearby had to wait 70 years to find out that their mornings in 1941 were really almost 2 degrees C colder than what they were told at the time. The marvel of modern science. It’s amazing the planes didn’t crash more often.
Here’s the BOM explanation:
“Amberley: the major adjustment is to minimum temperatures in 1980. There is very little available documentation for Amberley before the 1990s (possibly, as an RAAF base, earlier documentation may be contained in classified material) and this adjustment was identified through neighbour comparisons. The level of confidence in this adjustment is very high because of the size of the inhomogeneity and the large number of other stations in the region (high network density), which can be used as a reference. The most likely cause is a site move within the RAAF base.”
Translated: So the Amberley thermometer might have secretly moved (and that might be classified) but we are sure it shifted one way or the other. Even though we don’t know where it was before, or how much difference that makes, we can figure out what the thermometers should have been recording in 1941 because of other stations which are hundreds of kilometers away.
Even more strange is that the nearest ACORN station is Brisbane Aero, 50km away, which also shows a long term cooling trend. (Paul Homewood has some good graphs on that.) It seems other stations further away are better at recording Amberley temperatures than thermometers at either Amberley or Brisbane.
But hey, perhaps the runways were extended at Amberley, perhaps the thermometer moved, and perhaps the RAAF forgot to record the change. It happens. But if so, doesn’t that tell us something very important about the quality of the best 100 temperatures stations that made the grade for the ACORN data set? If the Amberley site is so bad it needs this kind of adjustment due to a theoretical and unrecorded site move, does that mean the rest of the hundreds of thermometer sites around the country are even worse?
Alternately, could it be that the Amberley cooling trend is real? If that’s the case, the BOM is actively destroying climate information contained in the data by adjusting both Brisbane and Amberley up. If climate change caused systems, like say, high pressure cells, to shift north or south, then homogenizing data with every station for hundreds of kilometers will blur out this resolution entirely. (No wonder the poor climate models don’t work, they don’t stand a chance.)
More unrecorded station moves in Rutherglen in Victoria
A cooling trend of -0.35C became a warming trend of +1.73C.
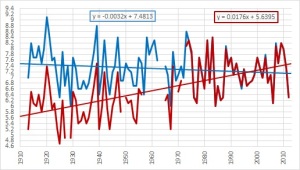
Fig.5: Rutherglen minima
Source: Ken Stewart updated the ACORN raw v Adjusted graphs
The BOM says:
Rutherglen: the major adjustments in minimum temperature data are in 1966 and 1974. Both were detected through comparisons with neighbours. The nature of the change is consistent with the site moving from a location near the main experimental farm buildings (which are on a small hill) to its current location on low-lying flat ground (minimum temperatures are normally higher on slopes than on flat ground or in valley bottoms).
Translated: Special thermometers (which we don’t name) show that this site probably moved, even though that wasn’t recorded. If theoretically it used to be on a small hill near the station (it might have been) then those minimums would suddenly drop and so we have accounted for that.
Jo says: Let’s check out those neighbors (Deniliquin, Wagga Wagga, Sale, Kerang, Cabramurra)
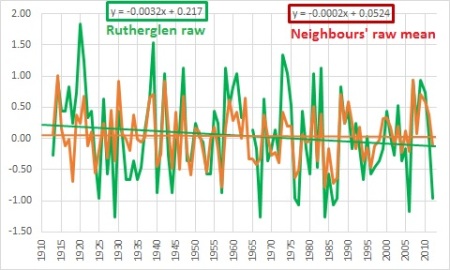
The raw minima of Rutherglen and it’s neighbors before “adjustments”.
Thanks to Ken Stewart
Righto. Spot the warming trend. This is “consistent” with a site that does not need a major warming adjustment.
Perhaps the Rutherglen cooling trend is real? (Does climate change cause colder minima or more frosts in rural Victoria?)
Again, as with Amberley, the message about the ACORN set is the same.
If any readers out there happen to have worked at Amberley, or knows someone who did, or have photos of Amberley which may include the white Stephenson Screen Boxes we’d be very happy to hear from you. Likewise Rutherglen or Bourke. We have some good leads on this already. Keen to hear more.
Who needs thermometers to know the temperature?
The all new world-class ACORN data set is based on imagined site moves. Using this BOM technique — if someone wanted to find a national cooling trend they could spot suspicious step changes “consistent” with unrecorded site moves at other stations. These could be adjusted down with nameless stations anywhere within 500 km (which may or may not show cooling, that doesn’t really matter) . Et Voila. Why do we bother with thermometers? It would be cheaper to record the temperature across Australia from one computer model in Canberra.
Where are those long records at Bourke?
When it comes to Bourke, Jennifer Marohasy’s point was about the good quality historic data the BOM ignores from before 1910. In response, the BOM ignored the point about how they ignore the data.
Bourke: the major adjustments (none of them more than 0.5 degrees Celsius) relate to site moves in 1994 (the instrument was moved from the town to the airport), 1999 (moved within the airport grounds) and 1938 (moved within the town), as well as 1950s inhomogeneities that were detected by neighbour comparisons which, based on station photos before and after, may be related to changes in vegetation (and therefore exposure of the instrument) around the site.
Like the other sites above, an inhomogeneity was apparently detected through site comparisons, and “may” be related to vegetation changes. How do we know vegetation slowly changed some measurements? Other thermometers at other sites (which may be hundreds of kilometers away) got an average of a slightly different trend — luckily the BOM knows that it’s not because vegetation grew at some of those sites, or wind patterns shifted slightly bringing warmer or cooler air.
As Jennifer notes on her site:
Blair Trewin explains that up to 40 neighboring weather stations can be used for detecting inhomogeneities and up to 10 can be used for adjustments. What this means is that temperatures, ever so diligently recorded in the olden days at Bourke by the postmaster, can be change on the basis that it wasn’t so hot at a nearby station that may in fact be many hundreds of kilometres away, even in a different climate zone.
Consider the recorded versus adjusted values for January 1939, Table 1. The recorded values have been changed. And every time the postmaster recorded 40 degrees, Dr Trewin has seen fit to change this value to 39.1 degree Celsius. Why?
Let’s look at that missing 40 years of data. It was recorded with slightly different equipment — a non-standard Stephenson screen or a Glaisher Screen, but both are quality instruments. Hence it would need some adjustment, but it is reasonable and possible to create a long term record. Probably it wouldn’t need as much adjustment to match with modern Stephenson screens as the modern Stephenson screens need to be “adjusted” to match themselves.

The pre treatment shows only the Post Office measures. In the post treatment the early Post Office recordings were dropped, and the airport measurements were added in recent times.
The bottom line
In all three cases above the BOM tacitly admitted Jennifer Marohasy has the calculations of the trends right, and the massive changes from raw to adjusted really happened. In all three cases the weasel words “likely”, “consistent” and “may” are used with speculative undocumented reasons for changes. How are imagined and unrecorded site moves “consistent” with the definitive certainty of headlines like “hottest ever year”? Next time we’re told it’s another warmest September night in East Where-ever, will we hear that it’s a tenth of a degree warmer, but only according to a bunch of homogenized, adjusted thermometers which may have been 300 km away? Will anyone mention that warmer nights were reported in newspapers of the day, but they were discovered to be wrong 70 years later?
Crikey, what if thermometers today are reading too high? Do we need to wait til 2074 to figure out how hot Australia really was in 2014?
PS: Wish Jennifer Marohasy a Happy Birthday today, and if you are on the Sunshine Coast, why not do it in person from 5pm at the Sunshine Beach Surf Club tonight! (Head for the beer garden).


Thanks Jo. As usually, you have very clearly explained complex information.
Its my birthday today. I’m 51. So, if I may ask you readers to indulge me… its become fashionable to ask for ‘offsets’ as birthday presents. For example, that someone buy a goat for a family in Nepal instead of say, giving their aunt the usual type of present.
What would I like… that your readers make a donation to this blog. Please.
Cheers,
And if anyone is about the Sunshine Coast… I’m having a drink with a few friends at the Sunshine Beach Surf Club (outside in the beer garden with a view out over the Pacific) from 5pm today… you’re most welcome to join us.
1024
Happy birthday ! 🙂
And thanks for all the hard work . !!
474
Happy Birthday Jen! Thank you for all your help and excellent work. Thanks to the B. Macfie Family Foundation for supporting you.
And thanks to all the readers who support independent and open science.
I couldn’t do this without you.
604
Now they say the goal posts were moved…
183
Happy birthday, Jennifer … you are aging in splendid fashion 😉
Congratulations on your expose of the BoM, some day I hope that these climate criminals will stand in front of the Law and explain their actions.
In the meantime, a Royal Commission of Enquiry might be a great idea.
422
FINALLY, someone here has touched on the process to detect the perpetrators of the fraud. I believe an RC to be the vehicle in the future or dare I say “the wash”.
Remember, the RC into unions was considered because of the actions of one union and when it finally came into being, more unions are being investigated with a broader terms of reference.
Wouldn’t hold my breath waiting though.
213
Even a Senate inquiry. The cost to our society of errors in this ‘science” certainly does merit an official examination, with people required to give evidence.
193
Spot on Ted.
What now ladys.(and gentlemen)
You’ve done the “easy” bit Jo, now how do we hold them to account.
We here thanks to Jo and co knew what they had done but having the BOM say it is just stunning.
What the BOM has admitted to is nothing less than fraud.
There simply is no scientific justification for what they have done.
Other than to advance the fraud.
So again Jo and Jen, what now.
172
Yes, by all means, get the queen involved in this investigation! Sorry, that’s Yank humor. We don’t understand all this Royal stuff.
52
Happy Birthday Jennifer
172
Why would someone red thumb a simple happy birthday wish @ 5.1?
That is really strange.
Hope you had a great day Jen.
81
1.5!
00
I’ve been pretty sure for a while now that some warmest has a bot or three set up that goes through the posts and red thumbs anything with 5or more green thumbs, based on the idea that anything getting that many positive responses MUST be a ‘Denier’.
00
Happy birthday Jennifer!
Lovely place sunshine beach, not eaten at the surf club but XO just across the road is not a bad place to eat from earlier in the year when we stayed there. We are staying nearby in a couple of months time so will see if the food is still as good.
On the adjustments, Warwick and Ken have covered this with examples of the HD system on Mackay and Darwin in the past where sites showing a cooling trend were warmed by using inland sites that have undergone major UHI changes. These sites were often originally classified as urban, undergone huge growth (as is the want for areas undergoing major changes due to the mining boom) then later changed to rural to adjust the cooling sites accordingly.
Another aspect that had struck me about the BOM statement is the access to raw data. GISS 2.0 (RAW) for Amberley had no problems in 1941-1990 but after 1990 most of the period is missed. By the time GISS 3.1 (adjusted) came around the record was from 1942 (removing that warming spike that is also consistant in other sites like Darwin) and the trend was heavily adjusted now including most of the missing data from 1990-2010. The inconsistancies with the quality of the data and availability seem to be from 1990 not before it to me?
112
Hope that red thumb is a mistake!
If not – who the heck can justify that?
Come on – out yourself and explain the reason for why you’re so friggen STUPID!!!
Cheers,
🙂 🙂 🙂
202
Meta data logged, target acquisition initiated.
71
Hehe Popeye . . . They walk among us.
The red thumbs are an indication that their shields were down and a vulnerable bulkhead has taken some damage.
Feel the force, Popeye . . . feel the force. 😉
Oh, and Happy Birthday Jennifer. 🙂
52
Happy Birthday Jennifer.
“Give ’em hell”
152
Happy Birthday and well done! You share a birthday with a family member with whom we celebrated today…a good day. Lovely for you to be celebrating on the beautiful Sunshine Coast.
92
Happy Birthday, Jennifer.
Thanks for the invite, but I got it a bit late… I’ll try to get to your birthday drinks next year.
61
Happy birthday Jennifer, 51 years old? Really?
61
I hope the Sunhine Beach surf club house is well above sea level.
The sea is rising at an “accelerating rate” you know. I read it in the Sydney Morning Hamas.
90
Happy 39th birthday!
00
The catch with lying.
Is having to remember your tales, who you told what whopper to.
CAGW is confirming a suspicion I have had since I quit my career as a civil servant in 1985.
Government is full, of fools and bandits.
Given the current work ethic and standards of academia, it is inconceivable that todays weather recording personel are doing more accurate work and keeping ever more meticulous records than those taken in the 1930s.
BOM is busted, they have no idea what changes were made or when.
Their response is bureaucratic blather, as they desperately try to cover their butts.
I must say it looks goos on them.
614
You’ve got it in one, John. It’s also about trying to
crawl up toplease bosses and and push agendas in order to keep the money tap flooding on. The same applies to all (or most?) leftist institutions where other peoples money is used to pay for their indulgences. The latest Union Royal Commission is proof of that.It’s time they joined the real world and started actually producing instead of consuming.
292
Exactly, but it has to get a lot worse before the tide turns. The public are still not interested enough in the truth – all they care about is their jobs, sport and other normal pursuits in life. What it will take for the tide to turn is for the people to hurt badly, then and only then will they realise they have been lied to and cheated.
222
I am reminded of a saying from my high school years (in the late 1950s). A clear conscience results from having a bad memory.
202
Where’s the notch gone? Not so big news after all. By the way JM, “you’re” not “your.”
David has been busy writing the papers up. More news to come. PS: thanks for the proof-reading. Fixed. – Jo
537
Ok then, you’re a tosser, happy now luv?
202
Ah.. glad to see your back. !
112
Everyone KNOWS that the freezing and boiling point of water has changed over time.
That’s why all those old thermometers, which so much of our current knowledge of materials and chemistry is built on, were so obviously reading high.
Its a calibration thing…
plus of course all those people reading those old thermometers were 10cm
shortertaller, thus introducing a parallax error which also gave higher readings.482
….so The Griss is armed? WC take note! 🙂
92
Sorry, but the WC has far more experience at “fabricating” information than I do. !
162
It never ceases to amaze me just how apt his initials are.
162
He’s back at it again, but apparently still does not contribute to the discussion at List of scientists opposing the mainstream scientific assessment of global warming. and has been “warned again against repeatdly following my[the poster’s] edits and reverting them with offensive comments. Thats hounding behavior.”
William’s erudite response:
Scroll to bottom of page.
21
Well done Jo, you’ve summed it up very well.
262
You to, Ken.. Your efforts helped set all this up.
You are Ken from Ken’s Kingdom, aren’t you?
If so, I’ve been using graphs from your pages for a long time. THANKS.
272
first line…. “too”
of course.
82
Yep, the same! Thanks!
102
Jennifer M has done excellent work in persuading the Oz to publish the fact of these “adjustments”
Now, will the Oz follow up by publishing the BOM’s excuses ?
252
Well I hope that they do, with a bit of commentary on the lack of substance therein.
I would love to see what James Delingpole might do with that.
112
How does a (hypothetical)move change a trend? A single, clearly visible sharp discontiuity at most, but not a trend. The trend direction should not change with location, here from down to up. How do they apply this adjustment on the basis that they have no other explanation, so it must have moved? You are left trying to prove it didn’t move when they should be proving that it did.
The basic rule of science is not to adjust the data to fit a theory. All these adjustments seem to precisely of the type that the station was not recording what was expected, so the station must be wrong. That is not anyone’s idea of science. Also the idea that vegetation affects temperature and vegetation changed. Isn’t that the point? Why adjust the measurements when that is precisely what is supposed to be measured? A greener, wetter Australia has lower temperatures.
Are these responses of the very political Yes Minister type that we have answered all your questions fully, so go away.
Still anyone would have other questions.
Why didn’t they show the raw data anyway?
Why did it have to be homogenized?
Who decided the data had to be adjusted?
Did the original Australian raw data show temperatures going down?
Is this why they needed adjustment?
Did our Australian data make such a mess of the Global Temperature that there were requests from the IPCC or overseas bodies to revise our data?
Why should we have to ask such questions? Just show us the graph without homogenization. It is just temperature, the cheapest simplest thing in the
world to record after length.
472
Well, if you are just going to refer to another site somewhere else to adjust the Amberley data, why even bother having a site at Amberley?
262
You can add to that list of questions:
When will they have to adjust the data of today to keep fudging the trend?
142
What utter BS!
Tony for Oz. Do you or any of the thousands and thousands of servicemen/women who have served or visited RAAF Amberly recall where the BOM weather station was before 1990 and whether it moved?
BOM Climate Division condemns themselves much more than Graham Lloyd did. I did not think on the weekend that the articles in the Australian would result in anything, but if the BOM keeps this up we may get some action. High time that Dr David Jones was asked some questions on oath.
333
If you think that’s “BS” – ie, if you think there is lots of available documentation – then please link to it.
554
I meant a thumbs down…finger slipped on ‘phone. 🙁
153
You have obviously not read what Jennifer did, WC. That is the documentation, or is that too low brow for you.
Or do you want it in editable Wiki format?
BOM has to justify itself to the Australian people; those people do NOT have to justify themselves to you.
342
The bigger question is: why does it take others to do the work that the BOM (and their counterparts in other countries) should be doing themselves?
Billions of taxpayer funds (not to mention our collective future) are riding on this; one would hope a fair portion of said funds would be directed towards making sure there’s a proper temperature record.
432
The BOM is doing all the hard work. Instead of doing an unthinking presentation of raw data, they’re doing the homogenisation that’s required to produce a useable temperature record.
All you lot have got is a trend line fitted through the before and after series. You haven’t even bothered with a basic analysis of where the difference is, whether it looks plausible or not, etc etc. If you want to be taken seriously you have to do more than just whinge on the sidelines.
657
That’s exactly what Jennifer did, WC. Didn’t you read her article?
402
Err, no. I’ve read the posts. All that’s been done is draw a couple of trend lines. There’s no real analysis.
438
Even by your low standards Bill, that’s weak. No analysis? BOM has been shown that they have:
1 Adjusted for climatic reasons; a basic no-no as Hansen has declared.
2 Adjusted for non-climatic reasons such as site move when such is not supported by meta-data.
You can’t be more dubious then that and as well they accept the adjustment figures shown by Jennifer and Jo and the rest of the team.
In short BOM accepts the criticism but has not explained why they did the adjustments which are the subject of the criticism.
But then you knew that and are just trolling.
292
“The BOM is doing all the hard work. Instead of doing an unthinking presentation of raw data, they’re doing the homogenisation that’s required to produce a useable temperature record.”
Justify your opinion.
322
If you are ever offered the opportunity to look at the physical, hand written, temperature readings, you should take up that offer. The ones that I have seen are meticulously written, in a copperplate hand. They are also usually written in pencil because the recording was done at the device, and it could have been raining, which would have caused ink to run.
People who would take so much pride in their work, and the excellence of presentation, were unlikely to have got the reading wrong.
Arbitrarily changing those measurements, for the artificial concept of homogenisation (which literally means removing all difference), is an act of unthinking vandalism.
352
“is an act of unthinking vandalism.”
And a total mark of disrespect as well.
242
Just like you did all that work adjusting Wikipedia…
BOM have made the climate record totally meaningless, untrustworthy and unusable…
… just like any page you messed with on Wiki.
342
Advising Australians how to run their busness.
Do you have any specialist knowledge about what Australian BOM should or should not do? Have you ever been employed by BOM? – if so when.
Don’t you not think it is just a bit high minded of you to say to Australians “If you want to be taken seriously you have to do more than just whinge on the sidelines.” when it is their concern, not yours?
Or do you usually insult people so?
204
billy boy, you are about two weeks too late to the party. The only whinging we hear, is YOURS.
212
No, the BOM is not doing the “hard work”. The “hard work” would be to INVESTIGATE what is PERCEIVED to be an anomaly, and to TRY to determine WHY it is. It is not to willy nilly adjust it because you do not LIKE it.
SCIENCE 101 (forget alarmist or skeptic) says you do NOT throw out raw data. And you do NOT adjust it for no reason. Yet that is EXACTLY what they did! I am sure they are your greatest wet dream (undocumented changes to suit a whim), but to call it science is at best a lie and at worst outright fraud and malfeasance.
Something you and Mann are both intimately familiar with.
192
> do NOT throw out raw data
So you’re happy, because the BOM haven’t.
> you do NOT adjust it for no reason
And they haven’t. They’ve adjusted it for a good reason: homogenisation. That doesn’t produce the result you want, so you’re up in arms about it.
> outright fraud and malfeasance
You people are funny. You’re turning a minor homogenisation issue into some mighty scandal. Since it isn’t one, it will all collapse like a pyramid scheme, at which point you’ll all quietly forget about it.
534
No Stoat. You cannot rewrite history here – you need to go off to your Wiki playground for that. As Goddard has pointed out “homogenisation” is responsible for most of the “global warming” in the 20c. Keep taking the meds..
192
Don’t worry, Willie, I’m sure the Truth will be available at Wikipedia. With your ‘analysis’.
130
Nothing short of an independant audit will suffice.
Why is the BOM refusing to submit their “adjustments” to further scrutiny?
If buts and maybes is not scientific.
It’s nothing more than crystal ball gazing.
All their “adjustments” enhance the fraud.
America has just recently started to ask questions of their keeper of historical records.
And they to are not happy with the limited answers they are getting.
Again, their “adjustments” are enhancing the fraud.
102
You mean like you did here down the bottom of your Wiki talk page?
Well done you . . .
51
Amazing work, well done and thanks to all involved.
Word is getting around.
http://dailycaller.com/2014/08/25/australia-government-climate-office-accused-of-manipulating-temperature-data/
272
then we need to stop funding BOM, CSIRO and every “university” for at least 5 years.
slimate “scientists” have crapped on people for long enough and it is about time they were relegated to the Aegean Stables to shovel proper s**t.
And if neither Liberal nor Labor cannot understand the fury in the electorate that they are supposed to represent then I am all for Micro Parties and be damned to them both.
A pox upon them.
272
NoFixedAddress
” need to stop funding BOM, CSIRO and every “university” for at least 5 years.”
Why not cut the loses and just computer model BOM, CSIRO and every “university” by renting the spare time the super
weatherclimate computers.After all mate, BOM CSIRO are just glorified government outlets – too easy to model as they produce nothing! As for the “universities”, easy as – have the output of one virtually “university” go to another, on to another virtual establishment, until all the virtual peer-reviewing is done through all virtual “universities”, then virtually publish online.
See it’s just like now – except no staff to pay for.
112
Yup, although Climate Science™ is a rather unique animal.
‘Back in the day’ I was dealing with a scientist from CSIRO . . attempting to sell him a computer system.
He was the guy (can’t remember his name now) working on the hologram for the new (at the time) $5 plastic notes that were being developed. This was all driven by the vast amount of counterfeit US$ around Europe at the time . . estimated to be an astonishing 25% . . or something like that.
Hologram security was in it’s infancy and this CSIRO guy was the only one able to produce one from a photograph. All others were only of geometric shapes and considered limited.
This guy was a middle aged lanky gentlemen with very poor dress sense and practically nil ability when it came to obtaining funding for a supposedly ground breaking and crucial enabling technology deemed a game changer with respect to it’s place within the plastic note technology. Some may recall this technology was later sold to Malaysia (if I recall) and more recently mentioned in relation to international press coverage of a Oz press-barred scandal.
Anyway, this guy would take a floppy disk to London to have these holograms printed out on the only suitable machine available. I recall it was similar tech. to that which is used to print microprocessors and the like. Anyway, the files he carried on a single floppy disk took three days to print on a DEC-Vax of that era.
I’ve always thought of him as the quintessential scientist – a boffin, who was earning not much above the average wage at the time and getting bugger all support.
His science looked nothing like Climate Science™.
91
Missing long records? I believe railway stations were obliged to keep accurate data in the ‘old days’. Not sure about later times. As a major centre,Bourke may be worth a try. (?)
102
I don’t know that those record would be all that expansive 😉
82
I remember that some churches used to collect temperature records, also agricultural schools maybe.
Had a quick look but nothing, I’ll try a bit harder later on.
72
I just found an interesting page on Warwick Hughes’ blog regarding early Stevenson Screens in Australia http://www.warwickhughes.com/blog/?p=604 the comments give great links also, apologies if this link is already well known.
52
If there are any archived records, the relevant ‘authorities’ would probably need to be contacted.
10
Post offices mostly, I thought.
31
The BOM’s responses are vague and far from compelling.
Congratulations to Jennifer, Graham and Jo for their tenacity in pursuing their reasonable and valid questions. That no other major MSM outlet can be bothered demonstrates the closed mind attitudes that prevail therein.
The Amberley site has a significantly different geographical profile to some other sites within 200km that were mentioned in Jo’s earlier post. For example, Cape Moreton is a rather remote prominence that sits almost surrounded by open Pacific ocean, north-east of Brisbane. I observe reported wind directions and speeds in SEQ on a frequent basis. It is not unusual for Cape Moreton to show vastly different wind directions and speeds to other SE Qld sites, not to mention significantly different temperatures.
Happy birthday Jennifer and thanks for your tireless pursuit of scientific facts.
182
I don’t understand from where BoM got the idea homogeneity in weather, necessary to justify looking for inhomogeneities.
Perhaps it’s a subconscious extension of the falsified premise that climate was unchanging before we allegedly “interfered”.
Bu I think it’s more a matter of their data analyses being unable to tolerate discontinuous data; so they adjust the data to fit the algorithms. That; if not exactly fraudulent; is certainly incompetent.
Changes in the surrounding of weather stations and their instrumentation impose “step” changes that are clearly visible in the temperature record. BoM receives a lot of money from taxpayers and they should have concentrated on developing techniques that can use raw, discontinuous data to produce plausible forecasts of superior quality.
What a waste to have (potentially) great minds shrunken by mantra.
212
Dang it… posted when I meant to preview. 🙁
The stepwise changes in temperature need to be correlated with physical events of record. My observations of data from a nearby agricultural research station are an example of identifying plausible factors that may have caused “step-wise” changes; even if the step too place over a period of months to a couple of years.
Similar steps whould be visible in the raw data at other stations such as Amberley where runways, apron, taxiways, buildings and the type of air traffic are liable to change over periods of up to 5 years. If are no such stepwise changes in the raw data, then it’s probably been cooked. (“Homogenised”; because that sounds more “technical” and is thus more likely to go without further question.)
92
Homogenise is bad enough.
But inhomogeneity is just too much ink.
Once again, changing the language to give a false impression of achievement.
42
Yes,
The proper English word is ‘heterogeneity.’
‘Inhomogeneity’ is bastard English.
42
Don’t you know that only really intelligent people use long words and long sentences with multiple subjects? 😉
20
SACK THE LOT.
SHUT IT DOWN.
SALT THE EARTH.
252
If BOM was a scientific organization, it would release information on all adjustments and the justifications for them without the need for the threat of bad publicity.
282
Happy Birthday Jennfier!
Congrats to all the people who have been pursuing the BoM for years. Jo, Jen, Ken et al. Well Done.
Another Nail in the coffin of the AGW scam!
142
Jo
As a long term resident in SEQ and having worked extensively in the Fassifern Valley with farmers, I can tell you with absolute certainty that Amberley minimums are always well below Brisbane and sometimes below Toowoomba which is 1000M above Amberley. There are only a few locations in SEQ that provide a relevant comparison with Amberley. On some occasions Amberley is as cold as Stanthorpe which speaks volumes for just how cold it can get at Amberley.
Tonight the Amberley minimum is seven degrees with Brisbane at twelve and Toowoomba at eight degrees. Gatton and Forest Hill are expecting the same minimum of seven degrees tonight but more often than not Amberley minimums are below them as well.
It beggars belief that Amberley temperature records have been adjusted at all. For mine, they would be up there with the most accurate records around.
342
The cynical might suggest that this is EXACTLY why they needed to be adjusted.
213
Peter
I went to IGS. Even at the top of that hill it was bloody cold in winter.
82
Remember playing football on IGS frosty oval in the 60’s. Chasing up a few mates with fathers in air force to see if we can find info on temperature recording. there are third generation farmers in Lockyer and Fassifern valleys who will have amateur records as well. Now is the time to nail the BOM to the wall.
122
OMG! Sed quis custodiet ipsos custodies?
Translation … Who will guard the goddamn guardians?
162
De omnibus dubitandum est ( not necessarily Kiekegaard)
00
Happy birthday Jennifer, and many more!
Jo, you yourself have noted that not all professions (such as geologists and engineers)have become as corrupt and dishonest and the global warming crowd and many of the social sciences.
” The marvel of modern science. It’s amazing the planes didn’t crash more often.” Well planes are not built by scientists but by engineers and skilled craftsmen based on centuries of scientific discoveries and developments by scientists in mathematics, physics, materials science, etc. and engineers of almost every kind.
Jo, thanks for all you do, but I thought that comment might be hurtful to those making the planes that fly safely almost all the time.
142
Leonard
And when all the designing/modelling/engineering is done there are the test pilots between all that (with iterations) and the passengers
62
Good point Another Ian. And I also left out air traffic controllers, honest weather forecasters, and yes the taxpayers and flying public.
10
It’s a pity these statisticians don’t understand how the climate works.
I wonder what the NW of WA/NT looks like in the figures?, as it is known that in many places it is getting wetter there due to shifting subtropical climate zones, along with rainfall patterns. The same could be true of Bourke in NW NSW. (?)
This might mean, just like it appears true for Darwin, that some places are actually cooling, within a more regional warming trend. Homogenising these upwards would make any warming trend unjustifiably larger (but don’t go giving the BOM any more ideas).
72
I think the base case has been made for a judicial enquiry into this. Judges do not like fiddling with evidence, not one little bit. This sort of evidence tampering puts people in gaol for decades and the legal system tends to give it pretty short shrift.
An enquiry here will put the issue of data fiddling well and truly on the agenda in the US and the UK. And then it will be on.
152
Happy birthday Jennifer! May you have many more of them.
On other news –
Al Gore took a trip to his mates house.
His mate, Mephistopheles B. Belial was both appalled but admiring of big Al’s power, his only comment to reporters was –
“Struth, …Hell frozen over!”
🙂
102
When climate zones shift around some places within a single geographical region become less cloudy and warmer whilst others become more cloudy and cooler.
There might still be an underlying background trend overall from warmer to cooler or cooler to warmer but if one applies a homogenisation process becausae one erroneously thinks that all locations should have the same sign of response to shifting climate zones then the underlying background trend would be lost, obscured or completely reversed.
That is what has happened here.
Those apparently contradictory changes in trend from one place to another within a single region were actually valuable diagnostic information as to how the climate zones overhead were shifting and having different effects in different locations.
They have destroyed that diagnostic information through ignorance.
There should be some penalty for such dozy and unprofessional acticity.
293
A couple of typos in there due to rushing but not affecting the gist of it.
102
Have they destroyed the primary records? Surely not. No real scientist would ever do that.
I would expect that they are just hiding them. It would not be possible to destroy them and not get caught out.
52
“They have destroyed that diagnostic information through ignorance.”
And arrogance. = “agnorance.”
31
[…] here: http://joannenova.com.au/2014/08/bom-finally-explains-cooling-changed-to-warming-trends-because-stat… Rate this:Share this:GoogleTwitterFacebookStumbleUponRedditEmailLike this:Like Loading… August […]
12
Why don’t they simply publish the 1910 – 2014 temperature graph (say) using the raw data with error bars or gradation?
202
There were a series of posts on Dr Judith Curry’s blog that explained the reasons for temperature adjustments.
http://judithcurry.com/2014/07/07/understanding-adjustments-to-temperature-data/
In my opinion, adjustments. such as Time of Day (TOD) that were one-off, seem reasonable.
Where I have a problem is with “homogenization”. This process is used to interpolate temperature for grid points that do not or did not have weather stations.
The US data for the distant past changes frequently, something that is not allowed in any other data provided by governments.
I do not believe there is any justification at all for continuous adjustment of old weather data. If government agencies want to produce a gridded product for special purposes, let them do so.
However, agencies like BOM should present non-homogenized data as the official data. Any adjustment of the original data should be provided in the “metadata” for a site and freely available to the public.
282
DOH!
I don’t think the location of the weather station would be top secret. I am sure that the BOM could make a phone call.
A challenge to readers who have a little time on their hands – Call the Amberly base and ask where the weather station is located.
152
I have just spent a bit of time on Google Earth trying to identify the BOM Amberley station. BOM gives the co-ordinates -27.63, 152.71. That places a pin just east of the 33 runway. Unfortunately there is no Stevenson screen visible right there. It is likely located in the open, near a building. Maybe we can find it with a crowd effort.
41
Have a look at Google Earth, to the East of the C17 being towed on runway 33 / 15.
There is a small fenced area and there looks like a Stevenson Screen just offset from centre.
The shadows are a give away.
What do you guys think ?
60
Further, does anyone know the sizes of a Stevenson Screen ?
The box I see is between 24 and 30 inches square on the top.
Measured with the Google Earth ruler.
30
Maybe the pin I placed on my Google Earth was right on top of the Stevenson screen and covered it up. A Stevenson screen is a white wooden box about 30 inches on each side, with slatted louveres. It is usually placed on pole about 4ft high.
20
Yep that’s it, for sure. 🙂
Furthermore.. that looks like a memorial area just outside the fenced, which would have been put there after WWII.
If it is, then there was NO SITE MOVE around 1980.
31
How is it decided whether the Amberley minima needed increasing or the comparison stations needed theirs decreasing?
This sounds like the climate equivalent of Gerrymandering where those in power can manipulate the data to achieve the outcome they want.
Suppose you have a line of stations and all the odd numbers are high and the even numbers low. You could decide on a homogenization scheme where you compare 2 with 1 and 3 and see it is low – so you round it up. Then you look at 3, 4 and 5 decide 4 is low then round it up etc etc. It all sounds a bit subjective with plenty of room for confirmation bias.
152
“because stations “might” have moved!”
Perhaps they should employ some people who can actually be bothered to find out if they have been moved.
252
If the station had moved only on one occasion, then the inhomogeneity would be observable as a step change. However, the adjustment applied has the effect of refitting the annual average minimum temperature to a linear trend with a distinctly different time gradient.
122
Jo,
Put this up at Jen’s as well.
Our local weather reporter gave me a copy of the BOM official history to read. Which happens to mention Stephenson screens pre 1910.
And particularly that the bloke in charge in South Australia was right up with them.
As Darwin was in his bailiwick I’d be very sceptical of all the Darwin no screen adjusting.
142
Err, can nobody be found at those station who can remember if the thermometer locations were changed? Its not that long ago.
Has anyone written to the Aircrew Association to find out?
http://www.airmanaircrew.com
52
“Why do we bother with thermometers? It would be cheaper to record the temperature across Australia from one computer model in Canberra.”
Or just monitor the BOM’s fevered brow.
133
How about asking the NZ’s BOM to weigh in with their opinion on whether these shenanigans represent Best Practice? I’m sure they’d like to return the favor the Aussies did to them a few years back.
73
Here’s an oldie but goodie about another site, from Willis Eschenbach:
http://wattsupwiththat.com/2009/12/08/the-smoking-gun-at-darwin-zero/
And its follow-up:
http://wattsupwiththat.com/2009/12/20/darwin-zero-before-and-after/
73
That’s not a goodie, its as broken as the last time you pushed it. http://moyhu.blogspot.co.uk/2009/12/darwin-and-ghcn-adjustments-willis.html
321
Good one! How many peer reviews on that blog WC?
Or is it your post that is “broken”?
00
The next move by contrarians should be to find stations that should have been corrected DOWN (but weren’t) based on what their neighbors were recording. BOM’s inability to plausibly explain its inaction in those situations would checkmate them. It would expose its double standard.
202
That’s a good idea. Actually do some real work instead of just whinging. Let us know when you’ve got something.
> It would expose its double standard
But only if they actually had. At the moment, you’re still in the realm of wishful thinking.
425
So you are the amateur that comrade Karoly is referring to, Willie.
Perhaps you should drop the drip a line and inform him that if he can’t get his stats right and has to withdraw as a result, he should think a little more before he seeks to tip a bucket in future.
He’s demonstrated his incompetence – and so have you.
134
WC
You are whinging,
IMO because your hypothesis is heading for the big cylindrical file and then the furnace. The CAGW hypothesis is dead – nearly 20 years a corpse, it is time for a wake.
53
I said it once before on this site – they make stuff up to fill in the gaps and they call it homogenisation. If there is no data then there is no data. You just don’t make it up to fill in the gaps – that’s not science – that’s fraud! I could see some governments or accountants going to jail for stuff like that. Imagine of doctors had incomplete data for a diagnosis so they run what data they did have in a computer homogenisation program – suddenly you have an incurable cancer and will be dead in two days time – just like Global Warming is fighting for life right now – sorry but your temperature is running a little hot…
84
More aptly; you check into hospital with a mild “temperature”; they watch your temperature rise and say that your condition is improving as you (according to backward extrapolation) must’ve been stone-cold dead a week before checking in.
71
Well done Jo and you other researchers checking on the BOM and CSIRO climate hysteria nonsense and adjusted temperature profiles which appear to have little scientific basis in actuality. It appears that the CACC crowd are getting really desparate to justify their untenable position that they will destroy clear historical evidence of any significant cooling locally or regionally.
I have always suspected any homogenisation process such as BOM demonstrates has a political bias agenda, thus to now have Albany displace Marble Bar etc with the hottest record temp ever in Aust -is simply a nonsense!
Please continue the good work on analyzing and publishing the corrupt data that BOM is producing, and soon enough we will have enough evidence to convince any sane unbiased person that an official independent public enquiry is necessary to prevent further fraudulent activity by this pernicious PS organisation.
73
Did anyone at the BOM expect that there would be any scrutiny or were they comfortably hiding behind the idea that would check the raw data and if they were discovered, they could use the argument from authority or just blind people with long words or pretend they were just following accepted procedure or just not answer the question. It has already started with the idea that critics are just amateurs.
The real question is why they bothered to homogenize at all.
My strong suspicion is that Australia is a huge land mass, a continent with great data and very important in the calculation of temperature record of the planet. Sure 80% of people live north of the equator, but possibly the area from 22 to 60 South is critical and the most variable, neither tropical or arctic. In that band, Australia dominates half the planet and may be the best source of information for the adjacent oceans. As such, there is every reason to think that the BOM may have been asked to revise their figures as they did not fit the narrative of AGW.
Imagine for a second that if the raw BOM data is used, the whole hockey stick is exploded. Remember that the Southern Hemisphere is a lot colder than the North, presumably because it is mostly water. Now you would have a motivation to alter Australia records to protec the 300Bn+ spent each year on AGW solutions. That is plenty of Green incentive for a bid of homogenization. For example, from the excellent first hand comments in this blog alone, it seems Amberley is an exceptionally cold place, year round. So its data had to go, even if there was nothing wrong with the data! It simply would not fit the narrative and it would bring the averages down. So homogenize. Effectively just ignore the Amberly data. This is almost conclusive evidence that there is intent in this, not science.
This could be a global scandal on the level of the East Anglia emails, people quietly fiddling results to please others in their industry, critical to people who want to study and work overseas at a high level. Pressure can be subtle.
At what point does peer review become peer pressure when jobs are at stake? Are we seeing another East Anglia scandal? Is it connected? Are emails being deleted and records destroyed right now? Some early retirement?
113
TdeF @ # 38
What very, very few people realise is that the combined Australian and NZ weather and climate data account for ONE QUARTER of the total global surface in modelling computations where the land temperature data is used.
So our data has an undue importance within the global climate network particularly as we together with NZ also have by far, or did have by far the most accurate historical weather and climate records for the entire southern Hemisphere which have been fed into the Global Historical Climate Network, the GHCN.
The GHCN is rarely discussed as the USHCN or the latest variations of it has predominated in just about all discussions across the climate blogdom.
To see what I am posting on, just get a global type map point the tilt away from you and have a look at the amount of land masses in that bottom quarter of the globe below the equator and stretching from around mid indian Ocean at about the 75 degrees East Longitude then east across OZ and NZ to the mid South Pacific at around Longitude 140 degrees West, a coverage of the southern almost land mass free regions except for Oz and NZ, of the planet that spans some 145 degrees of Longitude south of the equator.
Hence our data is vital to climate science research. a point that is almost completely lost in the climate debate and discussions.
And a point that if our data from this very limited in area Southern quadrant land mass is corrupted or altered or has been made to go missing, it has a downstream flow on effect and an impact on the accuracy of any climate research far beyond the impact from the similar and increasingly revealed corruptions of NH data with its greater land area covered NH stations.
72
Wow! I had guessed a high percentage on general principle, but 25%! It may explain everything. An adjustment here, an omission there, low values ignored or substituted, whole datasets to hard to adjust for some minor difference (it is only temperature). I had not dreamed of 25% of the world temperature. We have our explanation. Besides, who would check such boring, simple data? Who would expect any sort of systematic adjustment of simple temperatures? After all, it was all for the greater good of saving the planet and getting the attention needed to do so. No one will notice and everyone will benefit.
71
If you can judge the temperature of a spot by looking at a thermomemter a hundred kilometers away, then you only need one thermomenter on the planet. Because at the moment, every thermometer is within 100ks of another.
Climate scientists know this. They also understand UHI, time of observation issues, vegetation growth, land usage etc.
They know that for decades they have been pumping out sh!te, so they may as well get the sh!te to tell their story. Cant blame them really, but at least they should have the integrity to admit that arey do not really have the first clue about global temperatures or trends
72
GISS uses no data from stations north of about 85 degrees I think it is.[ Could be only 80 degrees north ] Consequently they use stations up to 1500kms away in a couple of cases to “homogenise” their data across the Northern polar regions and to get those nice hot red colours of rapidly rising temperatures right across the northern polar regions you see in those highly coloured GISS temperature maps.
40
Once you go much higher than the counter staff of the Commonwealth Public Service (who I have found to be friendly and helpful)I’ve found the higher level managers etc to be a pack of lying corrupt bastards.
I once worked for the BoM. I’ve seen the lies happening. Back in the mid 70s the oil and gas exploration on the north west shelf got going. The WA BoM office was asked if they could provide sea state and swell forecasts for the exploration rigs. The RD said” no problem” and they added a form to the stack the duty forecaster had to fill in. No data, no sensors and no training. Great.
The Civil Aviation Safety Authority and its predecessors doesn’t bear thinking about. They aren’t any worse than the rest of the public service is the good news. They aren’t any better is the bad.
113
Again as I keep saying…All hand waving until Federal Police intervene and SEIZE/IMPOUND ALL BOM records for investigation of FRAUD. The culprits doing this need to account. (most likely its a very FEW people in the organization)
73
Of course the ONLY reason we are seeing this article is because the powers to be (da BOSS that pays their wages,in this case) are in fact non-believers and some sort of pressure can be applied (which was not the case under the labour gov)
72
Australia’s clowns of climate seen across the world. Receiving the ridicule that they deserve.
Previously reported at WUWT as Newest scam: donate money to help alleviate the fears of ‘scared scientists’
112
You appear to have changed the format of the site and the text is so small its almost not readable looks like 4 point or less ???????
02
It seems the BOM is using the automatic adjustment technique, similar to what NCDC uses. It looks for breakpoints using neighbour comparisons, and adjusts accordingly, without knowing whether or not an actual site change happened at that time or not.
Here is why I believe this technique is flawed, and will produce spurious warming:
http://wattsupwiththat.com/2014/06/10/why-automatic-temperature-adjustments-dont-work/
71
Ha! Someone has just gone through and put a dislike against nearly every comment up to the 4th last. Please ignore this. Must be a speed reader. Missed one though. Careless clicking.
92
Nah! Just a sad piece of humanity who seemingly is of na intellect of such a low calibre that he / she can only make their mark when signing something so they are getting some practice in by clicking those so inviting red thumbs.
So allow them that small pleasure of carefully clicking on to that red thumb which seems to give them so much satisfaction. After all it seems obvious that they are not capable of making a statement at any level here let alone a profound statement in any situation.
Probably one of Lewendowsky’s current most interesting psychology study subjects.
Or maybe those low brow, acting under instructions, SkS’s Cook’s assessors who assessed some 200 papers over a couple of hours while riding his exercise bike, which gave that 97% of scientists believe in a global warming result.
73
Blimey! They’re breeding !
82
Now could it be a particularly touchy blogger who managed to rack up an amazing 84 dislikes in only a few comments? This is some sort of grumpy troll’s vengeance, to dislike everyone else’s comments. So touchy and childish.
62
I think you’ll find it’s a small reddish-brown animal of the genus Mustelidae, actually.
62
Thanks. Hard to tell stoats from weasels without a Latin name.
72
happy birthday jennifer.
congratulations to jo, jen, graham lloyd & everyone who has pursued the facts for so long. surely we are approaching the endgame of CAGW. BOM are a disgrace.
no doubt ABC’s Four Corners is at this moment preparing a program exposing all the charlatans involved in the CAGW scam. can’t wait to see it. it might even restore my faith in Auntie.
93
It starts right at the top and here is one well known example from the Climate Gate mails where the principal BOM person involved is still a full on, ideologically motivated warmunist I understand.
http://www.ecowho.com/foia.php?search=david+jones
[ BMRC = BOM Research Centre ]
Mon, 13 Jun 2005 11:30:54 pm
2687.txt-from: Phil Jones
2687.txt-subject: Re: Distortion of the work of CRU by Geologist Bob Carter in the
2687.txt:to: “David Jones”
2687.txt-
2687.txt- David,
2687.txt- Regards,
2687.txt- David
2687.txt: Dr David Jones
2687.txt- Head of Climate Analysis Section
2687.txt- National Climate Centre
—
Tue, 19 Jun 2007 11:21:57 am
1182255717.txt- 1. Think I’ve managed to persuade UEA to ignore all further FOIA
1182255717.txt- requests if the people have anything to do with Climate Audit.
1182255717.txt: 2. Had an email from David Jones of BMRC, Melbourne. He said
1182255717.txt- they are ignoring anybody who has dealings with CA, as there are
1182255717.txt- threads on it about Australian sites.
—
Tue, 19 Jun 2007 12:02:34 pm
2143.txt- the country (even if Russ doesn’t agree), so could mention Lucie re
2143.txt- Canada. There are apparently some Australian pictures as well on the
2143.txt: CA website. I had an email from David Jones of BMRC, saying they will
2143.txt- be ignoring anything on CA and anything from Warwick Hughes.
2143.txt- The other aspect to point out is that the SSTs are warming around most coasts,
—
Mon, 16 Jul 2007 1:34:24 pm
3698.txt:cc: Scott D Woodruff , [email protected], Gil Compo , Phil Jones , Masao Kanamitsu , Tara Ansell , David Jones , Philip Woodworth
3698.txt-date: Mon, 16 Jul 2007 08:34:24 -0600
3698.txt-from: Gil Compo
—
Thu, 6 Sep 2007 9:28:03 pm
0601.txt-cc: “Shoni Dawkins”
0601.txt-date: Fri, 7 Sep 2007 08:28:03 +100 ???
0601.txt:from: “David Jones”
0601.txt-subject: RE: African stations used in HadCRU global data set
0601.txt-to: “Phil Jones”
0601.txt- From: Phil Jones [[1]mailto:[email protected]]
0601.txt- Sent: Thu 9/6/2007 11:31 PM
0601.txt: To: David Jones
0601.txt- Cc: Shoni Dawkins
0601.txt- Subject: Re: African stations used in HadCRU global data set [SEC=UNCLASSIFIED]
0601.txt- >Hello Phil,
0601.txt- >
0601.txt: >David Jones is currently in a debate with a few sceptics and is
0601.txt- >trying to source a list of the African stations that CRU uses in its
0601.txt- >HadCRU global temperature dataset.
________________
David Jones was moved on a few years ago from at least two sites, one a forum where it got fairly heated and another more skeptical climate blog site, due to his his rigid alarmist attitude and outright denigration of anybody who did not believe as he did despite supposedly being a scientist with scientific training [ which no longer seems to count for much these days in at least climate science plus some other science disciplines as well.] and therefore one would have expected him to be somewhat more skeptical. a listener for potential future problems and questioning of BOM’s own science claims even despite his exalted position as head of the Climate Analysis Section.
He never accepted in any way any suggestions that there might be alternative explanations for the warming or their science might be a subject to correction. Not that dissimilar in many ways to what we have seen with Connolley and now maybe a parallel situation is evolving similar to that of Connolley with what could eventually be judged [ literally ]. as the possible fraudulent alteration of historical as well as current climate and weather data by the BOM under the guidance of their senior personnel whose attitudinal history is on open public record as in the instance above.
182
It could/should all be done algorithmically. The tests in the algorithm would not differentiate possible cool moves from warm moves, it looks for both with equal greed. If probability of move, based on neighbor comparison, above threshold then do adjustment.
Document it and be transparent.
43
No, no, no. I have already shown re Bourke how in Jan 1939 Bourke temps were downgraded and Cobar, Walgett and Tibooburra temps were increased so all of them were highermeans than Bourke. What a load of bull.
61
Someone at BOM (probably 1 or 2 Highest supervising staff) Instructed the technitian staff to do those changes. They are the ones responsible (probably acting under “orders of the IPCC warmists “BEST Practices”) these people should be removed immediately from positions of authority within BOM and replaced with honest scientist/meteorologists
52
Okay, so the temperature trend over time changed from declining temperature to increasing. I notice the change didn’t occur all at once, as one would expect. Does the BOM also claim that the station moved gradually to its new location?
41
From the BOM’s independent review panel of the ACORN dataset:
“Before public release of the ACORN-SAT dataset
the Bureau should determine and document
the reasons why the new data-set shows a lower
average temperature in the period prior to 1940
than is shown by data derived from the whole
network, and by previous international analyses
of Australian temperature data.”
Obvious answer: the new data-set reflects the inherent bias of both the researchers and the methodology built into the system they have adopted, on two counts. Not only does it increase the warming in relation to ‘whole network’, but it increases the warming since someone looked at it and tried very hard to increase the warming before in previous international analyses, but presumably couldn’t quite fudge it enough.
The methodology is biased to increase the warming trend, so that is what they got. Garbage in, garbage out. The trend towards increasing the warming trend is built into the very methodology they have adopted. If they keep revisiting it, it will just keep getting warmer, faster and faster, but there is only so many times they can apply the algorithms before people start noticing the fudging.
One should therefore recommend that they keep their hands completely off it, otherwise the temperature before 1940 might get so cold that one must really start to worry about their safety. As in science fiction movies, they might start all dying before 1940 of the cold, and then all of us in the future might start to disappear as well.
Note that not one member of the expert ‘independent panel’ in the quoted report had the guts to stand up and point out the obvious, that the methodology is so seriously flawed that it always leads to an enhanced warming trend, and with more cooling the further back you go, as that increases the warming trend, which is what the methodology was specifically designed to do.
81
ROM Obviously D Jones should be removed, demoted or given a (not-responsible for data job at BOM or aligned organization), immediately. I understand that in Australia it is IMPOSSIBLE to fire government staff whatever the situation is (LAbour or Liberal Gov), so dont expect that.. unless a criminal investigation does prove attempted cover up/misrepresentation of government owned data.
62
The BoM got this one right. The need for the adjustment is very clear from neighboring stations. I’ve done the analysis here. The change happened in August 1980, and I calculated the adjustment at 1.4°C, which makes a 2.8 °C/Cen change to the trend.
612
What you still don’t know is whether Amberley responded with a different sign to the other stations as a result of shifting climate zones overhead as per my post #23.
1980 is around the time of the global shift from cooling to warming.
Furthermore, your adjustment has destroyed the evidence.
71
it is plain stupid an adjustment would be need if you d see a change of methodolgy is measuring temperature not a change in temperature..but for sure aftr doing that everywhere people will think that the temperature are geographically homogeneous everywhere…and it will justify correction of any inhomogeneity….
nothing circular there?
21
Please provide proof of s site change. Otherwise it is just more statistical shenanigans, and tantamount to fraud.
If the metadata doesn’t mention a site change, you can’t just pretend there was one just because you don’t like the raw data.
42
A comment from WUWT says it all
There is absolutely no valid reason to alter the temperature record unless UHI can be demonstrated or there has been a shift of the measuring device. Just looking at the record and concluding it doesn’t precisely match up with the neighbours record is skulduggery of the first order.
32
Your little effort proves nothing. The neighbour stations you chose bear no relevance whatsoever to Amberley and you would know this if you had spent any time in SEQ, specifically Amberley.
51
Well said Peter. Only visit SEQ occasionally, but I know the climate changes radically from the east to the west over the hills. !
To even pretend that there would be anything “homogeneous” about the so-called neighbouring stations, is a total and utter JOKE !!!
If this is how BOM does their thing.. no wonder they have stuffed up the whole Australian record.
10
Thank you!
I work on several projects which require daily weather observations. Each day I look at Brisbane airport, Archerfield airport and Tweed Heads weather, both from BOM and Weatherzone. Some days I look at Amberley out of curiosity as there is an upcoming project close by. The Archerfield airport shows around 3 degree difference on daily minima with Brisbane airport and it is approximately half way between Brisbane airport and Amberley.
One of my aviator mates is chasing up info from Amberley but had this to say just now:
10
Nick, your homogenisation adjustments are a JOKE.
You use
Ipswich.. a rapidly growing urban area
Brisbane. on the coast in a totally different climate type heavily affected by the Pacific Ocean
and Samford, in a valley with a totally different microclimate, also with a semi coastal influence.
Homogenisation .. BULLC**P !!!
50
ps. If anything, the data for the rapidly expanding Ipswich should have been adjusted to the more reliable and stable Amberley data,
.. Amberley, being a site that had not moved nor been encroached upon by urban development would have been essentially unaffected by Urban Heat trends.
But that wouldn’t match the warmist agenda, now, would it !!!
10
Nick, I’ve commented at your site. I repeat what I have said before:
a) yes, there appears to be a discontinuity 1980
b) adjustment MAY be warranted
c) the adjustment, applied to all previous years, is too large
d) the adjustment makes Amberley’s new trend greater than any of its Acorn neighbours. This same phenomenon happens at every other site where the trend has been changed by 2 degrees or more (I have yet to check others). The reverse also happens where a site has received a large cooling adjustment.
e) this leads me to suspect there is something wrong with the Acorn homogenisation process.
50
Ken, see my post at #25 in next thread.
00
No Nick, they are not right. Weather is not a smooth linear graph that must be adjusted when it does not conform to a bias. Your analysis is forcing it to be.
00
Looks as if child Connolly has red-thumbed the page; what an ignorant prat.
153
“BOM finally explains! Cooling changed to warming trends because stations “might” have moved!”
They went “walkabout”?…
51
I bet the same thing has happened here in NZ. Lots of wide eyed frantic acolytes here.
51
Do we know of one station that was homogenized that made the trend to become cooler? It would be highly unlikely that all changes around a site (or around those stations that were moved) would cause a change in temperature reading in one direction only.
31
Yes, the change to trends is fairly equally balanced. I’ve shown here histograms for the similar GHCN homogenisation. The US part is biased positively by TOBS, but elsewhere the spread is fairly even.
A long time ago there was a big FUSS about GHCN adjusting Darwin upward. I showed here that Coonabarrabran had been adjusted down by about the same amount. Didn’t excite as much interest though.
410
No the change to trends is not “balanced”. Ken Stewart compared raw to ACORN at 100 stations around Australia and found the trend in minima rose by 50%.
But yes Chris, some stations are homogenized and become cooler (eg Mackay QLD). It’s just that the size of the warming adjustments is larger than the cooling ones.
30
Happy Birthday Jennifer! Thanks for your hard work. Since you all Down Under seem to have some in your gov’t that are backing up on the CAGW destruction, your work is especially important as is Jo’s. Those of us in the US and UK have the vast majority of our respective governments actively using this AGW cr*p to control more and more of our lives and destroy more of our economies.
Some observations/questions about the cryptically named “homogenization” of raw data. My statistics courses were a very long time ago but isn’t the point of 5 and 9 year running means to smooth things out a bit in order to see trends and cycles? What possible valid reason is there to homogenize the raw data first? Amberley data from an RAAF base. Military attention to detail regarding data that is instrumental in the mission of flying. Sight unseen I would use that raw data with a very high degree of confidence. (Rereke Whakaaro’s comment at #9.1.2.1 is spot on. There was a pride in workmanship in the past that seems to be missing in so many places today.) I should think that any actual move of the station would be fairly obvious in the raw data. There would also be a record of it, the decision to do it, the time and material to move it and a record of the completion of said move. It’s the military, they document how many shoe laces they use in a year. Records of a weather station move are going to be somewhere, maybe a dusty Defense warehouse, but it will be something that another government agency will have access to if they wanted to actually look for it.
What other field of study adjusts raw data like this? Let’s try a few. Do astronomers take that raw image of the stars and then average their luminance out until they’re all gray? Do they erase the really dim ones and just keep the bright ones? Do physicists program the accelerator computers to look at millions of collisions and if a particle track goes a different direction with a different energy do they replace that track so that it fits in the average of the collisions before and after that event? Safety engineers crash 10 cars and two seat belt failures throw the driver through the windshield. Do they average those two “measurements” out and say the seat belt system’s average performance is safe? Of course not. No other real, quantitative field would accept manipulation of raw data.
Statistical analysis of some systems is a wonderful tool for finding patterns in complex data. The statistical produces themselves are NOT data but rather impressions of the real world and cannot be substituted for that real world. Does anyone think that Monet’s “The Japanese Footbridge” every actually looked like that painting?
72
> questions about the cryptically named “homogenization” … isn’t the point of 5 and 9 year running means
Homogenisation is (a) not cryptically named; it does what it says on the tin; (b) nothing to do with smoothing things out over time.
If you want to find out what homogenisation actually is, and why its used, then reading “skeptic” blogs won’t help you. VV has some useful stuff, e.g. http://variable-variability.blogspot.co.uk/2012/01/homogenization-of-monthly-and-annual.html or http://variable-variability.blogspot.co.uk/2012/08/statistical-homogenisation-for-dummies.html and lots more. Happy reading.
416
Discontinuous data sets cannot be made continuous without distorting the information in the original data.
Any such tampering with data hides real signals. See Revisionist Approach Destroys Information About Natural Cycles Embedded in Climate Data
Data do not exist to be adjusted for the convenience of fitting to algorithms. If the algorithms cannot be used to analyze discontinuous data, use another algorithm. Don’t vandalize the data.
101
> vandalize the data
The problem is that you don’t understand what homogenisation is. Your near-worship of “raw” data is utterly unscientific. For the general case, it clear that if a station moves, or suffers exposure change, or time-of-day change, in a way that affects the change, then the data needs to be adjusted. Doing otherwise just gives you a false trend. So the worship of raw data can’t be sustained. Once you’ve accepted the obvious, that data does need homogenisation adjustments, then all you’re left to argue about is how much.
http://moyhu.blogspot.com.au/2014/08/adjusting-amberley-as-it-must-be.htm
319
But, why is BOM unable to show all raw data and all adjusted weather time series together and explain their reason for making the changes, including the algorithms and computer codes?
It is sad Mr. Connolley that you have proven yourself for what you are by destroying trust in Wikipedia through you Wiki “adjustments”. Your comments here only demonstrate that you have neither repented nor changed. And yes, the people on this site do understand what the BOM is doing and why they are doing it.
101
NO station move has been shown to have occurred.. It is a fabrication.
BOM should verify a station move or put the data back how it was.
No more adjusting data just because it doesn’t say what you want it to say. That is FRAUD !
91
people can understand that filling some gap can be needed to reconstruct something global over time, they just don’t understand why for homogeneization purpose you dare to say ..i am sure this particuliar data need to be adjust…at best…they could accpet the idea that this data is not homogeneous…
we are suppose to talk about science so can you prove this data is wrong?
can you prove that even homogeneization has no effect on global trends?
you can convince me at best that your method is the best to reconstruct data according to the assumptions you ve made .
People are not stupid instead of saying all is right just remind us the basic assumptions used to reconstruct data…
We all understand that data have gap, that some stations stoped recording while another started recording…it is ok…
we can understand that if an actual problem in methodology has occured in a given place, the data might be corrected..or not… we just don’t accept the idea that you can PROVE or be certain the data is wrong for up to down reason, at best you can have a hint.
climate is local…what if for instance the rainfall has changed in a similar inhomogeneous way with temperature in this place? what if is is a misty place what if if is not a place homgeneous with other places used to homogenized for other parameter than altitude and the little set of parameter used in homgenizing algorythm??
dont say you re not making assumptions.
41
lemiere.. I take it you are French (or similar) .
Do you have anyway of accessing French temperature data.?
Has it also been put through the warmist homogenisation blender ?
We see US, Australian, NZ, (and some other places that SG has found) data undergoing the alarmista treatment,
..it would be interesting to see where else it is happening.
41
The problem is that you’re not reading what I’ve written in order to understand my argument. Which part of “use another algorithm” is so hard to understand?
“Your” argument for homogenisation is so that one can draw a trend line through synthetically-continuous data. You imagine that homogenisation will circumvent “false trends”. But ignore that the process of such homogenisation is largely aphysical and far removed from metrology.
You show scant regard for how things are measured, so it’s no surprise that you place no value on that which you would destroy so that you can easily draw a trend line.
BoM and others don’t routinely operate new and old weather station (equipment) in parallel for several years to measure the magnitude and nature of difference in measurements that the transition to new equipment would make. One would think that our taxes ought to be put towards conceptually best-practice. BoM (etc.) however assume changes; largely arbitrarily. Apply them; arbitrarily (as demonstrated).
The error bands on the synthetically-continuous data series are worthless because errors in arbitrary adjustments are far wider than the original instrument readings; especially as the adjustments are pragmatic to fit the algorithms with which the analysts are familiar and have little physical basis.
Treating them as though they had the same verity as instrument measurements is delusional and unscientific. Even when the transitional factors have been measured, the methods of measurement and what is actually measured result in relative errors; often due to different time constants producing e.g. more extreme temperature extremes; for which the WMO has not defined a consistent method that facilitates direct comparison with historic temperature measurements.
[Modern temperature sensors respond to a tiny volume of air with a few thousandths of a second. Older thermometers took many seconds and relatively large volumes of air (to heat/cool the mercury column and bulb) before showing the air temperature after it equalized with the thermometer. As the new sensors react a thousand times faster to a tiny fraction of air volumes previously necessary; temperature extremes measured nowadays are bound to be “more extreme”.
Had WMO defined e.g. a 10-second average with the sensor to be exposed a given volume of “fresh” air (e.g. 0.100 m³) over that period, then we might be able to do direct comparisons.]
If the differences at station moves, etc haven’t been rigorously measured over several years encompassing nominally-same seasonal transitions, then there is no physical basis for any homogenisation of the data as part of the analysis.
Station changes, etc must therefore be dealt with as though there were a new station. Otherwise a “false trend” is inevitable; especially if one has deluded oneself by arbitrary homogenisation.
Raw data; the measurements as taken, when plotted, will show step changes at station changes. Even station changes outside of the control of the station “owner”. Nothing is hidden. Homogenisation hides changes; deliberately and “inadvertantly”.
Historical measurements of one station cannot be “patched” onto a new station’s without a a physical basis founded upon measurement for comparison on a case-by-case basis. Even then, such homogenised data must be clearly marked as synthetic and the raw data preserved. Newer measurements should be able to be inversely homogenised to reflect what the old station may have shown.
A rigorous physical basis is essential so that the magnitude of the resulting errors (error bars) is available to evaluate the potential errors in subsequent analysis.
40
Very well said!
00
Breathtaking . . .
11
Oh, we do. it is the manipulation of data to satisfy a predetermined conclusion.
If you cannot find rising temperatures, you create them.
00
I know exactly what it is and why it’s done. Did you read the last 3 sentences of my post? I question the practice of providing “homogenized” data in place of raw data. If the BoM or NOAA or any other alphabet agency on the public teat wishes to provide that as an analytical product, fine. Do not call it measurement data because it no longer is and its utility for future computation is degraded. Since 99% of the artifacts in the adjusted data I’ve seen from the UK, the States and Oz have been firmly biased towards cooling the past and warming the last 15 years I have a huge problem with both the practice and its results. If you were the scientist you claim to be, you would have a problem with it as well.
91
> Since 99% of the artifacts
Notably short of any actual links or data. I think you just made it up. http://www.moyhu.blogspot.com.au/2014/07/ghcn-adjustments-are-much-larger-in-us.html provides actual graphs and says you’re wrong.
> the scientist you claim to be
I don’t claim to be a scientist (http://www.realclimate.org/index.php/archives/2007/12/goodbye-to-all-that/). Do try to keep up.
18
“I don’t claim to be a scientist ”
You never were.. you were always just a lying propagandist.
Your one achievement in life.
62
Again, lots of insults Griss but no facts. Got anything to rebut what WC says or just more insults?
25
Hi Fin, finally out of your damp hole under the rock?
As he says, he is not a scientist..
I accept that to be manifestly true.
Nothing to rebut.
21
yes, it destroys raw data.
The problem you are either totally ignorant of, or are choosing to be stupid about, is simple. Weather is not homogenized. As soon as you decide that raw data does not conform to your bias, and change it, you are looking at your bias, not the data.
11
The data you’re worshipping – the data you’re falsely calling “raw” – has actually been averaged. Averaged! Did you realise that? Its not raw at all – its been processed. So if you care about weather – not climate – you’ll need to avert you eyes from the ungodly averages.
12
Am I banned at this site? If so, why?
04
Off topic but knowing your love for Tim Flannely, you really should take a look at this for fun.
http://petapixel.com/2014/08/22/portraits-scared-scientists-drive-home-critical-state-climate-change/
Scared of climate (not) change(ing enough to support my funding).
60
Flim-flam. Yep. Just another of comrade Karoly’s amateurs.
The fools just can’t help themselves.
50
Well I dunno, but have I got this right?
So, they don’t know much about it’s history – OK.
How or why would one attach an ‘identity’ to any particular station? I presume it’s because it apparently ‘looks’ different compared to it’s far away neighbours?
I thought that’d be the precise reason for installing multiple stations and placing them some distance apart in the first place . .
You know, to get an idea of any spacial variation.
If the intent is to keep all stations in line, then ultimately, one only needs one station for the whole of Oz and you wouldn’t need to put all this stuff into a spreadsheet at all. There’s a time and cost saving right there.
So . . the adjustment is warranted because it’s inconsistent with it’s (not so near) neighbours, and their confidence is very high for exactly the same
treasonreason?Pffhht – Non sequitur.
Again, if inhomogeneity is the problem, then just have one station for the whole of Oz!
Hang on, they just said:
. . and yet are able to pull a very high level of confidence from that ‘little available documentation’?
The whole explanation is just rubbish.
121
Occam’s razor says fraud.
Good on you in OZ for moving ahead in the race to expose government climate chicanery.
US folks seem far better at hiding stuff, tho we haven’t changed govt. in a while. Maybe when we do……
For a global problem – Jo – your a global resource & we thank you.
61
With such a track record of [snip] activity….
http://wattsupwiththat.com/?s=William+Connolley
…why is William Connolley allowed to muddy up discussions anywhere?
In this particular case he in distorting the issue by obfuscating the full context of the data adjustment problem which has been
going on for years while the perpetrators have been concealing, stalling, obstructing and hindering attempts to get
the truth which chronic Wiki-[snip] Connolley scolds has always been available and validated.
This guy was out of line long ago and is a known scoundrel that should be getting the shaming boot he’s earned.
104
For the entertainment.
Same old BS, recycled endlessly.
WC is the best the C.C.C has to offer.
Gives us insight into the decline which cannot be hidden.
Same with his handwaving cynical socket puppet Racehorse Stokes.
Oh look a Squirrel.
52
William Connelley doesn’t exist as such. He’s just an invention.
In the fallout of Climategate various warming scientists realised that rude or stupid comments would be bad publicity if revealed, so they came up with Willy the Conn so they could make such comments and then deny involvement.
All sorts of behaviour / name calling / lies etc. can be “hidden” under such a fiction. With several climatologists involved you can see how so many posts can be generated.
72
It doesn’t help. The WC epitomises the arrogance and egotism of the AGW climate scientist.
He will always automatically sway people against the AGW agenda with every post he makes.
62
Ah yes, a fencing dummy with a another purpose.
20
In order to assess, we would need to know more about the AF site. it there was a step change in Tmin, that would (sort of) suggest a move from a poor microsite to a good one. Was the later microsite good or bad?
If it is currently good Class 1\2 (Leroy, 2010), then at least the story (kind of) fits. It may or may not be true. And it says nothing about the appropriateness of the size of the step change (apparently ~1980).
But if the site today is Class 3 or worse, then that don’t scour, prima facie.
Let’s find out.
11
> the best the C.C.C has to offer
Not on this one. On this one, the one you should fear is Nick Stokes. http://moyhu.blogspot.com.au/2014/08/adjusting-amberley-as-it-must-be.html Notice how no-one has an answer to his #55.
311
Until Nick can prove there was an actual site change, no-one has to answer him.
Its just more fraudulent adjustment of the data and facts… no wonder you accept it.. that has been your whole life.
71
fear is the mind killer. Keep fearing, you have no mind left to kill.
00
Why not put another thermometer on the same hillside where they claim the Amberley thermometer might have been before it was supposedly moved? Then compare temperature readings to see if the hillside temperature really is that much warmer on average than the official temperature. This could expose the fraud and show that adjustments of such magnitude are completely unjustified.
31
it is crazy, every body can understand that because the dattion didn’t recorded temperature for the same period adn because the set of stations changes any reconstruction of the horrible global temperature needs correction to fill the gap and connect things , you have to make a lot of assumptions to do this and you have no way to be certain is assumptions were right…
So even the recorded temperature are perfect you need a lot of assumptions to make a global temperature…
so after that if you assume data is partially wrong…. because of geograhic inhomogeneity of recorded temperature betwenn stations..you need to do other assumptions….wait a minute how do you know if inhomogeneity is a sign of wrong measurment? well because we assume that temperatures should be homogeneous…..
and the evidence is clear because once we correct the inhomogeneity of the data the temperatures are homogenous.
61
Let’s find pictures of the station.
According to the BOM, it’s coords are -27.63 152.71.
Looking at Google Earth, it’s just to the right of the C17 on the runway.
52m wingspan on that bird, so the weather station’s about that far from the road, looks like a Class 1-2 site.
Where was it before? It’s in the same place in the 2003 imagery, the earliest on GE.
The question to ask is “Is the change in the temperature record due to a change in location”?
The BOM (& the “Warmists”) appear to think it is, but where’s the proof.
To me, the change looks like it occured earlier, late 1970s, so just after The Great Pacific Climate Shift?
51
> The question to ask is “Is the change in the temperature record due to a change in location”?
Excellent question. Which should be asked, and answered, *before* people go off ranting about criminal activity in such a silly fashion.
311
Has the debate really come down to this: a conflict about the history (or not) of one Australian Stephenson Screen? What is the core question are you asking here other that “what is the temperature of the earth (and how is it changing)”? This is the basic question when considering the Global Warming Narrative. Way back in 1990 there was ONLY the temperature record with which to address the question. The problem was, as Nick Stokes states “the RAAF had its own priorities”, as did every other collector of the historic data that had to be used (as well as their own equipment, protocols, requirements and methodology). Despite the total unsuitability of this data to address the question, it was used, what else to convince but the claim that you KNEW and could construct a convincing time series. Hence the necessary
“adjustments” and “corrections” – no doubt justified – but manipulations all the same. Not precision science it seems despite have instrumentation of incredible sensitivity.
But Bill, “your near worship of ‘raw data’ is utterly unscientific”. Take away the “raw data” and you only have philosophy and religion, both the opposites of science.
51
> Has the debate really come down to this: a conflict about the history (or not) of one
No. There’s a blog posting *here* about the issue, because you lot are confused about homogenisation. Don’t mistake this for the scientific debate.
If you wanted to try to see whether that jump in 1980 was real or not you could compare to surrounding stations (which NS has done, and which pretty well confirms that there is a discontinuity which needs fixing). Or, you could recall the good old “skeptic” mantra of yesteryear: that the sfc record is terrible, we must use the satellite record instead (that one fell out of favour once S+C’s errors were corrected and it stopped showing cooling. Hey, why don’t you tell S+C to use only raw data?). But I bet if you compared against the satellite record, yo’d confirm the same thing. None of you can be bothered, of course, because that would be actual real work.
39
No Bill I do not mistake anything you engage with as a “scientific debate”. I’m sure if any of the 300 odd inhabitants of Amberley are actually listening in they would be tickled pink at being the centre of the universe due to their weather in 1980.
The rest of the world has acknowledged that Global Warming has (apparently) ceased and the implications of this are of considerable interest and consequence.
I doubt that the spring evenings in Amberley are going to be a big feature.
72
With you here, we know it is NOT a scientific debate, but a propaganda one.
As soon as you are involved, we know they have something to hide, otherwise a lying **** like you wouldn’t be here.
You should just stay away if you want to help their cause.
Its a reputation thing.. and yours is in the sewer.
82
That’s funny… “the RAAF had its own priorities.” They sure do. Their job, protecting your family and country is to get max loaded military aircraft off the ground every single time… otherwise people die. Lift is directly related to air density on which temperature has a huge effect. It’s hot, leave some space in the fuel tanks to lighten up and tank in the air. It’s cold, we can take a full load of fuel and ordinance and get a bit more range to bingo. The RAAF’s priority would have been to have the most accurate data they could have when it came to temperature, humidity, wind speed, direction and pressure. They want accurate data that is specifically NOT some micro-climate. Their runways are 1.5km and 3km respectively. I’ve got to say that the RAAF’s priorities would be really good practices… and I doubt that the LAC/LACW’s that trekked out to that station on a daily basis appreciate the BoM re-writing all their diligent work. (See Rereke Whakaaro’s comment at #9.1.2.1 and mine at #60.)
80
Although I can’t find any pictures of Amberley in the 60-70’s that show the position of the climate station,
there also don’t seem to be any changes that would warrant a repositioning of the site.
The site as is, would have been pretty much the optimum site all along.
Until some PROOF that a change of site actually occurred, the data SHOULD NOT BE TOUCHED.
Homogenisation came along just in time for the AGW hoax to be perpetrated on society.
Its the method used to justify data fabrication and trend adjustment.
70
Although I can’t find any pictures of Amberley in the 60-70’s that show the position of the climate station,
there also don’t seem to be any changes that would warrant a repositioning of the site.
The site as is, would have been pretty much the optimum site all along.
Until some PROOF that a change of site actually occurred, the data SHOULD NOT BE TOUCHED.
Homogenisation came along just in time for the AGW hoax to be perpetrated on society.
Its the method used to justify data fabrication and trend adjustment.
00
I can just see it now.
Pilot to tower:
Request de-icing prior to departure.
Tower to pilot:
De-icing is unnecessary ever since the new weather feed from the BoM.
Pilot to tower:
Insist de-icing be undertaken prior to departure.
Tower to pilot:
Sorry, no de-icing equipment available because we don’t experience icing conditions since 2014.
Besides, we’ve now sold the de-icing equipment to a guy called Chris Turney for his next Antarctic expedition. Told him the equipment wasn’t suitable for shipping, but hey, he seemed a little paranoid about ice and we needed the funds . .
Clear for take off.
40
WC… How about *before* the BoM changes all the data by guessing which may be criminal activity?
41
William Connolley August 27, 2014 at 4:05 am · Reply
> The question to ask is “Is the change in the temperature record due to a change in location”?
Excellent question. Which should be asked, and answered, *before* people go off ranting about criminal activity in such a silly fashion.”
What a purposefully mendacious statement. As if that and numerous other related inquiries (data requests)have not been made during the many years of this adventure only to be met with stone walling.
82
Doesn’t help you guv. As the BOM have told you, if only you’d listen, they don’t have Amberley metadata for the 1980s because it was an RAAF station then. So all your blanket requests for metadata are besides the point. The question (as AG intelligently asks) is “Is the change in the temperature record due to a change in location”? Your answer is, you don’t know. It might have moved, it might not – you’re clueless. So ranting on about fraud, before establishing the lack-of-move, is the thing that is “purposefully mendacious”.
And there’s still no-one brave enough to take on http://moyhu.blogspot.com.au/2014/08/adjusting-amberley-as-it-must-be.htm
216
Then they can’t just “make up” a site change..
I know you spend your life making up stuff and changing reality, but BOM is meant to be scientific, (not a lying **** like you).
Until a site change is PROVEN, the original data should not be touched. End of story.
Anything else is just FABRICATION and FRAUD.
(Nick has not proven a change of site. He has “assumed” because he doesn’t like the raw data).
92
Wc: You offered a link. Twice, at least:
Don’t you understand how the interweb works? 😉
20
its meant to have an ‘l’ at the end.
It leads to a where Nick Stokes thinks Amberley is in the same climate region as Brisbane, and Ipswich isn’t affected by large UHI.
ie.. a classic example of BOM homogenisation.
31
Sorry, pasto. The correct URL is http://moyhu.blogspot.com.au/2014/08/adjusting-amberley-as-it-must-be.html You need to add an “l” on the end; “html” vs “htm”. Don’t you understand how the interweb works?
07
Don’t you understand how cut and paste works.
Like Wikipedia, you can’t edit it and expect it still to be correct. 😛
71
Sorry, we are listening to science, not charlatans.
Flip the sentence around and you see how foolish you look
“As the SCIENCE has told you…”
A shame you are unfamiliar with that fellow.
00
According to the BOM, it’s coords are -27.63 152.71.
Looking at Google Earth, it’s just to the right of the C17 on the runway.
52m wingspan on that bird, so the weather station’s about that far from the road, looks like a Class 1-2 site.
No, we can’t tell. (Coordinates to 2 decimal places is utterly inadequate.) I am not skilled in foreign stations (I can pick a US station off a fly’s butt). I see an enclosure with a box that — might — be a CRS (but look, Ma, no legs and no suite of other necessary instrumentation). If that is it, it is a Class 1 (Leroy, 2010).
But we cannot tell. There is nothing that looks like an ASOS or AWOS I can spot. Does OZ not use automated systems for airports (and if not, why not)?
Where is the station?
60
Good Lord don’t give them any other ways to bias the data. We’ll end up with a bunch of unpublished statistical algorithms for FPSAC (flight path swatter avoidance corrections) and HBHLSC (horse’s body heat landing site corrections) and once we figure those out they’ll have the flies hiding in the Atlantic’s bathypelagic zone with all that excess heat they swiped from the Kansas Dust Bowl in the 1930’s.
50
Without proper metadata, we are shooting in the dark.
Insofar as William Connolley’s comments, he is correct that it might be explained by a move. But moves rarely create such radical shifts.
TOBS biased US stations appear to run ~0.08C cooler than non-biased. But effects vary — I am currently trend-splitting to determine the true effect, but I am not done with that yet. But we are talking a decadal shift of well over three times that.
TOBS bias is a valid concern. But from what I can tell, so far, it appears to be overcorrected. That is why I ruthlessly drop TOBS-biased stations from my observations.
The only way to tell is split the trends. To heck with the theories. The answer is in the data.
I must disagree with Dr. Connolley regarding homogenization. If the sample is correct, it is unnecessary. If the sample has a systematic bias (i.e., microsite), then it is worse than a travesty.
If there are not enough samples, homogenization is woththless. If there is oversampling (as well there should be), then it is unnecessary.
I hate and despise homogenization with an ice-cold passion.
111
> by a move
If I said that, I miss-spoke. It could as easily be change in time of obs, instrument, whatever. But a change.
> I hate and despise homogenization
You can if you like. But for it to be something other than a personal prejudice, you’d need to provide reasons. The scientific literature doesn’t support what you’re saying. Why should we prefer your opinion to the literature?
216
As an adherent of the highest order, you must know and can point to published studies where replacement equipment underwent long-term comparison of results before the older system was junked??? If they existed, other that the ‘algorithm’ search programs, I would have thought the acolytes would have touted such papers far and wide.
Are there any? ANY???
C
10
PROVE that such a change took place.. OR STFU !!!
42
What utter crap.Gain-say is all you offer.There are numerous sites that are bearing the same mendacious imprint.Your references to Stokes offer up the same spurious nit -picking
51
In Para 11 I’d suggest editing ‘…destroying data by adjusting…’ to ‘distorting’ as BOM claims to keep the raw data. If someone finds that the raw has been fiddled, then the first statement would be correct, but not without evidence. The Distortion itself is bad enough and we don’t need to give the CAWG Acolytes a target!!
C
Ta. Yes destroying data is better said as ” destroying climate information contained in the data”. I’ve changed it, it is more accurate. – Jo
10
Despite the lone waffle defence, appeal to authority and all the red hands in some sort of petulant hissy fit, this looks like the mother of all scandals and could turn out to be the pivotal moment in the defence of real science against the mighty AGW machine which is fighting to keep Global Warming alive. Can you imagine what would be said if the world temperature has actually dropped? It is possible there has been a mighty battle with the data even to manufacture an hiatus, itself a desperate interpretation of a refusal to warm as simply a temporary situation, a pause on the way to armageddon.
In the public mind, a drop in temperature would be the end of any logical connection between rising CO2 and rising temperature. Historically, this discovery of possible malfeasance may be the single point on which the whole trillion dollar scam turns. Well done to Jo and Jennifer.
102
“Historically, this discovery of possible malfeasance may be the single point on which the whole trillion dollar scam turns. Well done to Jo and Jennifer.”
There’s no discovery at all. Adjustment is well published. Just go to this NOAA page and you’ll see a complete account of the adjustments to Amberley – before, after, difference, histograms. Done competently.
58
No, those are simply the results of the adjustments, they say nothing about the competence of the adjustment technique used. Or whether the adjustments were justified by actual physical evidence. Or whether the adjustments introduced artificial warming trends by their very nature.
http://wattsupwiththat.com/2014/06/10/why-automatic-temperature-adjustments-dont-work/
I note you still haven’t provided an explanation why Albert Park in Auckland wasn’t adjusted correctly.
60
Amberley AMO has been operational since 1941 and there is no record at BOM of any change to the location or elevation of the site.
Site name: AMBERLEY AMO Site number: 040004 Commenced: 1941
Latitude: 27.63 °S Longitude: 152.71 °E Elevation: 24 m Operational status: Still Open
There is no justification whatsoever for adjustments to the Amberley temperature record. To suggest that any adjustment has been done competently is scurrilous!
80
Its a fabrication and a lie. Based on zero science.
22
[…] Evan Jones makes a cameo appearance, saying “I hate and despise homogenization with an ice-cold passion” which is jolly fun, but he doesn’t tell us why. But it sounds like he’s a […]
00
The flying public have no idea of the number of AW shits per second on the way to a workable aircraft. Minor modifications are even worse!
00
I think there needs to be an Australian Government inquiry about this. I’d appoint, say, a judge and three statisticians of note. None with any ‘skin in the game’. In other words no published record of an opinion as a ‘warmist’ or a ‘skeptic’ on the issue of climate change.
For what it’s worth here’s my view:
[1] I don’t understand the view that “raw” data and only “raw” data should be used to show a national temperature trend. Of course, raw data is sacrosanct in that it should be stored and kept very safe. But I believe that raw data is readily available on the BOM website if you know where to look. When I was doing nuclear physics experiments, raw data was only ever the starting point for analysis. By the time we published data it had been recalibrated, and altered for a whole range of systematic errors etc. I would do the same for temperature data.
[2] I don’t very much like the word ‘homogenisation’, as it sounds like it’s been through a blender. That said, surely some sort of process like homogenisation must be done if you’re trying to infer a temperature series across an entire region over time. As far as I can see the process of homogenisation is entirely openly described in many places, which does not necessarily make it right – but neither is it some sort of a dark secret.
[3] With homogenisation I would expect many sites worldwide to have been corrected in the opposite direction to Amberley. In fact in 2 minutes I found one in Australia, that if I read the data correctly, introduces an even sharper trend in the other direction – at Georgetown.
ftp://ftp.ncdc.noaa.gov/pub/data/ghcn/v3/products/stnplots/5/50194275000.gif
Should I write to The Australian and complain that BOM is deliberately reducing the temperatures at Georgetown to fit the Government’s agenda?
[4] One comment above suggested that 1980 was a significant date for Amberley to have its data changed, because that was when the “AGW conspiracy” started. How was it, then, that in my first year of University physics in 1975, our major assignment was to find a way to calculate the increase in temperature caused by a doubling of CO2 in the atmosphere? (Actually a fun few pages of work for anyone interested in basic physics.)
Anyway – back to the original point. I’m very much in favour of an inquiry. However, I doubt the Government will give us one. I would be very surprised if it turns up anything of note. If it does, then I would expect BOM to be extremely severely dealt with. If not, then I’d expect a full front page apology in The Australian.
10
That is a huge part of the problem. How about 3 metrologists instead? The BoM are “fixing” a supposed problem with the metrology at sites with statistical methods. It’s not the statistics that are in question here it is the wholesale fabrication of data. Homogenizing data from a site is just like throwing it away and making new stuff up. Statistics can tell how you did it and what was done but it doesn’t change the fact that real data has been tossed and made up data substituted. Not only do they claim their statistical guesswork is as good as actual data they continue to bleat that they’ve improved the fidelity.
I’ll keep saying it, statistics are a nice tool to look at large amounts of data, but their products are not data. It’s like taking a series of photographs, each one is an accurate representation of a scene at the instant it was created. Statistic gyrations are like blending all of them together and then finger painting over the result. It’s an impression of the original scene, but its fidelity has been severely reduced.
00
> I hate and despise homogenization
You can if you like. But for it to be something other than a personal prejudice, you’d need to provide reasons. The scientific literature doesn’t support what you’re saying. Why should we prefer your opinion to the literature?
I can. I like. (And you left out the cold passion part.) Reasons you want? Reasons you get.
First, we must understand that if the majority of sample has a systematic bias, homogenization simply does not work. Well, like obviously. It makes a bad situation worse. (Even Dr. Venema goes this far.)
See where this is headed? Follow the pea.
Class 1\2 (Leroy, 2010) USHCN2.5 stations (the pea) show a warming trend of over a third less than the poorly sited stations (Class 3\4\5). Under 0.2C/decade, study period 1979-2008. Class 3\4\5 stations warm at well over 0.3C/decade. (Using unmoved, non-TOBS flipped stations, only. With MMTS adjustment applied.)
~80% of USHCN is Class 3/4/5. ~20% is Class 1\2 (the pea). Homogenization identifies and adjusts outliers to conform with the majority. That what it is. That’s what it does. That’s its raison d’être. So which stations do you suppose get identified as outliers? And in which direction do you suppose they get adjusted?
With me so far?
Any game designer/developer worth half his salt would never have missed this. It would never have survived playtest. But the scientists who applied homogenization are not game developers. I do not ascribe blame: This is not part of their formal training. I, however, am a game designer/developer, schooled in deconstruction. And I did not miss this.
And when the horror is completed, all trace of the True Signal is eradicated as if it had never been, leaving not a trace that it ever existed. The little boxes on the hillside have all come out the same.
The pea has vanished.
What remains is not even pea soup. It is meaningless pap. You have ruined your results. You have taken a bad situation and made it 0.2C per decade worse.
Homogenization obliterates utterly the signal of my precious, beloved Class 1\2 stations.
It silences their song.
And oh, my foes, and ah, my friends, that is how we get from +0.195 per decade (well sited, pristine) to +0.332 (homogenized pap) per decade.
It wasn’t dishonest. It wasn’t intentional. It was merely a diabolical procedural artifact. And you will never find it because the homogenization procedure has eradicated every last vestige of evidence for it. If you ever want to find it, you have to take it back to formula. (That would be me entering, stage left.)
51
> Even Dr. Venema goes this far
{{cn}}. If you’re invoking someone in your support, you could at least provide a link to them agreeing with you.
> First, we must understand that if the majority of sample has a systematic bias
That’s not really an argument against homogenisation, but against systematic bias in datasets. Which you’ve not provided evidence for. This wouldn’t be in the not-quite-yet completed paper, would it?
26
If you’re invoking someone in your support, you could at least provide a link to them agreeing with you.
http://blog.hotwhopper.com/2014/04/heat-sinking-temperatures-rising-in-us.html
Enemy territory. But I like it that way.
Victor Venema April 26, 2014 at 9:00 AM. Third paragraph.
“If the artificial additional “trend” is due to local trends in the majority of badly sited stations, you would be right that homogenization would make the good stations worse.”
The full discussion is there. Please feel free to join in.
I like you and the VeeV. (And Sou.) You have treated me with respect, to my face, anyway, for which I am grateful. I have personally defended you both on WUWT. (Just two days ago, in fact, come to think of it.) I can talk to you. And I need input from the other side: I cannot think in an echo chamber. I need you to beat my own confirmation bias. And we all have one. (The result has been a dramatic improvement over the 2012 pre-release.)
That’s not really an argument against homogenisation, but against systematic bias in datasets.
But that’s the point, isn’t it? The systematic bias is bad microsite. And systematic, it is. As well you know. Homogenization removes all traces of said bias. (Hate. Hate. DEEP HATRED!)
As for me, I’d have been more interested in why there was a trend inhomogeneity in the first place. Not all het up to just smooth it all over and forget it. But instead, you-all took the quick and easy path. And now you are going to have to get the toothpaste back in the tube.
Well, I have uncovered the defect in the outliers.
The defect is that they are well sited.
Which you’ve not provided evidence for.
After my recent station review:
Class 1\2 stations (Raw+MMTS only): 0.193C/decade.
Class 3\4\5 stations (Raw+MMTS only): 0.349C/d.
Class 1\2 stations (Homogenized): 0.302C/d.
Class 3\4\5 stations (Homogenized): 0.330C/d.
All Stations (Class 1-5, Homogenized): 0.325C/d.
All unmoved, no TOBS flips. MMTS adjustment applied based on Menne (2009 & 2010). When gridding and area weighting are applied, the results are even a little bit stronger.
Pretty good evidence, don’t you think?
This is using our old USHCN2.0 data from Fall et al., 2011. I am currently upgrading to v.2.5, but it’s the same story.
And how could the result be any different, given what the becursed H-word does? Sticks out like a pig in a tree if you know what to look for. And I know what to look for. But I’m an old hand. I’m content to wait until you-all get up to speed. (Yeah, I know. I’m sounding more like Mosh every day, now. We are not unalike, he and I, I think. But I think he’s barking up the wrong tree.)
This wouldn’t be in the not-quite-yet completed paper, would it?
Three guesses. Updating from Dr. Fall’s USHCN2.0 data to USHCN2.5 takes time. And elbow-grease. Rome wasn’t burnt in a day, you know. I am up to my eyeballs in the monthly raw and adjusted USHCN station data and metadata. My little MMTS brothers and CRS sisters. I see it in my sleep.
40
> http://blog.hotwhopper.com/2014/04/heat-sinking-temperatures-rising-in-us.html
> Victor Venema April 26, 2014 at 9:00 AM. Third paragraph.
> “If the artificial additional “trend” is due to local trends in the majority of badly sited stations, you would be right that
> homogenization would make the good stations worse.”
But note the leading “if”. And note the next two sentences, which you didn’t include:
I would be surprised if you could give a mechanism that could do that, especially a mechanism that did not work the last decade, but only in the 1990ies. So we are back to the question you did not answer yet on the physical mechanism.
So no: VV doesn’t agree with you.
14
Of course he doesn’t agree with me.
He agrees that homogenization will not have the intended effect if the sample has a systematic bias. That is what I said he agreed with (and quoted).
Also, you did not read my detailed response to what he said. I did provide a mechanism (which I have dubbed the “Delta Sink” mechanism. (I’ll explicate if you wish, of course.)
And I also fully explained why there is no divergence with CRN (a most excellent network) after the 1990s.
The reason is that after the 1990s there has been no atmospheric warming trend. Heat sink effect does not create a trend. It exaggerates trends that exist already. If there is no trend to exaggerate, there will be no divergence.
If anything, there was cooling in the US from 1998 to 2008. And, yes, the badly sited stations cooled faster than the well sited stations during this interval. heat sink effect works both ways. What goes up must come down, you know.
And the fact that it works both ways makes the hypothesis far more robust.
The only reason there is a warming trend bias from bad microsite from 1979 – 2008 is that there was a net warming trend from 1979 to 2008. If there has been a cooling trend, that would have been exaggerated as well. And if there is no trend, there will be no exaggeration either way.
That fully explains the divergence during the warming 1990s as well as the lack of divergence during the flat trend of the last decade.
Unfortunately, Dr. Venema did not reply to those points. Care to give it a shot?
20
> if the sample has a systematic bias.
Yes. But he doesn’t believe that bias bit. So the statement becomes null, and doesn’t help you.
> Heat sink effect
But this is your personal work, no? Unpublished. Clearly you’ll believe your own mechanism, but you can’t use it as evidence.
> Care to give it a shot?
If VV didn’t think it worth replying, I’ll defer to him.
15
VV did post a reply, here and at mine. The one at mine got shuffled to spam for no good reason, so likely the one here did, too. Its http://scienceblogs.com/stoat/2014/08/26/the-fruitarians-are-lazy/#comment-50138
22
And the WC gives yet another link to the sewer.
13
Don’t know why the BoM don’t have Amberley data prior to 1981. I worked at RAAF Pearce as base meteorologist 1972 to 1975. Employed by BoM, seconded to Air Force as civilian.
We did hourly obs when flying was in progress for aircraft performance and safety reasons, there were various automatic chart recorders for temperature, humidity, wind speed and direction, sunshine hours etc and also at 9am and 3pm we went out to read and record the Stevenson screen (mercury in glass thermometers/wetbulb and max/min thermometers out on the grass away from buildings etc. IIRC the automatic sensors were nearby.
I can’t imagine Amberley had a much different setup. AFAIK the BoM kept all the records and the machinery was certainly maintained by BoM technicians. At the time the only way the RAAF had meteorologists in uniform was at Butterworth. They were in fact civilians who were put in uniform in the RAAF for diplomatic reasons for the duration of the OS posting only. Inside Australia meteorological support for the RAAF was provided by the BoM at that time. The BoM sure had to know about station siting as their techs had to find and maintain the equipment.
41
Mike
BOM do have Amberly data prior to 1981. It’s all accessible at BOM Climate data online and station 040004 is shown as the same location since 1941 as I noted above. There is absolutely no justification for adjusting the Amberley temperature record.
40
Evan Jones makes a cameo appearance, saying “I hate and despise homogenization with an ice-cold passion” which is jolly fun, but he doesn’t tell us why. But it sounds like he’s a […]
I’ve been called worse.
So, gonna put up my whys and wherefores, then, Doc?
40
> I’ve been called worse.
Sorry, don’t understand you. I haven’t called you anything.
> gonna put up
I’m sure you’re capable of talking for yourself. But, speaking of putting up, I’d be far more interested on your comments on http://scienceblogs.com/stoat/2014/08/18/happy-second-birthday-to-watts-paper/ How’s the gestation going?
06
Don’t get me wrong. I haven’t anything against you. You have treated me well on Stoat. But if you say I have no response, you should at least correct that. You know me. When have I ever been without response?
I will add to that discussion that I have carefully reviewed airports using the continually (and dramatically) improving GE images. Made a few calls to airports. That cut the sample ‘way down, as might be expected.
And I no longer detect a bias in airport sites, although the AP sample is now very small, and therefore the error bars overlap.
These results do, however, suggest to me that when AP sites have moved, it warms the trends. But mesosite is not the point of the study; it’s all about microsite. A poorly sited rural station will, on average, warm much faster than a well sited urban station.
Microsite is the new UHI. (And I will fight the skeptics on that issue, too.)
You can take some credit here. If it were not comments on Stoat, I would not have been motivated to properly purge the moved stations. Fortunately USHCN metadata covering our study period has dramatically improved.
10
Lonely again hey WC.
We all know were the WC nearly always links to…
52
Jo and Jennifer. Wasn’t Bill Kininmonth head of BofM for 1986-1998. Doesn’t he have something to say about this? Has anyone asked him?
00
It’s worse than we thought. Judging by your photo, I think that the BOM have adjusted your age(upwards of course). You don’t look a day over forty. 🙂 Many more and thanks for your reporting. Sorry I’m not anywhere near the Sunshine Coast.
SteveT
00
Yep, stations move around, apparently under their own power. My opinion is here.
00
Yes. But he doesn’t believe that bias bit. So the statement becomes null, and doesn’t help you.
But I don’t need his help with the hypothesis. What I needed was for him to confirm that homogenization does not have its intended effect, providing that the dataset in question has a systematic bias. Which he has. (And, after all, he is a primary reviewer of the climate data homogenization process.)
Whether or not that bias does or does not exist is a separate question. (And one I can answer — with a knife in each hand.) VeeV wasn’t looking for one when he did his original work. It therefore hardly comes as a surprise that he didn’t find one. But I am a game designer/developer (whatever else I am not) and I knew where to look.
But this is your personal work, no? Unpublished. Clearly you’ll believe your own mechanism, but you can’t use it as evidence.
Yes, quite. I am not a physicist. The mechanism described on HW is only what I think is going on. VeeV asked, I answered; it’s as simple as that. Anthony is considering bringing in a real one, though. I’ll be quite interested in what he has to say.
You have said previously that you will withhold judgment until peer review and publication. I take you at your word.
If VV didn’t think it worth replying, I’ll defer to him.
That is an inference. He certainly was not what I would describe as coy in disagreeing (at some length) with many other things with which he disagreed.
Not responding, yourself, cannot be charaterized as “deferring” to VeeV. It is merely a lack of response. Ask yourself what would you conclude if you came up with a potentially viable criticism or alternative mechanism — and I didn’t respond.
Scientific discussion is all about response, after all. His response: Nothing. Your conclusion: I am unworthy of response; therefore the mechanism is not only wrong, but to be dismissed without further examination.
But should you respond, I will be most interested. You appear to have been right on airports, after all. My response was to examine the matter more closely. “If the facts change, I change my mind. What do you do, sir?” — J.M. Keynes. The facts have changed. I have changed my mind. Try me.
How’s the gestation going?
Better than you can possibly imagine. We are taking our time and accounting for all of the criticisms received by the 2012 pre-release. We want to be like unto Caesar’s wife: above reproach.
I’d be far more interested on your comments on http://scienceblogs.com/stoat/2014/08/18/happy-second-birthday-to-watts-paper/
Will do.
@diogenese2: Just carrying on from 3000 years ago — looking for Ten Honest Climate Stations. We’re having better luck than your erstwhile nomen, however. We’ve found ~80 (out of over 1200).
Occam’s razor says fraud.
Never ascribe to fraud that which can adequately be explained by confirmation bias. And we all have one. Being wrong is not fraud.
00
It could as easily be change in time of obs, instrument, whatever. But a change.
If it is the box to the east, it is a CRS, therefore no change in instrumentation. If it has been changed to an ASOS, there will be no step change (Menne 2009 & 2010). If it has been changed to an MMTS, that only equates to a ~0.06C step change, which equates to a 0.02 step change over a 30-year interval, depending on what point during that interval the step change occurred. And the trend we are looking at is a century’s worth.
If the change is TOBS, then it will produce a step change larger than a CRS-MMTS shift. But still not enough to justify such a large adjustment.
It would have to be a move from a site that has an effect far more radical than any such shift I have seen thus far (and I have looked at hundreds of such cases). Even if that involved a rating change (as per Leroy, 2010), the subject of our inquiries, it would only produce a 0.14/decade trend effect, going forward.
And the metadata indicates no such move. BoM appears to be going about this ass-backwards.
10
VV did post a reply, here and at mine.
Thanks again for the pointer. As you know, I’ve been there and discussed.
To the rest of you, I do wish you-all would stop picking on Veev and Dr. Connolley. It is possible to disagree without descending to the obvious bathroom humor.
If you are reasonable to them, they will be reasonable back. There is too much heat and not enough light going on in this war. And I keep getting chipped by the stray shots. My work suffers.
You must understand: I need these people. My mind needs them. My work needs them. I have over 3000 hours of effort invested in my surface station efforts. In order to progress, I must push. And in order to push, I must have something to push against.
The VeeV has put out his hand to all of us. I shall not strike it down. It would be infra dig. It would be sans noblesse oblige. And why would I? I disagree with temperature adjustment procedures. Fine. So why wouldn’t I want to hash it out with the very guy who tested homogenization? Why on earth would I pass on such a unique and valuable opportunity?
Dr. Connolley can be quite pleasant and engaging when you are not saying his mother wears army boots. And his questions are apt, even if wrong. How can I tell if he is right or wrong unless I can discuss things with him in a rational manner? He criticized us on Stoat, yeah. And guess what, that criticism resulted in a great strengthening of the surfacestations project.
I don’t care what they may or may not have done. I want reconciliation not vengeance. I want the water to be under the bridge not over it. I am a military historian. I abhor pacifism. But to end a war short of utter obliteration, someone has to stop shooting first. So cease-fire, already! Please. I need the other side. And so do you, though you may not realize it. Let’s get our heads together and figure this thing out.
10
I have spoken with several ex RAAF guys who were based at Amberley in the late 60’s and early 70’s. They clearly remember the stevenson screen being near the back gate at the end of Old Toowoomba Road. Pretty much exactly where it is now.
For interest coord lat -27.633210 deg long 152.712626 deg
20
That is 13m. away from the paved area to the north with easily over 300m^2 heat sink within 30 m. of the sensor.
That makes it a Class 3.
That alone makes it quite improbable that a move would have produced a cooling step change. And, as the man says, there was no move.
The only change would be when the pavement to the north was added, and that would be a warming step change, not cooling.
So it looks as if the BoM is out to lunch on this one. I think it is a fool’s game, this trying to infer metadata from data.
00
@Paul.
You did research and located a station, including nailing down key metadata. That makes you a site surveyor.
All site surveyors, whoever they are, whatever they believe, whatever they have done, whatever they will do, are my brothers.
00