UPDATED, Ken has now finished the full tally of comparisons and the adjustments to minima increase trends by 47% . (Headline changed from 60% to 50% to reflect the shift.) See the new details of the last few stations at KensKingdom.
Billions of dollars, climate models, predictions, and hundreds of press releases depend on the BOM records of Australian temperatures. There were so many inconsistencies, inexplicable adjustments and errors that we put in a Senate request for the ANAO to audit the records. In response, to dodge the audit, the BOM dumped its HQ (“high quality”) dataset entirely, and established a new “best practise” ACORN dataset.
Independent volunteer auditors have been going through the ACORN records — thanks especially to Ken Stewart who is publishing his findings on his site as he works through the set. He’s analyzed 84 out of 104 sites, and finds that ACORN is just as bad as the HQ set. At Kenskingdom he shows that so far, the adjustments used to create the official Australian temperature record increase the warming trend by13% for maxima and a whopping 66% for minima. (Note the caveats in the conclusions below.)
The raw Australian data suggest the nation warmed by 0.6 °C over the last century. The BOM adjustments lift that to 1.05 °C.
The BOM wants the Australian public to think it is impartial, neutral and honest
Some adjustments are necessary. Perhaps these are, but the BOM does not explain on a station by station basis why they are justified. The BOM also claim their adjustments are neutral but a simple comparison with the raw records shows the adjustments themselves create a large part of the warming trend.
The first time around a bias in adjustments could have been inadvertent. But after critics pointed out the inexplicable bias, and the dataset was redone, the BOM issued a carefully crafted wording, that was too-clever-by-half.
For the old HQ set, the BOM said the adjustments were neutral. But contrary to what the head of the BOM said, Ken Stewart found they increased the trend by 40%.
Dr David Jones, Head of Climate Monitoring and Prediction, National Climate Centre, Bureau of Meteorology, stated clearly that the adjustments made “a near zero impact on the all Australian temperature”.
For the new ACORN set, the official CAWCR Technical Report No. 04 carefully wordsmiths their position on adjustments so it is technically true, but misleading at the same time:
“There is an approximate balance between positive and negative adjustments for maximum temperature but a weak tendency towards a predominance of negative adjustments (54% compared with 46% positive) for minimum temperature.”
The number of positive versus negative adjustments is not what matters. What matters is the change to the trend. The size of the positive adjustments is a lot larger than the negative ones. It’s not balanced at all.
A few examples of unexplained adjustments:
Ken Stewart has analyzed 83 ACORN sites of the total 104 sites.
Figure 4 shows my plot of annual mean minima for the same period (calculated as a straight average- the BOM graph is area averaged) for 83 sites ‘raw’ compared with Acorn.

Figure 4:
The average difference between raw and adjusted records shows a strange pattern (see Figure 5 below). Apparently the thermometers before 1971 were recording temperatures that were overestimating temperatures. Generally the better modern thermometers after that were underestimating the temperatures. What bad luck!
In addition, the urban population grew, cities retained heat, and airports got more traffic and larger tarmacs. It makes sense (if you are bonkers) that those thermometers near hotter bigger buildings and more bitumen would shift from a “warm bias” to a “cold bias” right? Really…
Note: the ‘raw’ trend is +0.63 °C per 100 years. The adjusted trend is +1.05 °C. The difference of +0.42 °C represents an increase of 66.6 %.
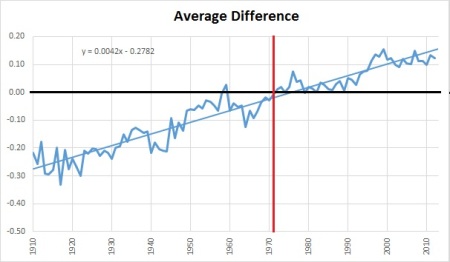
Figure 5 is a plot of the annual average difference in temperatures.
Note there is only one year (1959) before 1971 that has on average greater positive adjustments, and there are no years after 1971 of average adjustments below zero. In other words, the record before 1971 is cooled and after 1971 it is warmed.
The maxima anomalies also got warmer, but not by much — though we note they start in 1910 — the coldest year in many places around the world. (I’ll say more on that soon).

Figure 8: Annual mean maxima for 84 sites (‘raw’ vs Acorn)
Acorn adjustments have increased the maxima warming trend by +0.09C, or 13 %.

Amberley in Queensland
Conclusion
While the number of positive and negative adjustments made by the creators of Acorn may be balanced or nearly so, their effect on the minimum temperature record is enormous. Analysis of a not insignificant sample of 83 of 104 Acorn sites shows a warming bias in adjustments to minima of 45 %, which has the effect of increasing the network-wide temperature trend by 66.6 %. The adjustments have predominantly cooled pre-1971 temperatures and warmed post-1971 temperatures. For maxima, the increase in trend is 13 %. This result casts doubt on the veracity of the Acorn temperature record, and its usefulness for climate analysis.
Please note: I make no judgement about the justification or lack of it for the individual adjustments. Nor am I claiming that my calculation of +0.63 °C per 100 years is the true trend in minima for Australia. Far from it: that figure is based on only 83 stations, not evenly distributed, many of which have much less than 100 years of data and/or many years of missing data. I’m saying no one knows for sure, but that the adjustments to the ‘raw’ data at CDO, in order to create the Acorn dataset, result in a massive and unexplained difference.
I welcome any comments or arguments that can show how I may remove errors from this finding, or how I may improve my analysis.
The bottom line is that obviously Australian temperatures have risen in the last century, but by how much? The trends are fed into global climate models, they’re used to estimate climate sensitivity, and forward projections are based in part on previous rises. Then there is the constant hammer of press releases trumpeting headlines with “records” that sometimes depend entirely on the adjustments.
It is time it was audited properly.
Posts on Australian Temperatures


BOM are “Warmist” to the core – after the CT is gone post July 1 2014, and that looks odds on after the PUP’s leaders comments earlier today, Tony needs to inform the powers that be at the “CAGW obsessed BOM” that the “CAGW obsessed ALP” have been gone for nearly 9 months now. BOM have to be brought into line – enough is enough. They are becoming like the UKs Met Office – a puppet of the IPCC. Global Temps have been stagnant for 16 years now despite CO2 in the atmosphere rising by 10% – the hard numbers say that CAGW is a fantasy – the likes of BOM, the Met Office, Cameron, Obama etc need to take head of the “real evidence” – in due course history will be very unkind to their legacy. They are playing “Russian Roulette” and are on a dead set loser promoting CAGW.
400
Yep, let’s keep cycling through BOM staff til we manage to populate it with competent, scientifically-literate climate change denialists!
Although by the time we’ve pulled off that epic feat of infinitesimal probability, the sun will have reached red giant status, rendering such an organisation obsolete.
459
“Yep, let’s keep cycling through BOM staff til we manage to populate it with competent, scientifically-literate climate change denialists!”
That is exactly what they have there at the moment !!!
Thanks for bring that fact to our attentions Steve.
391
bringing !
41
except they are not competent, they are INcompetent.
And the current crop sure do seem to be scientifically-ILliterate
161
Sorry.. I saw the word….”BOM”, and immediately read what followed as INCOMPETENT and SCIENTIFICALLY ILLITERATE.
gees did I stuff that up ! 🙂
But Steve is right, BOM will never fill its ranks with competent, scientifically-literate scientists.
111
Time for bed.. been a long hard days work..
You should try it some time , Steve.
Get out of your grandma’s basement and actually go look for a job.. or something……. anything.
51
Ask not who called the BOM, Scientifically Illiterate.
Ask who called the Scientifically Illiterate, BOM.
31
@Steve – sometimes it’s wise to use the /sarc tag…. some people may misunderstand your humour.
70
I was wondering how he managed to get 25 red thumbs…
11
An epic feat of infinitesimal probability because nobody denies that the climate changes. You’re unlikely to find any competent scientist who doesn’t believe that we are in an interglacial period of an ice-age (the climate changed if you’re too stupid to follow).
Isn’t climate change denier someone like Michael Mann ie, if it wasn’t for man, the climate wouldn’t change?
60
I am troubled by one simple problem. How many people have to be “in” on the con at the BOM to make it all work? If there is a small cabal or whatever you want to call it, how come the real meteorologists still working at the BOM do not speak up?
00
Actually, this is much simpler than you think. Generally, it only has to be those with the ability to hire and fire. So speaking up means saying goodbye to your paycheck. Happens a lot.
Before everyone jumps in an says “scientists don’t do that”, consider how many doctors practice for years will being very bad physicians. How many cops operate outside the law for very long periods? Everyone can probably come up with more examples. If one does speak up, the immediate response of the guilty parties are to deride, slander and otherwise make life miserable for the “whistleblower”. Even with laws in place to supposedly protect such persons, there’s really no protection.
I don’t know if Australia has the same problems as the US, but in the US a sports team owner was forced to sell his team for making “racist” remarks (same thing he’d done for years), a CEO of a computer firm was run off for having voted “anti-gay” 8 years ago, etc. So who in their right mind calls out the BOM and says “hey, my boss is adjusting the temperature records and there’s no good reason”. The guy/girl would be called an idiot, fired and everyone would be told this person is scientifically illerate, or too stupid to understand, etc.
Are you getting the message here?
40
Sheri, I have a friend who was a senior manager in a section of the BOM before he retired, who told me back in the 90s, that the BOM had been ‘correcting’ records for years. There are two sites that I know of that had records going back to the late 1800s, where now you can only find temperature records from the late 1960s. The rainfall records are still there, but the temperature records have disappeared.
00
Actually, this is much simpler than you think. Generally, it only has to be those with the ability to hire and fire. So speaking up means saying goodbye to your paycheck. Happens a lot.
Before everyone jumps in an says “scientists don’t do that”, consider how many doctors practice for years will being very bad physicians. How many cops operate outside the law for very long periods? Everyone can probably come up with more examples. If one does speak up, the immediate response of the guilty parties are to deride, slander and otherwise make life miserable for the “whistleblower”. Even with laws in place to supposedly protect such persons, there’s really no protection.
I don’t know if Australia has the same problems as the US, but in the US a sports team owner was forced to sell his team for making “racist” remarks (same thing he’d done for years), a CEO of a computer firm was run off for having voted “anti-gay” 8 years ago, etc. So who in their right mind calls out the BOM and says “hey, my boss is adjusting the temperature records and there’s no good reason”. The guy/girl would be called an idiot, fired and everyone would be told this person is scientifically illerate, or too stupid to understand, etc.
Are you getting the message here?
00
That was all very worth saying twice 😛
00
K.G.
Not just the BOM but the CSIRO as well. Tony worries me a little. On the one hand he’s against the ‘Carbon tax’ on the other he seems to believe in “man-made” climate change. Also every night on every Australian TV channel, weather forecast imply that the current weather patterns are abnormal. How does one combat such mass ‘brain-washing’? I get no end of criticism from ‘friends’ on Facebook because they are so ‘brain-washed’ that they can’t tell the difference between real pollution (CO, NOx, So2, and particulates) and harmless but vital CO2.
R-COOK- K+
Ron Cook
261
Ron
The CSIRO are divided into a couple of camps. There are the useful ones and the ones Megan Clark likes. The useful ones (who work with industry, make useful things, use science) are being slowly strangled. They are also expected to rip of industry so that the money can be siphoned off to the non-useful courtiers whom Dr. Clark entertains.
As to Tony Abbott. When the chips are down, he was prepared to stand up to Turnbull (that ponce) and just say it like it is:
Refreshingly honest and a most Australians will line up behind him once they understand where he’s coming from. A true Aussie hates being patronised by the likes of Wong, Shorten and Flannery.
Abbott has a whole lot in common with the average Australian that does the average Laborite union hack / shonky lawyer we get in parliament these days.
Cheers,
Speedy
141
Ron,
Don’t forget the real greenhouse perpetrator in all this:
Dihydrogen Monoxide.
91
Oh, and Oxydihydride.
10
NO James,
DHM does not cause warming of the atmosphere. It is an energy transfer substance that acts as a COOLANT.
21
Ron, in case you missed it.
In December 1986 the Hawke government removed the committee of scientists who managed the CSIRO and installed a new board, with Neville Wran, the National President of the ALP, as chairman. He was the first non scientist to chair the CSIRO.
This act made the CSIRO a partisan organisation.
They put their own brand of “political scientists” in charge of the real scientists.
30
I know people who are believers in ‘Climate Change’ due to CO2 produced by man, who couldn’t tell you which way the wind blew around a pressure system, or could read and understand a forecast, let alone a synoptic chart. Yet these people believe every piece of c**p put out by Flannery et al.
00
The sad thing is that in the private sector this sort of data distortion results in hefty lawsuits and public disgrace.
On the other hand, in the world of government bureaucrats, you get promotion for aiding and abetting the whims of your left wing political masters.
The historic GISS temperature statistics suffer from a similar ‘homogenisation’/manipulation/torture.
As always, to prove the case for CAGW, you have to grossly manipulate historic data and/or dodgy, biased computer models. Will it ever change?
Steve and the rest of you alarmist trolls, you really have a lot to be proud of – sarc off.
80
Reminds me of that game where by the put a pea under one of 3 cups and then shuffle it around and you try and find it….
00
And you never can, because the magician has palmed the pea so, whatever cup you choose, you always loose.
Doesn’t that sound like modern politics?
10
Royal Commission or Auditor-General time.
Thanks. Last line just added to the post. – Jo
210
Unless this is a false claim then that should be a very cheap and easy job.
“An extensive audit trail of data and metadata keeps track of corrections that may need to be applied.”
http://www.bom.gov.au/climate/change/acorn-sat/index.shtml#tabs=Methods&-network=
30
How long do we need to put up with propaganda from the BOM, CSIRO, ABC, a plethora of “Climate” agencies and a not least, the ARC and other funding sources that feed the climate scam? The days of providing a diligent, honest and professional “pubic service” have faded into history, but why? How far has the line of integrity shifted from what is public good to public misdemeanour, or much worse?
Perhaps Abbott and Co would do well to establish a Royal Commission into the science of global warming to determine where the line dividing honesty from deceptive and misleading conduct lies, as a basis for developing sound economic policy. It’s time to shine a strong light on the less than honest behaviour stemming from agencies, organisations and individuals funded out of the public purse who have conciously and willing crossed the line into political activism.
If perpetators were held to account and suffer public humiliation for their behaviour, with loss of employment, and a big broom pushed through, it would do a lot to restore public confidence in the integrity of science in government, in contrast to the voodoo science we pay for now. And the great unwashed, brainwashed by the ABC, CSIRO, BOM and a multitude of other hacks, would be more enlightened as to the truth and get a better return on their taxation investment.
160
Realist,
See my reply to King Geo. Generally the media has ‘brain-washed’ the population into not being able to discern “real” pollution to essential, but harmless, CO2.
R-COO- K+
Ron Cook
40
What a really needed here is not so much a RC into this but rather a public enquiry into science funding. Commissioners, Bob Carter, William Kinnimonth and David Evans.
The funding of science is biassed toward funding that has a payoff (applied science) this causes scientists to grasp onto disasters to stave off – like global warming – in order to bias funding to their discipline. We need a new way, and we need an enquiry to develop it. ARC needs to go and be replaced with a new mechanism. Also we MUST stop the practice of evaluating research based on It’s outcome – this means you have to have finished the research before you can ask for funding…. thats NUTS. I want to stop that dead in it’s tracks.
20
I agree totally with these comments;The reality is that these Australian BOM records are used as the ‘Official’ Australian temperatures and supplied to the IPCC. And the data set used for this has been deliberatly tampered with in order to produce/obtain a biased and dishonest result. A Royal Commission to enquire into this is required urgently and the governement must act now! Those responible for the deceipt should be outed for all to see. Geoff W Sydney
20
I’m sorry, but adjusting(changing) data no matter for what ever reason is unconscionable. People get fired and sued over changing data. I’ve had an employee sacked for altering data. YOU JUST DONT DO IT – if the data is wrong you don’t tweak it – you publish the data with caution or you just don’t publish it because its faulty. Same as smoothing the results between two weather station sites. You move a weather station from one site to another 3 ks away and then smooth the data to smooth the transition. – Wrong! You publish both sets of data and point out its from different data acquisition points, you don’t change the data to suit! I hate data manipulation and the poor excuses that go with it, its wrong, its unethical it’s unconscionable. If the data is questionable you don’t use it, you get new data if you can’t get new data – you don’t go changing it to suit! It really gets on my goat – if you cant tell.
531
Please don’t tell them that if you remove extraneous data, you can really boost the correlation co-efficient.
If they twig to this, they’ll be like the kids in the lolly shop.
10
Yes, I’ve always wondered why adjustments are permitted at all.
If adjustments are needed for some reason or other, and let’s assume it’s genuine and appropriate, then the adjustment data and code should be part of a separate addendum file of some sort.
Otherwise, how is future research on a data set supposed to be replicable when the underlying data has changed.
It’s a bit like getting a speeding ticket dated last Monday because someone decided to change the speed limit sign the following week!
70
I was under the impression that the adjustment were made specifically so the data sets would conform for computer modelling.
21
liberator – Ken is comparing two datasets that are both published by the BOM – one is called raw – and it is as you suggested, a mixed bag of stations. They other is the ACORN-SAT compilation. The raw data does need some form of adjustment and splicing to compensate for station moves and equipment changes. The problem is the BOM do that, but don’t publish the reasons for each station, or supply specifics when asked, AND then there is also homogenisation and area averaging as well, so there is a lot of processing.
We do wonder though how raw the raw data is. The true raw data is probably handwritten notes on sheets until the electronic systems came into play.
70
I understand that some adjustments have to be made, but shouldn’t the unadjusted data also be available for verifying the correctness of the adjustments? I was always taught that if you adjust data, you must provide the raw data, the adjusted data and a detailed explanation of why you adjusted said data.
70
Sheri, that was my point in #4.3. The BOM has made both sets of data fully available.
The problem is that the adjustments to individual stations are not explained and some of the changes are major. When we ask for details that would justify the changes — they are not forthcoming.
Perhaps these adjustments are legit, but it is certainly not obvious from the raw data and information supplied why some of them are. Sometimes cooling trends become warm trends. There must be a reason?
And there is the claim that the adjustments are “balanced”.
If the BOM have done an honest thorough job, they would be happy to encourage a formal independent review.
120
So the BOM raw data is out there. It’s missing the part where they explain why they adjusted it. So we have the first two items I listed, but not the third. Got it.
70
It’s not enough to be honest – You must also be seen to been honest.
It’s the way they refuse to be held accountable, that triggers alarm bells with the average person.
30
I think what rings alarm bells the loudest is that you have Amberley (the Air force base?) where there is no obvious discontinuity in the data due to changes of positioning or equipment but its been adjusted as if this occurs every year. This is something that is valid for compensating for UHI effect except that data seems to have been adjusted to create the trend from a UHI effect. Surely adjustments are made to negate it not to make sure that it shows up in the data.
30
Hi Vic
Actually there is a discontinuity in the Amberley minima record around 1980, and so there is an argument for making adjustments to compensate for this, but the amount of the adjustments (which are applied increasingly all the way back to the start)is questionable. Amberley’s new trend of +2.52 is now greater than that of the mean of the 6 neighbouring Acorn sites (raw data) for the same period (+1.73).
I make no value judgements about the adjustments in my post, just that their effect on the whole network (not just one station) is so enormous.
Ken
31
Thanks Ken,
it is obvious on a second look but still pretty small to correct without knowing the history of the site.
It still amazes me that its assumed that such small discontinuities haven’t averaged out to be negligible. Instead a increase in the trend is added that seems to correspond well with the amount of heating in the last century that can’t be attributed to the climate naturally oscillating.
00
What TF are you talking about?? What is “the amount”? How do you reconcile the obviously natural warming in the Roman and Medieval Warm Periods which was significantly MORE than the past century? How did that happen?
00
The bit that doesn’t fit a simple sine wave. Why the current mean is not the same as 1942.
00
Jo: “And there is the claim that the adjustments are “balanced”.”
Watch the pea here Jo – the adjustments average to (near) zero. So they are balanced. They also introduce a trend.
This is the equivilent of the politician proclaiming “we are spending more than ever on ” when they know costs are out of control – it’s deliberate mis-direction that sounds like they are doing the right thing, even when they know it’s the wrong thing.
11
Kind of like calling a decrease in the raising of spending “a cut”?
10
But in the end, they will just say as my young nephew did when caught being naughty: “I didn’t know that I did it!”.
00
The reason “Johnny” can’t read is that politicians keep changing the meaning of words.
00
Agree, with Gayndah Qld there was 6 years overlap between the Post office and the Airport which showed up 0.2 UHI for the Post Office (2km difference)but the Airport has its own UHI. But, the 120year record (from 1894) is not part of ACORN. In the record for the PO some small jumps are noticeable (one around 1972 & 1995 particularly the minimum) due to urbanisation (maybe sealing of the main street, buildings near the post office, air conditioning etc)
As Ken says and has been found by Antony Watts in USA there are few stations of a consistently high standard to measure temperature changes. One of the biggest changes was in instruments from mercury in glass max -mins to electronic recording of resistance “thermometers” which normally have not been calibrated on site. A 30 sec peak reading can occur for many reasons (even an electronic surge) and is very much different from the movement of marker by the mercury in a glass thermometer. which is much more like what a person might notice.
For Gayndah there is no significant difference between the 1890’s decade of max temp and the 2000-2010 decade but there is about 0.8C increase in the min temperatures for the same periods.
20
Most likely building- the main street has been bitumen since at least 1950s.
10
Anyone fathom why daily temperatures would be changed as follows? This is a sample from Adelaide raw to acorn.
Eg. Here are the changes from Raw to Acorn for Jan 1910. Anyone capable of working out this algorithm?
-0.3
-0.2
-0.3
-0.1
0.3
0
-0.3
-0.3
0.9
-0.1
0
-0.1
0.2
-0.2
-0.3
0.2
0.2
1
-0.1
-0.1
0
-0.3
0.9
-0.2
0.3
0.3
0.2
0.4
0.4
0.1
00
“He knew control of politicians from a multitude of nations was almost impossible so he worked through the World Meteorological Organization (WMO) to control the bureaucrats in every national weather agency.”
Thats a little from the link.
A wander over to wattsup at the link tells you exactly why the BOM is misrepresenting our temperature records.
We are not alone when it comes to manipulating temperature records to further the fraud.
http://wattsupwiththat.com/2014/06/08/opinion-global-warming-claims-are-primarily-and-deliberately-a-product-of-bureaucratic-political-activity/#more-111080“>
“
40
I have quite regularly posted graphs from Ken’s site, showing PARTICULARLY the warming that has been CREATED from cooling trends ESPECIALLY in rural areas.
Some of the worst are Wangaratta, Benalla, Echuca, and in fact all through the warm inland parts of VIC, NSW and QLD.
These are the very areas that they used to CREATE all their “warmest ever” nonsense.
Massive cooling of the past to create a massive warming trend…. like in that Amberley graph.
IIRC it was actually a student of Phil Jones at Hadley CRU that somehow managed to first CORRUPT the raw data..
(and you KNOW the tricks Jones and Hansen used to get up to with GISS and HadCrut)
And now Gavin Schmidt has taken over from Hansen, so ……
.. it just continued from here.
141
the Griss:
You must realise from the Giles station 1997 results where 359 days minimums were read wrongly and had to adjusted, by up to 1.5℃, and that by ‘professional staff’, that the BoM doesn’t really know what they’re doing.
As proof I point to Peter C’s comment No.7 and David Jones of the BoM claiming ‘”and the Australian data is in pretty good order anyway”. And WHAT did the author of HarryReadMe have to say about the australian data?
You see, it is just monumental (and costly) incompetence.
10
And BOM don’t trust the records of post masters pre 1910 even though they used the same equipment as post 1910. Coincidentally, there were some nasty summers in the two decades previously for SE Aus.
20
Just in case anyone has forgotten, or if they did not know in the first place, this is the text of an infamous climategate email from David Jones (Australian Bureau of Meteorology) to Prof Phil Jones ( University of East Anglia).
David Jones is still at the BOM and Phil Jones, having been exorerated by saeveral enquiries into the climategate scandal is still head to the UEA Hadley Research Unit (as far as I know).
210
“Almost everyone of our cities is on the verge of running out of water”
It was a long drought.. ITS AUSTRALIA, FFS !!!!
And then it RAINED. 🙂
ABSOLUTELY NOTHING TO DO WITH CLIMATE CHANGE!
201
Actually, a whole lot of the water supply problem was because there hadn’t been a major dam built form many , many year..
And who’s fault was that…. may you ask??
THE GREENS !
The blocked Welcome Reef,
They block the Mitchell River dam,
They blocked the second dam major dam for Brisbane (Wolfdene?)
They blocked Tillegra for Newcastle.
The ONLY people responsible for most of the water supply issues were the MORONIC, ANTI-DEVELOPMENT GREENS
271
Thank you Griss for pointing out the bloody obvious – if over a 30 year period the population of the cities increases by over 50% and you don’t build new water harvesting and storage systems you will experience more water shortages – regardless of whether climate change is real or not. (I am still not convinced it is real). Why is this so hard for some people to get their heads around?
91
If you set incompetence aside then you would almost think that the actions to stop the building of dams was part of a long term plan to push the AGW agenda because of predicted water shortages during future droughts.
Or is that just giving them too much credit.
21
Peter Beattie won government in Queensland by blocking a dam in Ipswich (forget the name). No new dam was built during his reign until we got a long drought in 2006.
It giveS the impression to me at least, not just of incompetence, but of wilfully causing the situation with the intent of making a crisis.
It was soon after 2006 when he forcibly took water supply out of the hands of the local government. Then waisted huge sums on a desalination plant on the Gold Coast, a water main linking Brisbane and the Sunshine Coast, and fart-arsing around with the Traveston dam wasting another $900 million. Which demonstrated to everyone in Queensland that Labor were idiots and were voted out with a vengeance.
70
Way too much credit. !!
They have a mish-mash of moronic “policies” with basically no thought or care of the consequences of any of them.
31
“Australians now rate climate change as a greater threat than world terrorism”
Yes in the hands of the IPCC and useful idiots like this perpetuating it’s existence I fully agree with this statement.
20
I was listening to a guest on one of the radio talk shows last night. He compared our current regime to the Mafia. His rationale.
Obama does not say, or write a memo, that directs the IRS to break the law in persecuting groups that he does not like. Like a Mafia Don, he merely expresses an opinion “I do not like the Tea Party”. His IRS Capos then run out and make life miserable for them. So Obama is of course clueless about what is going on (if you listen to him, he has no clue what is going on anywhere in his administration).
The guest is of course correct. One of the “scoffing” points of alarmists is “you think all these people are getting together to conspire to create a hoax?” with the aim of denigrating you if you say yes, then laughing at you if you say now and saying it must be global warming.
But there is a 3rd choice. The mafia. There is no conspiracy. Just people that look for hints from their high priests on what needs to be done, and then doing it. No one from East Anglia directed the BOM (or GISS) to adjust the temperatures in that way. But I do recall someone opining (to no one in particular) that the “pause” is “problematic” and it is a worrisome that they cannot explain it. As far as I know, no one told anyone to go out and eliminate the pause. But then we are dealing with intelligent fools. They do not need direct orders.
So the trends are changed, and no warming becomes a warming trend. There is not a master control room directing all these rats to run around and adjust temperatures up in the present (and down in the past). They just independently do it on their own.
No, not a conspiracy. Just a mafia.
110
“No one from East Anglia directed the BOM (or GISS) to adjust the temperatures in that way.”
Actually Phil, I think you will find that the guy mostly responsible was a student of Phil Jones from Hadley CRU.
Name escapes me at present.. Stott???
11
Sorry Phil.. The guy I meant was the guy who started the “adjustments” in Australia.
Climategate, however indicates communications between Jones, Wigley and Hansen.
Something about “we have to get rid of that 1940’s peak”….
21
There are several people, around the world, that are doing it. The fact they are all doing it the same way does not mean they met in a smoke filled room to plan it – only that they saw the meme, knew what had to be done, and did it.
It is a spin off of plausible deniability. Mann did not send out orders. Nor did Phil Jones. But the “grad students” knew what was needed and figured to ingratiate themselves with “the Don”.
30
Phil, I cannot agree … given the ill-explained adjustments to the records in the USA and the UK (follow the blogs), and here by the BoM, the modus operandi appears consistent AND we know from Climategate that these hooligans do collaborate closely. It would not be in the least surprising to learn that the same methodologies and propaganda is applied by the BoM.
21
YOu may be correct. Or it just may be the old adage “do not attribute to mal-intent what can also be attributed to stupidity”.
They know they have to do it. Just because they are bad at covering their tracks does not mean they have the same orders.
00
Jo, It’s not at all obvious temperatures have been rising over the last 100 years. That is too simple a comment. Rising from 1960 to 2000 or 2002, and now cooling again. More info at http://www.jennifermarohasy.com .
00
Emily, I’m referring to 1910 onwards. Its a fairly safe statement. Even Ken finds a warming in the raw data of 0.6C.
20
If and I mean IF there was to be any future criminal investigations into CAGW money fraud where would that place any media outlets that knowingly participated?
Any media accused couldn’t use “We just released what we were told” as an excuse for the very nature of their job which is to use impartiality, fairness and public accountability.
Even though most of the population would laugh at the last line I wonder if they would laugh knowing how much public money was wasted/rorted or their cost of living rose due to media aiding and abetting such a blatantly greedy agenda?
30
If a Journo can give a reference to the person interviewed or the press briefing attended, then they can simply claim that they were reporting what was said.
Unfortunately, in places where interviews are conducted, or press briefings are held, there always seems to be echos, that make it hard to accurately hear and record everything that is said.
Life for a journalist can be really hard sometimes … speaking of which, it is nearly time for a beer …
10
Looks like you’re losing guys…
http://www.smh.com.au/environment/climate-change/australias-emissions-cut-target-triples-overnight-thanks-to-failure-to-repeal-carbon-tax-20140602-39esv.html#ixzz33pV7Km8e
——————
Thanks for that BG. If you are Australian, the correct way to phrase it is “we’re all losing”. The whole nation loses. I’m sure that the legislation can be over-ridden. The only question is how much more will it cost Australian to fix that damage? – Jo
111
Let me guess BG. You live in a yurt, grow your own veggies and don’t use electricity, drive a car etc. etc… right?
If not, can you please explain why not?
72
Hang on who cut down trees to make the yurt. How were the nails, screws, windows, brunswick green paint and roof sheeting manufacured? No yurts! Must live in a cave to be that guano crazy that a target for self destuction and a future without oxygen seems like winning.
31
And this is precisely why the Gillard government and its childish cowardly grovelling to the moronic Greens was such a monumental disaster for all Australians.
Its going to take a while to remove all the stench !.
61
Brunswick Green,
Interesting name, it’s pretty much the colour of bile, you know the stuff that you spew out once there is nothing left.
Yep – pretty much sums up the entire global warming belief system.
21
Isn’t Brunswick a place near Melbourne?
I have never visited, but I am told that all the people look strangely the same …
11
Right next to Adam Bandt’s electorate.
Brunswich Rd is all that separates them.
GanGreen headquarters.
11
Brunswick a suburb 4kms North of Melbourne CBD while not considered an affluent suburb is now after Brunswick Greenie’s representation considered effluent.
20
Wow I had actually written spew efluvia and scrubbed it – spooky.
01
James great minds…..but hey I guess when discussing CAGW/Greens, bodily emissions are sure to come up.
21
No, I have just done a check, and none of the guys have been lost or misplaced. I think a couple of the females might have gone AWOL for a shopping lunch, but hey …
20
I just love our new batch of high school students because they don’t know how to use commas.
10
As a purely off topic subject that has recently intrigued me and it is the number of feminine skeptic blog operators and all of them very prominent blogs that are way up in the climate blog standings, compared to the hard line alarmist blog scene where there are only a couple of female run blogs that are of a reasonably known status.
There will be others but I don’t know of them
Female run Skeptic blogs;
Jo Nova’s
Judith Curry’s, Climate Etc; steadily trending skeptical.
Jennifer Marohasy
Donna Laframboise, No Frakking Consensus
Luke warmers;
Lucia Liljegren; The Blackboard , a luke warmer.
Warmers;
Tamsin Edwards , a climate modeller and good value ‘; All models are wrong
Rabid off the planet warmistas;
Hotwhopper blog
00
And the AAOL women are shopping for power tools and SUV’s?
00
There is a heated discussion going on at Lucia’s Blackboard blog [ How not to calculate temperature ; This is a crack by Zeke Hausfather at Steve Goddard who has questioned the constant upward trend in global temperatures. The whole argument is very illuminating as to the attitudes and the arrogance of those who are supposedly responsible for the recording of those constantly changing temperatures going right back to the early 1900’s. Their attitude is that they are right no matter what and despite the problems being pointed out .
At the moment with Zeke Hausfather and Nick Stokes and other assorted climate luminaries are having to do a heck of lot of shuffling and explaining on in-filling over some hundreds of kilometres radius around stations that don’t exist.
In-filling of grid squares in the computer programs that don’t have and have not had any stations in them ever [ 79% of the world ie Oceans. ]
They can’t even seem to get the numbers of stations right with various numbers being thrown up and considerable discrepancies between the numbers of the very significant decline in GHCN [ Global Historical Climate Network ] stations.
An example is provided for Hawaii where a station has not supposedly reported for well over a year but automatic infilling has increased the official temperatures at that former station very significantly.
The reality is that the station is still in full operation, has been reporting exactly as scheduled over that same supposedly non reporting period and all the data is there and has been seen by some of the skeptics but the official position is that the station no longer exists and therefore it’s data, current as it is, is not incorporated into the official global and US temperature data record.. And the actual measured temprature trend at the station over that year, unlike the official in-filled record, is going nowhere.
You really have trouble believing some of the sheer bad science that is being carried out in the recording of global temperatures and trends, if any, and the arrogant audacity of those who are doing that recording in the manner in which they claim they are totally and absolutely right in doing it the way they are when all the problems are pointed out.
This Blackboard argument is throwing up a huge number of very seriously bad examples of constant adjustements to the global temperature data base going back into the early 1900’s .
Hausfather and his supporters are claiming the actual temperature doesn’t matter, it is the anomalies that count which to my mind if he did that with his income figures he would’nt know where the hell he was financially in very short order.
In short as far as reality in the real world and not the self centred academic world that he and his mates appear to inhabit he is talking total crap.
If the radio report said that the temperature anomaly tomorrow is 10 degrees above the standard anomaly [ which changes every decade or so according the the length and period of the base time span used. another adjustment is then needed and done ] you wouldn’t have a clue as to what the temperature was going to be in reality tomorrow and whether to expect raging bushfires or a nice pleasant winter’s day.
The real problem seems to be the adjustments at the so called “break points” in the temperature record and that is brought up time and time again in the Blackboard argument.
Break points are when there is a rapid or sudden shift in the record such as the excellent post on WUWT by Bob Dedekind who explains the break points when trees are cleared around a station
[ Why Automatic Temperature Adjustments Don’t Work ]
You get breakpoints when say a statiion is moved which many of the stations in the GHCN have been moved two or three times or more.
Generally the move is away from a steady encroachment of a increasing in size metropolis with it’s increasing temperatures over the years to somewhere further out .
The consequences are nearly always a sudden drop in temperatures as the Urban Heat Island [ UHI ] effect is exchanged for the cooler temperatures of the more rural environment.
When a station is moved it gets another break point due quite likely to a change in altitude, going higher means cooler and contra when going lower.
These types of “break points” a very common one to all older stations and with automatic adjustments that don’t appear to have ever been thoroughly researched for their effects on temperature trends. note I said temperature trends, invariably lead as in the WUWT post, to cooling of past temperatures and spurious warming trends that simply don’t exist in reality at all.
For an excellent example of a heat island effect this post from the NoTricksZone blog [ Urban Heat Island at Providence Rhode Island ] provides a graphic example of the heat being generated within a major city where some of these GHCN and USHCN stations are located or have been shifted out from leading to a large break point in the temperature data. with the automatic correction for the break point effect, we then have a very large and tot[tally spurios warming trend for that station.
For a couple of examples of the type of spurious always upward trending adjustments to the temperature records of both global and individiula stations; Paul Homewood of the Not A Lot of People Know That blog has done a series on the GHCN adjustments to Iceland’s temperature data.
Iceland has records going back to close the the English CET and Irelands The Armagh Observatory Climate Observation Data (1796-present)
[ Iceland Temperature Adjustments–GHCN Still Have Not Started Investigating
[ GHCN Temperature Adjustments In Iceland–A Closer Look At Stykkisholmur–Part I ]
More on the GHCNH Iceland adjustments this site.
Also this animation of Hansen’s attempts to inflate global temperatures while he controlled NASA’s GISS climate center.
C3 Headlines ; Fabricating Fake Temperatures
From the very respected Proff Ole Humlum’s excellent and comprehensive Norwegian [ skeptic ] site Climate4You go to the “Global Temperature” panel from the LH menu and then scroll down to find the NCDC [ National Center for Data Collection where everything climate data first goes to and starts getting {self snip } up ] ever expanding differences to the anomalies for in this case 1915
The whole of the temperature records that underlay the entire claims to a warming planet are so distorted and corrupted and becoming more so every day that goes by and will continue to do so without and unless there is a dramatic change in attitudes by those so called scientists who are responsible for maintaining the global records.
But while the current corrupted methods and systems of processing the recorded temperatures continues to support the agenda that many of these scientists subscribe to nothing will change.
Sadly so much of those old temperature records are now becoming irrecoverable as more and more gross distortions creep ever further into the climate science system that is responsible for maintaining, processing and keeping in good faith, the records of mankind’s past in climate and weather.
In fact Phil Jones, head of the Hadley Climate Research Unit claims he has lost those old records on which some of the im-famous and now abandoned Hockey stick and the whole of the original claoms of a catastrophically warming planet were based.
And 90% of the problem is nothing more than rank arrogance of those who refuse to admit that they have created a programming monster that has suited thier agenda and their ends but is destroying the very thing they were appointed to keep on behalf of whole of mankind.
My contempt as somebody who pays for this crap and for those so called scientists is palpable.
170
You might want to remind them that linear trends are rise over run. If the trends are adjusted then the differences ie. anomalies, have been adjusted.
20
This thread is on Australia’s BOM’s manipulation of the data relating to climate research
However the BOM uses the methods that are common to the entire global Climate data adjustment system, adjustments that are necessary to get some useable practicability into the data base so it can be used for both public and research purposes.
However these adjustments to data now appear to have become a means to an end where the responsibility of the data organisations, the NCDC to record the accurate data for the research and public use and for the future has been subjugated to the desire to impose the belief of a catastrophic warming of the planet is underway due to mankind’s emissions of CO2.
[ National Center for Data Collection run by Tom Karl, a near fanatic in regard to CAGW and a member of the original Hockey Stick Team as they called themselves and as such a compatriot of Mann. Don’t ask Roger Pielke Sr what he thinks of Karl ! ]
The original processing of the incoming data at the NCDC uses algorithms which do not appear to be available for independent scientific examination or for which there doesn’t seem to have been any independent analysis of the effects of the NCDC adjustments to the data record.
Further adjustments to the data are then made when HADCRU, NOAA and GISS get their hands on that same data so the real record of actual temperatures as measured by observers and automatic stations is pretty well lost by the time the climate researchers have processed the data in their climate models and for their always, unsurprisingly, wrong predictions for the future in climate trends.
To further illustrate the very real problems I referred to in my above post and to back up liberator’s , you don’t ever manipulate the original data in his post @ # 4, I will quote parts from a couple of posts in Lucia’s Blackboard thread “How not too calculate temperature”
Post 130032; Bill Illis who has generously provided me with some very useful information in another forum;
And then this from from RobertInAz (Comment #130035)
On the number of stations in the GHCN network’;
angech (Comment #129994)
And perhaps the most damning quote of the lot and showing the attitude towards keeping accurate records that actually reflect the real as measured on ground temperatures and not the artificially inflated temperatures which are both modeled using NCDC algorithms which nobody seems to have independently verified, and which subsequently are used in climate models which in turn churn out fictitious claims of temperature increases that don’t actually exist and on which the entire rational for the immensely disruptive and economy and social cohesion destroying climate warming CAGW ideology and dogma are based.
I will use a quote from Bob Dedekind post on WUWT [ Why Automatic Temperature Adjustments Don’t Work ] which is an analysis of ; Zeke (Comment #130058)
__________
[quoted ; my bolding ]
In a recent comment on Lucia’s blog The Blackboard, Zeke Hausfather had this to say about the NCDC temperature adjustments:
####
“The reason why station values in the distant past end up getting adjusted is due to a choice by NCDC to assume that current values are the “true” values.
Each month, as new station data come in, NCDC runs their pairwise homogenization algorithm which looks for non-climatic breakpoints by comparing each station to its surrounding stations.
When these breakpoints are detected, they are removed.
If a small step change is detected in a 100-year station record in the year 2006, for example, removing that step change will move all the values for that station prior to 2006 up or down by the amount of the breakpoint removed.
As long as new data leads to new breakpoint detection, the past station temperatures will be raised or lowered by the size of the breakpoint.”
###
In other words, an automatic computer algorithm searches for breakpoints, and then automatically adjusts the whole prior record up or down by the amount of the breakpoint.
This is not something new; it’s been around for ages, but something has always troubled me about it. It’s something that should also bother NCDC, but I suspect confirmation bias has prevented them from even looking for errors.
You see, the automatic adjustment procedure is almost guaranteed to produce spurious, artificial warming, and here’s why.
[ / end quote ]
___________
And there you have global warming CAGW / climate change if you wish to believe it.
Roy Spencer , head of NASA’s weather and climate satellite section has often expressed very serious allegations on just how bad are the adjustements algorithms of the NCDC and the USHCN earning the ire or much stronger of Tom Karl in the process as Pielke Sr has witnessed and described in the past.
Roy Spencer ; U.S. temperatures, 1973-2013: A alternative view
The further this goes the more likely it becomes that independent weather and climate prediction companies or organisations will appear and the so called official keepers of the global temperatures, weather and climate will fade into a well deserved obscurity unless there is a radical shake up and sorting out of the entire western nation’s global temperature data analysis systems .
And unfortunately as far as that is concerned that rather well known quote of Max Planck’s is probably quite correct ; “Science advances one funeral at a time.”
40
Zeke Hausfather — June 11, 2014
Yale Climate Forum
More Temperature Variability in a Warming World? Not So.
“A little ‘good news’ at least relatively, as scientific evidence provides little basis for supporting a commonly held perception of more temperature variability in a warmer world.”
00
Judging by the adjustments, the BOM were best able to accurately measure these temperatures around 1970. But since then they have getting less competent, with increasing need to adjust the temperatures later on, by increasing amounts.
It just doesn’t look very good, does it? What is needed in order to return them to the same level of competence demonstrated in the 1970’s? Perhaps take away their expensive computers until they learn how to use them properly?
20
This is why we need to make commensurate adjustments to BOM funding.
It’s plainly obvious that their competency peaked around the 70’s, so restoring funding to 1970 levels should bring their diligence back into proper perspective. 😉
50
Seems to be getting worse at an alarming rate!
30
It is definitely worse than we thought …
10
Info from; http://startthinkingright.wordpress.com/tag/climategate/
It took the BOM 9 years from 1993 to 2004, before they realised that they had a major cockup on their hands through failing to implement a change in data collection and analysis correctly. This apparently led to the Australian average temperatures having a -0.15C bias which naturally had to be corrected upwards by 0.15C’
How much else is there in the BOM’s data analysis system that is a completely [ self snip ]?
Yet the BOM continues to pass itself as without blemish or fault and therefore must be believed completely and never questioned as to it’s methods or claimed outcomes.
Is it any wonder that some parts of climate science are becoming to be seen as the mostly a science of quackery, shamanism and and dis- information / mis-information.
And once again, thank god for the internet and it’s ability to lift the veils of darkness and obfuscation that have for so long hidden some of the science disciplines under those Salome like veils
_________________
To David Jones BOM from Blair Trewin BOM Australia
Australian temperature data [SEC=UNCLASSIFIED]
I’ve finally had a chance to have a look at this – it turned out to be more complicated than I thought because a change which I thought had been implemented several years ago wasn’t.
Up until 1994 CLIMAT mean temperatures for Australia used (Tx+Tn)/2.
In 1994, apparently as part of a shift to generating CLIMAT messages automatically from what was then the new database (previously they were calculated on-station), a change was made to calculating as the mean of all available three-hourly observations (apparently without regard to data completeness, which made for some interesting results in a couple of months when one station wasn’t staffed overnight).
What was supposed to happen (once we noticed this problem in 2003 or thereabouts) was that we were going to revert to (tx+Tn)/2, for historical consistency, and resend values from the 1994-2003 period.
I have, however,discovered that the reversion never happened.
In a 2004 paper I found that using the mean of all three-hourly observations rather than (Tx+Tn)/2 produced a bias of approximately -0.15 C in mean temperatures averaged over Australia (at individual stations the bias is quite station-specific, being a function of the position of stations (and local sunrise/sunset times) within their time zone.
[ / ]
00
Head in the sand, and ignorant to boot…
http://www.theguardian.com/environment/planet-oz/2014/jun/06/the-us-carbon-trading-schemes-that-australias-prime-minister-cannot-see
—
Commenters: BG has submitted a string of hater drive-by insults (mostly trashed). He/she is probably in school. Go easy OK? Looks like a victim of the full Age/ABC/Guardian training poor sod. – Jo
111
Don’t be so hard on yourself…..
100
The solution Brun is to take your head OUT of the sand.
When you get out of school, we will teach you.
80
At first glance to you it may seem that you have a point because the U.S, does have some little trading schemes. However you need to see the context. Tony Abbott was being asked about schemes on a national scale.
So paint spit do Americans speak Spanish?
21
Quotes the SMH and Guardian as fact.
Credibility fail.
61
Linking to Readfern……. roflmao..
Surely even a junior high school student must have enough intelligence to realise how moronically stupid the guy is !!!
or maybe you just forgot the /sarc tag.
61
Note to Jo,
All warmies are victims.
That’s why they chase lost causes and then blame everyone else when it all turns to worms.
51
@Brunswick_Greenie
Did you know that it’s a myth that Ostriches bury their heads in the sand?
1.Ostriches typically live in arid areas.
2.Arid areas have dry surfaces.
3.Dry surfaces need significant digging in order to create a depth in which an Ostrich can “bury” its head.
When an ostrich senses danger and cannot run away, it flops to the ground and remains still, with its head and neck flat on the ground in front of it. Because the head and neck are lightly coloured, they blend in with the colour of the soil. From a distance, it just looks like the ostrich has buried its head in the sand, because only the body is visible.
But they do dig holes in the dirt to use as nests for their eggs. Several times a day, a bird puts her head in the hole and turns the eggs (female by day, male by night). So it really does look like the birds are burying their heads in the sand.
00
Why is this called ACORN-SAT when satellite data does not seem to be involved?
Is this deliberatly misleading?
Here on the chart “Annual mean temperature changes across Australia since 1910.”
The BoM says “Australia’s mean temperature has warmed by 0.9°C since 1910”.
http://www.bom.gov.au/state-of-the-climate/
They do not give any clue to the accuracy or certainty. Yet a link on the Acorn part of the BoM website leads to a claimed independent Review Panel of ACORN_SAT.
The panel says
“However, throughout the last 100 years,
Bureau of Meteorology guidance has allowed for a
tolerance of ±0.5 °C for field checks of either in-glass
or resistance thermometers. This is the primary
reason the Panel did not rate the observing practices
amongst international best practices.”
So -0.5 error at the 1910 end and +0.5 error at the current end would mean cooling instead!
It also says “Bureau specialists on quality control and
homogenisation of temperature data advised the
Review Panel that if the performance of a thermometer
at a particular measurement site strayed towards
the outer bounds of the inspection tolerance limits,
this would be picked up by the quality control and
homogenisation analyses, and corrected through
homogenisation.”
So what happens if all the thermometers in one area like around Alice Springs for example read low for years around 1910 and the modern ones nearby also all read high?
It also says “The Panel is aware that one station, Alice Springs,
contributes 7-10% of the signal”
With that in mind also read “Against the background of the above, the Review
Panel has a high level of confidence in the national
temperature trends that can be inferred from the
ACORN-SAT data-set. The Panel’s level of confidence
in trends in temperature for certain areas of remote
Australia (specifically, remote central Australia
and north-western Australia) is somewhat lower.”
It also says “Before public release of the ACORN-SAT dataset
the Bureau should determine and document
the reasons why the new data-set shows a lower
average temperature in the period prior to 1940
than is shown by data derived from the whole
network, and by previous international analyses
of Australian temperature data.”
http://www.bom.gov.au/climate/change/acorn-sat/documents/ACORN-SAT_IPR_Panel_Report_WEB.pdf
10
[…] Billions of dollars, climate models, predictions, and hundreds of press releases depend on the BOM records of Australian temperatures. […]
00
Excellent post Jo. It is great to see yourself and other climate luminaries continue to chase what has become a clearly climate activist Bureau of Meteorology. Eventually they will have to be called to account, unfortunately I think they have gone so far off the rails openness and honest are out the window while they try to protect their jobs.
Dr Jennifer Marohasy has continued to pursue the BOM as well. Dr Marohasy as you would know is an expert in the environment and hydrology and has written a number of papers on rainfall in Australia. She has written to BOM and the Minister on the topic of BOM accuracy referencing material you have written at this site as well as her own research. Today she also posted on this topic with a copy of another letter to the Minister of Environment, Greg Hunt. You can read that letter here. Some interesting snippets:
“I’ve since come to understand that the annual average temperature for 2013, which the Bureau claimed was a record, is in fact a wholly contrived valued based on modeling of temperatures, rather than the averaging of actual recorded values. That is, careful scrutiny of the Bureau’s methodology shows that recorded temperatures at locations across Australia are submitted to a two-step homogenization process that can have the effect of changing the entire temperature trend at specific locations. A weighted mean of these ‘homogenized’ values is then used in the calculation of the Australian annual mean temperature.”
Dr Marohasy alerts the Minister to a presentation she will give about the manufactured temperature records the BOM is providing to the Government and the people of Australia:
“At the invitation of the Sydney Institute, I will be giving a talk on 25th June 2014, that shows the detail of how this methodology is applied, using the locations of Bourke in western NSW and Amberley in Queensland as case studies. I encourage attendance from the Bureau to scrutinize my presentation for accuracy. Indeed, all Australians should have a clear understanding of the nature of the data used in the calculation of important and highly publicized temperature statistics. All Australians should also have access to a realistic assessment of current temperature trends.”
I hope the Minister decides to attend and then ask some very pointed questions of BOM; questions which you have been trying to get the answers to here for years Jo!
Dr Marohasy then writes about recent temperature research in Notheast Queensland:
“As part of ongoing research into natural rainfall patterns in Queensland, Professor John Abbot and I have been studying the temperature record for northeastern Australia, as temperature is a key input variable in our neural network models (e.g. Abbot and Marohasy 2014). Considering the data from the late 1800s until 1960, a cooling trend is evident, followed by warming between 1960 and 2001. In contrast, the last 12 years show quite dramatic cooling, Table 1. All three periods have occurred while greenhouse gases, particularly carbon dioxide, have been increasing in concentration in the atmosphere.
Furthermore, Dr Marohasy’s research with Dr Abbot, showing a very definite and significant cooling trend for the years 2002 to 2013 is based, in the 31 stations with a continuous temperature record across Queensland during that period. These are not based on “the modeled temperature values used to generate official temperature statistics, but on the unadjusted observed temperatures also available from the Bureau of Meteorology website.”
As Dr Marohasy writes, this “is in stark contrast to the information in the State of the Climate Report 2014 recently published by the Bureau and also CSIRO. The report states that “warming over Australia has been consistent” and temperatures are “projected to continue to increase, with more hot days and fewer extremely cool days.””
Marohasy then asks the minister “to consider how you might reconcile increasing atmospheric concentrations of carbon dioxide with a falling temperature trend, and what needs to be done if we are to adequately prepare as a nation for the possible onset of a period of sustained cooling.”
Hopefully with your posts Jo and your incredible reach through this blog, and experts such as Dr Jennifer Marohasy also asking difficult questions of BOM, the truth of dodgy temperature records from BOM will be brought out into the open.
I’m concious of making this a very long comment, but readers may well be interested in also having a look at guest blogger Bob Dedekind’s detailed explanation of the type of adjustments BOM have been doing and continue to do to our temperature records and “Why Automatic Temperature Adjustments Don’t Work” which is posted here. Critically Dedekind explains why “the automatic adjustment procedure is almost guaranteed to produce spurious, artificial warming.”
For really keen readers, Ed Thurston provided a very detailed explanation of how “The Australian Bureau of Meteorology Gets it Wrong” here.
Thurston also demonstrates the BOM approach when he shows a response from BOM in correspondence stating effectively that, BoM will use the 100 year ACORN-SAT dataset to highlight record-breaking extremes, while reserving the right to go back in time to adjust earlier data “as required”.
Clearly Jo, the Minister for Environment Greg Hunt is not serious about accurate temperature records if he is not prepared to address the matters you and others have raised about BOM.
120
Latest findings: 97% of government-funded climate organisations follow the money trail.
50
So you have proof of some sort of deliberate attempt to increase the warming trend? Or you have reason to suspect that? Or you haven’t got the courage to say?
Or is it merely a case of: the adjustment increases the trend, therefore there must be some orchestration of deceit?
Or is it just incompetence that happened to create a warming trend that may just as easily have created a cooling one?
Tell us, Jo, who in the Bom is conducting this?
And tell us why they would do it.
Some sceptical questions for you. how about some answers.
Conspiracy theorizing at its best. And that’s what buys Jo her new computers.
216
Chester,
The adjustments of raw data did alter a stable trend to a warming trend.
A lot of people had a lot to gain from that.
The Labor/Greens got to stay in government.
Many weren’t required to gain employment.
The age of entitlement continued.
You tampered with yourself.
91
Thanks for that Jamie B. I’m sure that mish-mash of Abbott and JoNova propaganda is meaningful to you in some way.
214
Thanks for that Ches, may I call you Ches, seems like we’re getting to be best buds.
I’m not surprised that you respond to mish-mash and I’m happy to satisfy that emotional need for validation.
I’d offer to shake hands, but you know, with all your self gratification…
61
It helps if you can read.
00
What they have is an shared ideology that there must be a warming trend..
……. and a shared methodology to obtain it.
61
And The Griss proves himself a conspiracy theorist beyond doubt.
Zero credibility. Except among fellow Group Thinkers.
23
Chester must also be a conspiracy theorist, since warmists share ideology. Wow—a conspiracy theorist acting like conspiracy theories are bad when someone else holds them. Oh, wait, sorry, I forget that conspiracy theorists are just as territorial as warmists and someone stepped on Chester’s little corner of Conspiracy Land.
20
I think they have been drinking too much kool-aid of late. twice in as many days I have been accused of talking about a “conspiracy” because I stated what was happening. I have challenged the alarmist each time to show what conspiracy I alleged. One slunk away. The other tried to pin a statement I made about an individual as a “conspiracy”. I had to remind him that a conspiracy required “people”, not a person. Whether my allegations about the person were true or not, it was not any kind of conspiracy.
I noticed Chesty doing that as well. I guess that is the new “Juden” for the Alarmists – you are a CONSPIRACY nut.
10
Chester is only half way through the first chapter of “Propaganda for Beginners”, so cut him some slack, folks.
He has gotten as far as, “Repeating the Challenge”, which is not bad, considering that he can only read as fast as his finger can move across the page.
10
Chester
Here is an example. This is Sydney Observatory max temps for May, 1958. Why did I pick this – because until May this year, 1958 was the hottest May on record for Sydney.
26.3 25.8
27.1 26.6
27.6 27.1
23.2 23.1
24 23.4
22.4 22.4
24 23.4
25.2 24.7
18.3 18.3
18.8 18.8
22.5 22.5
22.5 22.5
21.7 21.8
22.2 22.1
25.9 25.4
22.2 22.1
21.6 21.6
23.6 23.6
20.7 20.6
23.2 23.1
19.9 19.8
22.9 22.9
22.4 22.4
26.8 26.3
25.2 24.7
19.2 19.1
20.9 21
20.9 21
21.1 21.1
19.5 19.4
20.7 20.6
22.7 22.49 Monthly max mean
The monthly mean reduced by 0.2C. Most daily temps have been reduced (some by 0.5C) – why? There appears to be no reason.
There are so many other examples – and Ken Stewart has done all the hard research for us. Why would you doubt his conclusions? How about you do the data research yourself and prove him wrong.
Ever since ACORN was introduced in 2012, we have many long-term records being broken. The BoM can now claim the warmest day, month, season and year, etc – all in the past two years. Remarkable.
Can you even begin to understand that the ACORN methodology may be wrong?
100
And yet , last year on the so-called record , the AWS reached 45.3C, The same as was recorded 74 YEARS EARLIER in 1939.
Somehow, that got recorded and advertised as 45.8C. ie a new record.,
I have written to BOM to ask why,,….. no repsonse., of course.
31
I wonder if you can see the flaw in your thinking and approach and where you’ve veered off into conspiracy?
15
He has shown that the monthly average was adjusted down by 0.2 but not because of a small adjustment to each day. Some days go down by 0.5°C. Now what sort of algorithm makes such large adjustments to individual days seven times in a month?
Point out the flaw in his thinking rather infer there is an obvious one because the flaw in the data is obvious.
10
Chester, please understand that by your definition of conspiracy, based on your overuse of the term, every single person on this planet, yourself included, are conspiracy theorists. Unless you live alone and never speak to anyone else on the planet (oops, maybe that describes you?), there will always be shared ideology. By your definition, a proof-reader is a conspiracist (after all, he is identifying errors in a work just as is being done with the temperatures here), as are a group of people writing in to save their favorite television shows. You literally see conpiracies everywhere.
It would be truly fascinating to see if you know anything other than how to yell “Conspiracy” and “Group think”. That’s such a limited repertoire.
10
He is “repeating the challenge” – see my comment at 19.2.1.1.2
00
Sometimes, these people….
Jo has said nothing except that the BOM has failed to properly justify their adjustments. She has not impuned the BOM in any way other than to say the data should be checked by a disinterested and independent third party. I happen to agree, particularly in such a controversial subject on which our government is justifying Billions of dollars of impost on the community. Sorry, but it deserves to be justified properly and it deserves to be audited.
40
Chester #19
Well, the graph shows there has been an adjustment to the gradient of the graph in a manner that portrays a more rapid rate of warming over a larger range of temperature, with past temperatures depressed and recent/present temperatures elevated. How on earth does one rationally explain the requirement for such adjustments and why such an adjustment is necessary to approximate the raw data closer to the actual truth?
If there is a need to ‘adjust’ then I would expect a standard adjustment across the range of data that maintained the same gradient, since the rate of change should remain unaltered irrespective of the start point.
Fascinated to learn what your explanation for this is.
Leave out ‘saving the planet’.
20
Chester, WUWT has a guest post with the complaint explained clearly. I’ll make it a little simpler. As more data comes in for a site, sudden changes are identified and the temperature record is adjusted to take into account that it wasn’t natural. The adjustment always adds a warming trend to the whole data, not just a constant addition to the temperature eg.
10
Why do you think it is a conspiracy? I am always interested when alarmists project their fears on to others.
Did a little green man tell you it was a conspiracy?
00
the point is not about making adjustments the point is how can they prove theses adjustments are justified
70
And no doubt more than a few believe it. But the climate change tide is going out and the skeptical tide is coming in.
I hope it rolls over them in time.
50
Doubtless there is a rationale for various adjustments. They should be transparent, published, defensible and sit alongside unadjusted data. Nonetheless, it is very, very hard to see how ‘adjustments’ alter the rate of change (gradiant) of the graph. The implication (as has likely been pointed out) is that adjustments are not standard across time and location…..what conceivable explanation is there for such data fiddling that provides a coherent, consistent scientific rationale….aside of course from the non-scientific, political or personal agendas?
20
Manfred, on the contrary — I’d argue it’s easy to justify widespread adjustments that change the gradient. A correction for UHI would reduce the warming trend.
40
Yes Jo, that’s fine, I get that. I was under the impression (mistakenly it seems) that the UHI anomaly was properly adjusted for.
You’re absolutely correct.
Doing too many things at once this end.
What a calculated mess appears to have made of the data .
10
Well, Jo here’s a suggestion: get off your backside and do some research and a little bit of science and demonstrate the Bom’s errors and fault.
You got nothing. Except a new computer.
14
I see jealousy here, Chester. Sad you can’t get a new computer? I don’t think it will help unless you are looking for new insults to hurl about. Screaming about research while insulting people makes you look like an idiot. If that was not your goal, re-examine you methods.
21
No, he’s just tired because like a good little greenie he’s sitting there pedalling madly away to generate the power to run his computer…. remember the old “School Of The Air”?
That’s right, isn’t it Chester. I mean, you are not reliant at all on fossil fuels, are you?….. such evil that threatens to fry us to a crisp.
Or, are you just another GL (green looney) hypocrite?
21
Actually, your presence here means she has a lot – and it scares you. That is why you are not discussing the issues, but instead tossing ad hominems, snide remarks and being generally rude and crude.
I would suggest you follow your own advice, but like all alarmists, your motto seems to be ‘do as I say, not as I do’.
11
Not only that, Phil.
Notice that this trolls interjections are designed to take the conversation away from topics that the alarmists would prefer not to have discussed in too much depth.
Jo and Manfred were discussing the way the trend has been adjusted, possibly fraudulently, and Chester jumps into the conversation to divert the sub-thread onto Jo’s recent appeal for funds. If you look at all of his/her “contributions”, they tend to follow this same pattern.
21
I’m sure he is just waiting for his pocket money so that he too can send some funds to keep this forum going.
21
Breath, holding, not.
21
Good point!
00
Nobody believes the data pushed out from the various organizations except for the numbers derived from satellites.
Since 1850 the earth has warmed by a trivial, but poorly determined, amount, maybe 0.5 deg C. So what?
40
Yes, but do you know just how many squillion atom bombs that is?? Cause for alarm, surely?
30
Sorry, backslider but before 1945, the A Bomb wasnt invented, so older global warming is measured in chicken (little) farts.
00
But they are still around, don’t forget….. just look at John Cook et al.
10
OMG that is a HUGE number … everybody panic!!!!
00
Bruce, You are not correct. The so-called satellite measurements rely on electronic measurements of thermocouples in the satellite which is arithmetically related to a radiation temperatures at various levels above the surface, this is adjusted by frequency measurements and position signals. The supposed satellite temperatures have been calibrated against supposed surface temperatures (mainly land based).
The main good points is that the measurements are analysed by scientists who have little bias about their attitude to AGW and scientific endeavour, and that their algorithms have been consistent for the period of analyses to give some data which is comparable. However, there is no evidence that any monthly result is truely representative or more accurate than surface based measurements. The satellite measurements for any pass can be affected by clouds.
I personally do not believe that an accuracy of better than +-0.1 could be justified although anomaly results are given to two decimals.
00
We all make the mistake in thinking that BOM temperature adjusters are just misguided, and perhaps one day will see the error of their ways. It is deliberate, just like the NIWA adjusters in NZ, and the Met adjusters in the UK.
What is needed are FOI requests to unearth the entire basis for the adjustments.
Only then can they be tackled for their deliberate manipulation of the temperature data.
30
If they can be economical with the accuracy to their adjustments, they can also be economical with the truth regarding the rationale for those adjustments.
If you are a consistent liar, you can never admit to the fact, for that would be telling the truth, and would no longer be consistent.
00
Wasn’t 1850 towards the end of the little Ice Age when it was definitely cooler and they were skating on the Thames some winters? One would expect it to be a bit warmer these days, but perhaps it’s getting cooler.
20
They’re still arguing over whether or not the LIA was global or not. Plus, I saw several places where it was only 1 to 2 degrees C colder than now. So, no, the LIA does not do in AGW according to the warmists.
00
If you are reading Ken, please change “not insignificant” to “significant”. It really ruins a well written paragraph. Although having done that you will be required to justify the statement with evidence of statistical significance. You can get around this by using the more correct, “high proportion”. Please don’t write “not low proportion”!
23
Sorry Gee Aye if my English usage does not meet your standards. I wrote what I meant and I meant what I wrote. In my 2012 analysis, the 10 sites analysed could be called an insignificant sample, but 83 sites cannot be called that.
10
“small” not “insignificant” – although “insignificant” should be “not significant”.. They are not synonyms. No apology needed but my original comment holds regarding use of double negatives even if you are referencing a previously used term.
00
English is a living language, which changes by demographic, location, and the whim of the writer.
One of the few words that has not changed meaning, over the years, is “pedantry”.
It is the diversity of usage, in the English language, of which I write.
00
And more to the point, “not insignificant” is not an exact synonym of “significant”. Ergo they are not interchangeable. There is a scale of nuance between “significant” and “insignificant”, where something can be “not significant” or “not insignificant”. None of the terms are absolute.
10
I agree but my opinion is that not insignificant is unclear in meaning and I’d delete it before submitting for publication.
Also pedant (yes I looked it up but my french is goodish so I was on the right track) is derived from teacher in one of the Latin languages. I could not be arsed checking deeper to see if pedantry as used in English had a meaning more to do with teaching than correcting or whether it, as you say, always had its current meaning in English.
00
Thanks Rereke, if you’ll pardon the colloquialism, you’re not wrong (!). Rules are made to be broken, the ones about double negatives included. The deliberate use of a broken rule e.g. a double negative, draws attention to the content of the sentence. The British do this to perfection.
00
speaking of data –
11 June: Bloomberg: Lisa Lerer: Americans by 2 to 1 Would Pay More to Curb Climate Change
Americans are willing to bear the costs of combating climate change, and most are more likely to support a candidate seeking to address the issue.
By an almost two-to-one margin, 62 percent to 33 percent, Americans say they would pay more for energy if it would mean a reduction in pollution from carbon emissions, according to the Bloomberg National Poll.
While Republicans were split, with 46 percent willing to pay more and 49 percent opposed to it, 82 percent of Democrats and 60 percent of independents say they’d accept higher bills…
The EPA proposal is likely to be modified during a public comment period, and a bipartisan coalition of coal-state lawmakers have vowed to pass legislation to block them…
Obama’s proposal has divided his party along regional lines. While Democratic Senate candidates in Iowa and Colorado back the emission limits, others in coal-states such as West Virginia and Kentucky have distanced themselves from them…
http://www.bloomberg.com/news/2014-06-10/americans-by-2-to-1-would-pay-more-to-curb-climate-change.html
given the responses to the non-climate questions, with only 5% seeing CC as “the most important issue facing the country right now”, Bloomberg’s main claim that “Americans are willing to bear the costs of combating climate change, and most are more likely to support a candidate seeking to address the issue”, which is derived from two questions with extremely dubious figures, is laughable.
btw this sample is the equivalent of polling approx 72 Australians:
Bloomberg News National Poll Results – SELZER & COMPANY
June 10 (Bloomberg) — The Bloomberg News National Poll, conducted June 6-9 for Bloomberg News by Selzer & Co. of Des Moines, IA, is based on interviews with 1,005 U.S. adults ages 18 or older..
http://media.bloomberg.com/bb/avfile/rg._mQ264POU
10
Looks like the Goracle is heading down under at some stage to recruit stooges for his Climate reality Project:
http://www.smh.com.au/world/al-gore-mother-nature-has-louder-voice-than-tony-abbott-on-climate-20140612-zs4wx.html
wonder if he’d care to debate someone while he is down here… haha, JK I know.
31
“Environmmental Volunteer Leaders” hmmm… sounds like he’s putting together some sort of an extremist left wing youth group.
11
The Goracle is a theologian. Theologians do not debate, they preach. Their unpaid followers (like millions of dollars from the Goracle can’t go to the poor volunteers—no, wait, if they work for free that means they are dedicated, or stupid….) are like his choir, singing his praises. Churches do not debate.
00
Probably one of the most insightful things a former priest said to me was: The Church is not a democracy.
00