The BOM say their temperature records are high quality. An independent audit team has just produced a report showing that as many as 85 -95% of all Australian sites in the pre-Celsius era (before 1972) did not comply with the BOM’s own stipulations. The audit shows 20-30% of all the measurements back then were rounded or possibly truncated. Even modern electronic equipment was at times, so faulty and unmonitored that one station rounded all the readings for nearly 10 years! These sloppy errors may have created an artificial warming trend. The BOM are issuing pronouncements of trends to two decimal places like this one in the BOM’s Annual Climate Summary 2011 of “0.52 °C above average” yet relying on patchy data that did not meet its own compliance standards around half the time. It’s doubtful they can justify one decimal place, let alone two?
We need a professional audit.
A team of independent engineers, scientists, statisticians and data analysts (brought together by the joannenova blog) has been going through the Australia Bureau of Meteorology records (BOM). They’ve audited some 8.5 million daily observations across 237 High Quality and other close sites in Australia. Shockingly, while the BOM calls their database “High Quality” and instructed observers before 1972 to record in tenths of a degree Fahrenheit, the auditors started finding sites with long stretches of records where the weather suspiciously rose and fell only in Fahrenheit quanta, like 72.0, 73.0, 72.0, 71.0, 73.0, 72.0. After 1972, the BOM went metric, and oddly, so did parts of the Australian climate. Numerous sites started warming and cooling in pure Celsius integers.
The bottom line:
- The BOM records need a thorough independent audit.
- It’s possible that a significant part of the 20th Century Australian warming trend may have come from something as banal as sloppy observers truncating records in Fahrenheit prior to 1972.
- Many High Quality sites are not high quality and ought to be deleted from the trends.
- Even current electronic equipment is faulty, and the BOM is not checking its own records.
- Even climate scientists admit that truncation of Fahrenheit temperatures would cause an artificial warming effect.
The Audit Team identifies a suspicious problem
It was the sharp eye of Chris Gillham who noticed the first long string of continuous whole numbers in a site record. I wondered if it was faulty equipment and thus if other sites were affected, so people started looking, and suspicious stretches started turning up everywhere. The audit team were astonished at how common the problem was. Ian Hill and Ed Thurstan developed software to search the mountain of data and discovered that while temperatures of .0 degrees ought to have been 10% of all the measurements, some 20 – 30% of the entire BOM database was recorded as whole number, or “.0”.
Ken Stewart has the whole in-depth report at his site: “Near Enough For a Sheep Station”
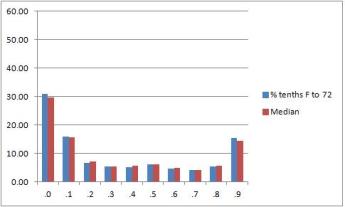
Fahrenheit era observations (prior to 1972) have even higher proportions of .0 than those of the Celsius era. Note the strange peaks at 0.1 and 0.9? Those are likely due to converting raw F to C and back.
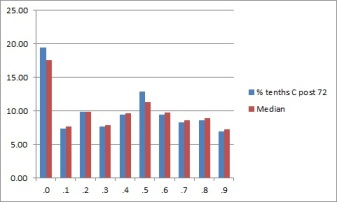
Celcius era observations (1972 – 2011)have obvious peaks at .0 and .5. All decimals ought be equally represented.
A few things we can say for sure is that observers (who were unpaid a lot of the time) didn’t know how much stock would be placed on their records years after they were taken. The cold mornings tended to strip their enthusiasm, possibly explaining why minima records are less accurate than maxima.
Only 15% of sites were compliant with the BOM stipulations for Fahrenheit maximums, and only about 5% were compliant for Fahrenheit minima. That’s 83% and 95% non-compliant! Around half of all sites were so bad that three out of 10 records were rounded or truncated to whole degrees.
With Celsius records, about 50% of sites for maxima and 65% of sites for minima have months and sometimes years of consecutive daily temperatures presented in the BoM’s raw data feed as rounded integers, along with a high proportion of .5C. There is evidence that in some instances this incorrect raw rather than precise data is used to calculate the BoM’s HQ daily temperature series.
Converting Fahrenheit to Celsius adds another error…
Ken points out: “The occurrence of large percentages of .1 and .9 fractions in the Fahrenheit listings suggests this is an artifact of the original conversion from F to C (rounded to one decimal place), then the conversion back from C to F (again rounded), and suggests that the percentage of .0 is in reality much more. Below is a sample of Fahrenheit to Celsius to Fahrenheit conversions.”
For example, converting 67.0 F to 19.4C will produce 66.9F (not 67.0) when converted back to F if conversions are rounded to one decimal place at each step.
The odd high number of 0.1 and 0.9 records probably comes from converting Fahrenheit to Celsius and back. The rounding in Fahrenheit times was probably worse.
Even climate scientists admit truncation and conversions could be a problem
A seminal 1996 climate study into historic Australian temperature records by Simon Torok et al, acknowledged that truncation of Fahrenheit temperatures would have caused artificial warming in the early 1970s.
“ Some observers, prior to the change to metric units, recorded temperatures in whole degrees Fahrenheit, instead of recording to the nearest tenth of a degree, as specified in directions to observers. If many observers truncated their measurements to the nearest whole degree below the actual measurement, prior to metrication, and after metrication recorded to tenths of a degree, this would result in an artificial warming in the early 1970s. Discontinuities caused by such a practice, if it was wide-spread, would not be detected by the statistical programs used here. Examination of field books does not suggest this practice was sufficiently common …”
Reference — Torok, S.J. and Nicholls, N (1996): A historical temperature dataset for Australia. Aust. Met. Mag. 45: 251-260
Torok and Nicholls, did not think the practice was common, but this audit shows that almost all sites were non-compliant during some part of the era before 1972, and the number of 0.1 and 0.9 records at the worst sites suggests those sites were almost 100% recorded to whole degrees.
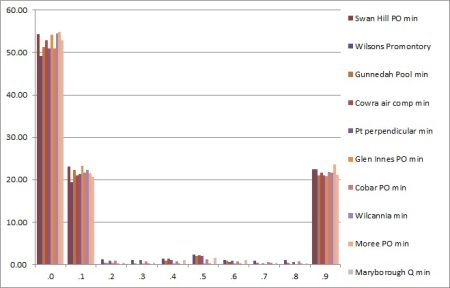
The worst sites in Australia
For those who are interested, the worst state in Australia by far was NSW, but the Gold Medal for the Worst Celsius era Site in Australia goes to Katanning WA, where some 75% of all readings were rounded to whole degrees.
The all time Most Preposterous Station Award goes to Tamworth Air AWS. It is supposed to be a High Quality record, yet from 1996 to 2006 there were 3485 days of continuous whole degree Celsius records. The temperature was recorded electronically by an Automatic Weather Station and transferred directly into the HQ record, and seemingly no one noticed for nearly ten years.
Pre 1910 records – no better or worse than newer ones
The BOM often tells us to ignore the readings prior to 1910, but when compared to the sloppy state in the century since then, on the issue of whole degree rounding, the early records are just as good. Surely the warm period in the late 1800’s is not being conveniently ignored?
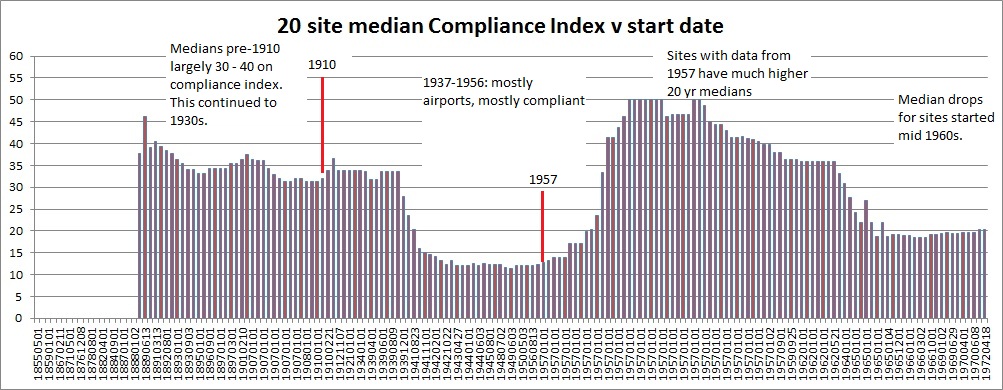
Higher bars means sites with more rounding errors. About 35% of sites were non-compliant from 1880 – 1910, which was better than data around the 1960’s. The best data comes from 1937-1957. From Ken Stewarts description: “Another way of showing the relationship between age and quality is by plotting the 20 site running median of the Compliance Index (inverted) with the start-up date of sites. “
What does it mean?
It all depends on something that may be unknowable. How many whole number records were truncated, rather than rounded up or down? If truncation was common in the pre-1972 era the records would have been artificially lower than they should have been. The audit team ran through many scenarios and found that since more than half of all sites in Australia had rounding errors probably greater than 50%, if they were truncated at significant levels (say 33%, 50%, or 100%) before September 1972, it would cause artificial warming of between +0.1C and +0.4C per 100 years.
Ken Stewart and the auditing team call for a thorough independent audit of the BOM
Conclusion
This audit of a large sample of daily temperature observations at all sites associated with Australia’s High Quality Temperature Network provides convincing evidence that the record is of very poor quality and is replete with errors. Many HQ sites have recorded large amounts of data in recent years that may be in error by up to 0.50 Celsius, being rounded to whole degrees, and more than half of the sample studied have recorded erroneous data at some time in the past 40 years. As well, the vast majority of sites used to compile the HQ Annual temperature dataset inaccurately recorded observations in the Fahrenheit era by recording in whole degrees. For nearly half of all sites, this amounts to at least 50% of their total observations. It is probable that more than 50% of all Australian observations were rounded. This alone means that temperatures before 1972 may be inaccurate by up to 0.250 C. If significant proportions of temperatures were rounded down, this would have the effect of making post-1972 temperatures relatively warmer, increasing warming trends by between 0.1oC and 0.4oC. Evidence is presented that this may have been the case. There is also evidence of very poor quality control in compiling the HQ record. The large amount of uncertainty in the records of so many sites means that homogenisation as practised by BOM researchers must be in question, and with it all analyses of Australia’s temperature trends plus the calibration of past proxy studies.
“Near enough for a sheep station” may have been the understandable attitude of hundreds of poorly trained weather observers in the past. However, it is NOT good enough for a modern scientific organisation such as the Bureau of Meteorology or the CSIRO, especially when climate analyses based on such poor quality historical data inform government policy on climate change.
A thorough audit of the Bureau of Meteorology’s practices is long overdue.
——————————————————
BACKGROUND
The driving inspiration behind this audit was Chris Gillham. He has written his interpretation of our findings at http://www.waclimate.net/round/rounded-australia.html
This independent audit of raw daily temperature records at 237 High Quality and nearby stations was conducted over seven weeks from January to March 2012. It was a collaborative data validation analysis by:
Ian Hill
Ed Thurstan
Geoff Sherrington.
Others who contributed are Joanne Nova, Warwick Hughes, Lance Pidgeon, Anthony Cox.
For a description of the origins and process of the audit, see http://www.waclimate.net/round/rounded-background.html
None of the participants in this audit has received any financial reimbursement or other assistance from any third party, corporate or political, and all results are accurate and verifiable.
———————————————————–
Ken Stewart has the whole in-depth report at his site: “Near Enough For a Sheep Station”.
The full audit results for all Australian HQ and associated weather stations are within:
- TableofSites-Australia-Analysis.xlsx (Excel download 422kb).
The Excel macro applications built to conduct this audit are:
- Fahrenheit/Celsius fraction calculator Tenths-distribution-V6.xls (Excel download 1.7mb)
- .0 and .5 consecutive Celsius block scanner tool Scanner_1.xls (Excel download 1.4mb)
- Table of Sites (Excel download 127kb) required for the audit to function
Both macros and the Table of Sites should be run simultaneously. Full instructions are included within the tenth fraction distribution calculator macro in the sheet titled Instructions.
Thank you Ken, Chris, Ian, Ed and Geoff!


“has just produced a report showing that 85 -95% of all Australian sites in the pre-Fahrenheit era (before 1972)”
pre-Celcius/Centigrade
—
Thanks. Fixed. Jo
10
no worries… surprisingly to some I’m quite happy to help:)
10
Wow,
This is significant. I fail to see how any homogenisation of the data could possibly correct data sets in this state.
Out of interest, I wonder what the stations without any obvious errors say and what their geographic coverage is like?
Also, considering the world is about three quarters ocean and the recent data indicates a cooling pacific and atlantic, I really wonder how long this chicken little scenario can keep going?
Where on earth is trenberths heat? Maybe we should stop looking for it – after all, if they were right it would surely be blatantly obvious by now?
00
I fail to see how any homogenisation of the data could possibly correct data sets in this state.
00
Thanks – Ken Stewart, Chris Gillham, Ian Hill, Ed Thurstan, Geoff Sherrington – for time and effort devoted to this project.
Unfortunately many important “big government” findings are based on experimental observations that others cannot understand or reproduce, e.g., the reported discovery of “oscillating” solar neutrinos by 178 scientists at the Sudbury Neutrino Observatory in 2001, a few months after neutron repulsion was first reported as the source for most of the Sun’s energy.
http://www.omatumr.com/lpsc.prn.pdf
Your efforts certainly confirm the need to verify official reports.
00
Great summary Jo! And congrats to Ken, Chris, Ian, Ed and Geoff. I might add that Andrew Barnham made some interesting points at the end.
The remaining issue to be resolved is whether the rounding was up or down, a truncation. A forensic audit could resolve this and this may be done by David Stockwell.
01
It seems like a forensic audit is needed on CSIRO/BoM sea level rise records. March 15, 2012:
11
A round of applause for Ken and his cobbers for a great effort. Another BoMb
11
I recall reading recently, one of the ClimateGate 2.0 emails regarding records of Australian temperatures from BoM. If my memory serves me correctly, the email lamented the poor quality of the Australian records.
11
If not mistaken, Streetcred, I believe that the reference to Australia’s lousy temp data was in the Harry_read_me file, which was a companion leak to the Climategate main trove. I’m not sure, though, if it referred to the BoM numbers or the lousy job of transcribing them, which poor Harry’s data-inputting mate had to clean up.
00
To all the good folk who put so much time into this report, a sincere thankyou.
I am sure the BOM are aware of the quality of their data and will make corrections. That is what ‘scientific organisations’ are supposed to do.
Sadly, we live in a time when government informs its organisations of the data it requires regarding climate change.
Going on past performance, I am sure those corrections will comply.
03
The guys who did this worked away at it for hours and hours each week for many months. I got to see some of the work they did and was continually amazed at the effort and attention to detail. They went over some of the data again and again different ways until they were sure of what they were seeing. Things were checked from multiple sources where possible and then rechecked by others in the group. It would be sad if this great effort gets ignored. All the charts, programs and sorting out of hiccups take time also. Time that is wasted if no attention is paid to what they have uncovered.
While i get listed as having contributed for providing comic relief and interesting distractions these guys above stuck at it and worked hard. I hope they get the audit or at least cause the BOM to pay careful attention to the detail in the records from now on.
Lance
01
Siliggy,
OT. But thought given your interest in the genesis of oil you may be interested in this if you hadn’t already come across it.
“Conspiracy of Science -Earth is in fact growing” – Oceans cool thickening mantle.
http://www.youtube.com/watch?v=oJfBSc6e7QQ
00
Thanks kevin. Yes seen and favorited long ago! Thought i posted that link for you once.
Wonder what type of taxation could stop it?
One of my pet theories depends on that being true.
The clues are everywhere.
http://www.youtube.com/watch?v=VCG9MuKEc4k
This is a little too OT so have a look at this and we can catch up on it another time.
http://www.vetrun.net/forums/showthread.php?t=9795
00
BoM Richmond recorded nothing in the rainfall column for the 29th Feb this year http://www.bom.gov.au/climate/dwo/201202/html/IDCJDW2119.201202.shtml I live 10km from there and recorded 36mm! This is the 4th time they have ‘falsified’ their rainfall figures in the past 15 months. When rain has been falling heavily in other closeby Metro suburbs they record massively less!
11
That’s quite understandable really.
That stuff is pretty expensive equipment you know.
So, to save it getting wet and ruining the electronics, they take it inside at the first sign of rain. (nyuk nyuk nyuk)
Tony.
01
I’ve certainly had no rain on days when suburbs 10kms away got heavy rain. It happens.
10
You will see that rain reported as being for 1st March Norm. Any rain falling after 9am goes to the next day. There must be a logical reason for that.
00
I have always thought that rainfall figures are more important than temperature in most parts of Australia, for determining whether/what climate change is occurring.
A few Februaries ago, there was a rain event in my part of Oz (NSW south coast) and our local AWS went on the blink at about 4am one day, having recorded over 60mm at that stage. Despite contacting BOM and pointing out the missing rainfall registration (they agreed it was missing), it has never been corrected in the public figures on their website.
I wonder if this type of omission is common?
00
Wasn’t it a Tazmanian Devil who said questionly,”Wild turkey suprise?”
00
I loved the part where the AusBOM where trying to get data from the audit team.
The rounding up reminds me of a story a friend of mine told me last year. He sheered sheep back in the day and on one particularly hot day they were sucking back a few coldies at the pub complaining about the weather. Pretty soon, one of them made a bet that it was the hottest day of the year. They upped the stakes until one them insisted on going down to the post office to check the temperature. The other stayed at the pub and called ahead to the post master about the bet. Obligingly, he bumped the official reading up 3 degrees for a split of the profit. That can definitely be described as high quality data.
01
Actually Waffle, if you go here, which is to Torok and Nicholl’s original paper on the BoM temperature network and go to pages 59-60, table 2.2, you will find a list of reasons for ‘defects’ in the recording of temperature. On of them includes an the possibility of temperatures being exaggerated because emplyees were paid more if it topped 100F.
Generally the list is quite amusing; or would be if you didn’t realise that it reflects systemic and gross defects in data which the government uses to assert that “the science is settled” and impose policy to solve AGW which will cost the Australian economy $billions.
00
Sorry I didn’t link. http://www.youtube.com/watch?v=FOTlNOZB4Zo Enjoy
00
” the BOM calls their database “High Quality” ”
I’m sure it is . That’s not to say anything about the data in it though.
Surely it seems quite meaningless to be reading thermometers to more than ~0.5 degree of precision.
How accurately & regularly are they calibrated ?
Precision is not to be confused with accuracy.
To obsess about temperatures globaly varying within one C degree , on average, is another example of our obsession with precision detaching us from reality.
00
*blinks* Someone got a blood transfusion from Anthony Watts? (think about it…)
00
About time someone started looking at the Australian record .
Maybe try to determine just how much of the BOM calculated warming could be due to urban expansion, airports, relocations etc , etc , etc, etc.
Australia is one country in particular that has undergone massive urbanisation in the duodecade (1976-1996)where most of the assumed warming took place.
How odd is it that once reliable satellite reading have become available around 2000, the warming miraculously stop !!! Coincidence ?.. I don’t think so !
00
” trends to two decimal places like this one in the BOM’s Annual Climate Summary 2011 of “0.52 °C above…..”
Blimey, that BOM Climate Report is looking so glossy & expensively produced. It’s so shiny it must be increasing Australia’s albedo, and thereby accounting for the lack of warming.
Note the emphasis on only equal warmEST , rather than no warmING wrt. the Global trend.
The Warmingers vs. the Warmestas. The difference depending mainly on your point of view.
01
They made it shiny and glossy so people would stop wiping their arse with it
01
Global Warming caused by decimalisation in the Seventies eh!
Another argument for taxing us back to the Stone Age.
11
This comment is not directly related to the thread but I hope it will be OK.
I have a problem logging onto any site carrying Frank Lansner’s graphs, particularly his archive of mid-70s global temperature records as published in the National Geographic and elsewhere.
A panel comes down demanding I register. Do others have the same result?
Thanks.
00
Yes.
00
Hi manalive!
Yes we have a strange situation at hidethedecline.eu indeed, we dont know if its a hack or something more trivial. My copoanion on Hidethedecline (Nicolai Skjoldby) is presently contacting the service provider to figure out whats going on.
I hope its something very banal!!
Thankyou for mentioning!
00
What I hear now is that this might very well be hacking!
Some will try to fix software but it can take long time… :-////
K.R. Frank
00
[…] Jo Nova Share this:PrintEmailMoreStumbleUponTwitterFacebookDiggRedditLike this:LikeBe the first to like this post. This entry was posted in Climate Change and tagged climate research, climate science. Bookmark the permalink. ← Geoffrey Styles: A Cleantech Trade War with China? […]
00
Not to be confused with the Bureau of Metrology.
Isn’t climate the average of weather?
So how to persuade a volunteer out in the sticks, that it ‘s worth reading to much better than a degree, when it varies by so much over the day.
Call them a Climate Station ?
00
Are BOM’s figures used by the CSIRO or does it do its own figuring?
00
As far I know they use BOM products.
Ken
00
Right, sooo… it’s the bland leading the blind. 😀
00
I’m wondering if Simon Torok was an AGW fancier before his work on the Australian temperature record or as a result of it.
00
Long time reader, first time poster, love the site (Thanks Jo :)).
Sorry that this is off topic, but how is it that federal government won’t consider Nuclear power stations, but are currently trying to establish Australia as a nuclear waste dump.
http://news.ninemsn.com.au/national/8435925/nt-aboriginal-elders-send-plea-to-gg
00
OT……Michael Mann is on Late Line tonight. He was just touted as “The Nobel Prize winning scientist who weathered the Climategate Storm”. Sounds balanced to me.
00
Just watched him; had to get up; felt physically ill. As the saying goes, there are lies, damned lies and climate scientists.
01
Damn. Missed it. Cocky bastard was he?
00
In deference to Jo’s standards I won’t reply to that John. Your lucky day.
00
He couldn’t help himself. He kept having to hide his smirk halfway through it. The leading questions were obviously fed to the interviewer. Things like ‘you’ve measured a 1 degree increase in temperature, is that because of man’s burning of fossil fuels’. ‘How badly will Australia be affected by climate change’. Vomit.
He had the gall to say that the climate has turned out exactly as he and Hansen had predicted 20 years ago (20 years ago he didn’t even have a Phd). No mention of the complete and utter failure of the IPCC models to be within 500% of the actual result. No mention of the missing heat. No mention of flat temperature trend since he conjured up a hockey stick with dodgy statistical methods.
He also claimed that 9 separate enquiries exonerated him in the climategate emails, and that it was just a sinister plot to derail Copenhagen. Funny that – for a sinister plot to derail copenhagen, he sure wrote most of the material – how he could claim someone came up with a plot using his emails wasn’t clear.
I stomached about 2 minutes and switched it off. Absolute government propaganda. They’re really turning up the wicks as July 1 approaches – first the BOM ‘state of the climate’ report for 2012, when we’re only 3 months in, then Michael Mann popping up for a soft-ball interview. Next thing Al Gore will be touring schools showing his snuff film.
The climate industry is a cornered beast and looking dangerous. I can just imagine how hostile they would be to Bob Carter if he came in for a lateline interview.
11
I saw a bit of it but dammit, Mad Max was on another channel.
00
I think it was Tony who bought up locations of these weather stations!
On the Sunshine Coast 8 have closed out of 16.
Sunshine Coast Airport, Hervey Bay Airport & Nambour DPI Hillside are all locally considered hot spots! (ALL OPERATING)
Baroon Pocket Dam, Hervey Bay Wildlife Park and Imbil Forestry were all considered locally as cooler areas. (ALL CLOSED)
40850 BAROON POCKET DAM Mar 1998 Mar 2007 9.1 82 N
40040 CALOUNDRA SIGNAL STATION Sep 1970 Nov 1992 22.2 99 N
40420 COOLUM BOWLS CLUB Jun 1969 Dec 1981 12.5 81 N
40068 DOUBLE ISLAND POINT LIGHTHOUSE Jan 1957 Mar 2012 51.8 91 Y
40478 FRASER ISLAND EURONG Mar 1989 Apr 1999 9.3 68 N
40093 GYMPIE Jan 1965 Mar 2012 46.4 85 Y
40405 HERVEY BAY AIRPORT Mar 1999 Mar 2012 13.1 98 Y
40765 HERVEY BAY WILDLIFE PARK Apr 1988 Mar 1999 9.5 85 N
40100 IMBIL FORESTRY Jan 1965 Apr 2001 36.3 65 N
40121 MALENY TAMARIND ST Apr 2001 Mar 2012 11.0 99 N
40282 NAMBOUR DPI Jan 1965 Dec 2007 43.0 84 Y
40988 NAMBOUR DPI – HILLSIDE Dec 2007 Mar 2012 4.3 97 Y
40856 RAINBOW BEACH Jun 1992 Mar 2012 19.8 99 N
40861 SUNSHINE COAST AIRPORT Jul 1994 Mar 2012 17.8 96 Y
40264 TEWANTIN POST OFFICE Mar 1895 Mar 1996 92.8 85 N
40908 TEWANTIN RSL PARK Jan 1996 Mar 2012 16.3 97 Y
So obviously over a large time scale – more recent times will show up as hotter than the previous averaged records. Surely for long term temperature measurements – constant locations have to utilised! Not hard to increase temperature over time by moving stations!
Who audits the BOM on location selection?
00
Arrh – still getting used to this reply system. See a few posts below, Dave.
00
Each move a little extra false warming. Keep putting those tiny amounts into your piggy bank and it fills. The amount of global warming over last century itself is small(it has not warmed this century). Our Gov’t says it warrants the pointless and nearly irrelevant actions like a carbon tax. It is the tiny parts that are called names like “divergence”. The whole argument depends on these tiny parts while the major changes through history have obvious causes like changes in the solar output and volcanic eruptions etc. It is only the small difference between what is natural and what is not that this whole false alarm is based on.
All of these little errors matter.
12
This is a very well recognised problem in climate change analysis. There are no perfect answers, but the fact of stations dropping in and out is why one uses an anomaly based analysis. Wenju Cai did an interesting demolition on claims that the MDB warming was due to sunshine hours increasing at unprecedented rates by showing that the trend was due to stations coming on line to the north, and the authors of the study failing to recognise that this contaminated their trends. (http://www.amos.org.au/documents/item/309) He also showed that if you substitute latitude for sunshine hours or temperature, and use the same analysis, Australia would seem to be heading North at 25m per year.
I’m saying that the problems with the data are well known to the people who use it.
I’m not saying this reported analysis is incorrect as such, but I very much doubt that what it reports would have much impact on most warming studies.
I do think a legitimate question to ask is, “Given that these problems (and more) exist in the dataset, what should a data repository do?”
00
jiminy, Right now I’m working up some valid, seemingly blindingly obvious, reasons why the ‘anomaly’ method fails badly in some circumstances, not just in Australia, but globally. Watch this space.
00
Mann has just admitted that the WMP existed…. It just wasn’t that warm…. And it was only in Europe….and we are all going to die…. And somebody gave sent him “white powder” in the mail…. So he “assumed the worst”… Chicken little is still alive…
01
Even with the dodgy BOM data,
There has been no warming for over a decade. Check the 10 year running average.
And the CSIRO won’t even own up to a basic fact brought out in their own data.
Those climate scumbags!
http://www.bom.gov.au/cgi-bin/climate/change/global/timeseries.cgi?graph=global_t®ion=sh&season=0112&ave_yr=10
02
Good point Dave. I noticed many new sites near well established ones and wondered the same thing.
I recently discovered that Australia’s HQ annual mean temperatures are a weighted average of state and territory annual means. It didn’t take long to work out that the BoM uses area to do the weighting and therefore the largest states contribute most to the annual temperature. That might not be so bad if sites were distributed uniformly around the country, but they are not. The Northern Territory comprises nearly 20% of Australia’s area but has just two HQ rural stations, Alice Springs Airport (15590) and Tennant Creek Airport (15135). This means that each of these sites influences a whopping 10% of the national HQ temperature calculation while sites in Victoria and Tasmania don’t get a look in.
See http://joannenova.com.au/2010/11/australias-high-quality-data-12-year-sites-used-for-long-term-trends/#comments for an associated article by Andrew Barnham.
I reckon there’s no need for a State HQ calculation at all. The weather doesn’t change its daily intentions on reaching a state border which after all is (mostly) just an imaginary political line.
00
They should probably use the BEST algorithm to weight the individual stations data.
00
The BEST weighting algorithm is discussed here.
BEST use a Jacknife method of weighting all stations against time but only one geographical feature, height above sea level. But apart from that geographical fantasy the Jacknife method itself is flawed; it is flawed because the Jacknife method assumes EQUAL weighting of the stations which has not been done. As Jeff Id notes:
CI = confidence interval.
00
Until someone goes out and looks at ALL sites to try and determine possible UHI effects, or other reasons why trends might exist, I will continue to consider the whole Global Land temperature record to be severely tainted.
BEST’s purile attempt at identifying possible UHI effects was childish and naive to say the least. Go out and do some real research guys….. not just a rehash from highly unreliable data.
Unfortunately, those with the (government) funding will not do that. In fact it is probably the very last thing they would ever want to do….. because they know what the result would almost certainly show large UHI effects in that particular period from 1976-1996 which the AGW religion is based on.
00
John Brookes, The BEST graph as summarised at http://www.geoffstuff.com/Correl.JPG is simply wrong in what it purports to show for later use. A simple-to-see effect for being wrong can be shown by reference to fig 2 of Willis Eschenbach’s Argo studies of tropical sea surface temperatures, see http://wattsupwiththat.com/2012/02/09/jason-and-the-argo-notes/ In essence, the Argo temperatures plateau at about 30 deg C, from one or more feedback effects. A correlation coefficient matrix between many sites at 30 deg C, even though spaced apart by various distances, would of course produce a fine correlation coefficient. However, it is arguable that it is useful for the purpose to which it was put by BEST. And yes, I know that they produced N-S correlations as well as E-W ones, but this merely seems to help confirm the above.
00
Hang on a second Cohenite, are you saying that because we have very little rural coverage the BOM have decided to give weighting to these rural sites as opposed to the urban sites? How do they calculate the weighting? 1 square mile = weighting of X?
In other words we are just making it all up? My God this scam gets even bigger, temperature data collection in Australia is not science this is a hobby.
Jesus F**&^%%$#%^&G Wept……………..
01
Great work!
One has to wonder if these errors persist in all the records used for global reconstructions?
01
Mark, it would appear to be systemic … the latest corruptions ‘found out’ :
On the adjustments to the HadSST3 data set
The effect of the adjustments introduced in Met. Office’s HadSST3 release are compared to the original ICOADS data to evaluate their effects on the frequency content of the data. The relative merits of making a simple adjustment for the war-time glitch in ICOADS are also investigated. It is demonstrated that the various adjustments made in preparing Hadley SST versions combine to effectively removing long term variations from the climate record. Frequency analysis shows the adjustments generally disrupting, rather than improving the data.
00
.
Actual temperature records weren’t the only thing to take a credibility beating in the decimalisation process.
If you search the BoM website you will see they don’t give a precise definition of a “heatwave”.
However, if you read the press releases about heatwaves, you will see there is no doubt; for practical (press release) purposes the BoM now considers three consecutive days with a maximum above 35 degrees C to constitute a “heatwave”.
Which is fine, except that prior to decimalisation the definition was three consecutive days with a maximum above 100 degrees F. 100 Degrees F = 37.8 degrees C, NOT 35. Conversely, 35 degrees C = only 95 degrees F.
Quite apart from a 5 degree F, or 2.78 degree C lowering of the definition temperature, there is a another significant factor; 100 degree F is just above the human body’s natural temperature, by comparison 35 degrees C is comparatively significantly below normal body temperature.
Given that the number of days above any given temperature decreases with the increase in temperature, one can only wonder how many of our recent “record heatwaves” would have even cracked a mention under the old definition.
00
Quite true MV.
My favourite post decimalisation quirk was that news items regularly featured things that happend 160km, or 161km, or in the most extreme cases 160.9km from somewhere. Now you know that they had said, “How far is it to Bunbury”, and got the reply, “About 100 miles”. Then it gets reported, “Locals in Bunbury, 160.9km south of Perth, were surprised when….”.
00
+/- 0.25C?
Wow. Ask a 1st year chemistry student doing a chemical analysis what are the implications of say +/- 0.25 out of say 22(approx. mean) i.e. a .5 error range means for their results. If, it is as I read a =/- .25 error. Then to speak of warmings over a century of .4 is simpy nonsensical. The quoted variation is smaller than the error range.
Add to this the BOM press release last year where the average for the quarter was the mean of the monthly means. Not the mean of the daily temps for a quarter. Either, they are very stupid or are trying to deceive. I think the former.
00
The error introduced by doing this is tiny. We could do an example if you like. Lets say that for Perth the January average was 30.0, and for February, 31.2, and for March, 30.3. If we average the months we get 30.5. If we average the individual days we get 30.5 (before rounding, 30.4767). Of course, it could equally well give a lower value. Did you check whether it actually did for the 3 months you are talking about?
00
Quite correct, John, if the rounding is random there is no bias. This is addressed in the report I wrote. But as half of all sites had half of their data rounded (so half were worse) even a small amount of truncating will introduce an artificial warming. The adjustments made on the basis of so many sites with dodgy data introduce more unreliability.
Ken
00
Hmm, I don’t know about a professional audit – might be best to start by auditing the professionals…
00
Might be best to start implementing criminal proceedings
00
Why don’t you guys assemble a team of reputable scientists and get them to do a proper re-analysis? They could work out ways of identifying dodgy data and give it less weight in computing the temperature. They could figure out ways of making maximal use of short periods of data. Rather than trust to human judgement, they could use algorithms.
Lets see, we could call it BEST.
And guess what guys, it will get exactly the same results. But don’t worry. You could just go ahead and start worrying about the quality of temperature data in Chile, and repeat the process…. endlessly…
00
GIGO
The original data is gone. All that is left is fudged, manipulated and fiddled figures.
00
But John, demonstrating the same answer is not verification of the data. The problem here is verification. Getting the same but wrong answer from bad data using different analytical methods does not make it right.
00
John Brookes, Please make a formal list of the deficiences that you can prove in the composition, skills and experience of the present team and submit it here. Would you like to look at the libel law book before you apologise for naming me as not a reputable scientist?
00
Geoff, if you say you are a reputable scientist, I’ll take your word for it.
00
But the climate models, showing “global average temperature” to within tenths of a degree decades hence, are simply projections, and don’t need accurate data as input to give us a reliable result. Anyway, that’s not what matters, we have to DO SOMETHING!!!
Oh, look at the puppy!
00
But, but, but… The science is settled. Move along, there’s nothing to see here.
00
@John Brookes,
The temperature data has been fiddled with everywhere John. At this point it’s all speculation as to what the real figures might be.
http://notalotofpeopleknowthat.wordpress.com/2012/01/25/how-giss-has-totally-corrupted-reykjaviks-temperatures/
00
Congratulations and thank you to all those involved in this audit.
Your efforts are appreciated.
00
It is hard to imagine that the “gate keepers” of information @ BoM had no inkling of these possible sources of error in feed data which goes into their models, graphs & scary story State of the Climate releases.
It is not much wonder Warwick Hughes & others have to look to FOIs to find out how thoroughly the guys from BoM audited NIWA & their data & tem trend releases.
00
And this shows once more that the current round of global warming is indeed (mostly) MANMADE.
If I would be the sun I would get well pissed off getting no credit for all my effort to keeping it nice and relatively constant over here.
To all those who believe they can defy my efforts to keep you warm and create their own hot air.
Unthankful lot you are over here, tell you what I will go into hibernation for a while.
In ten years time when you all freeze your butt off we will talk again.
If you want to know how it is all going to work out track the weather records from about 60 years ago and go forward, it is all coming back again. But I might make it a bit colder this time.
The Egyptians had it right, they worshipped me as their most important influence in life and called me God, whatever that may mean. Those were the days.
Won’t be long and you lot will be happy again to see me and warm your sorry a…..
00
[…] Keep Reading JoNovas summary […]
00
Now add this to all the problems found by the USA surface station review (A.Watts) and you really get GIGO for the calculation of the Global Temperature.
How the heck can you say there was an increase of 0.x/century when you read the temp to the nearest whole degree and the guy doing it is some unpaid volunteer?
EPIC FAIL!
00
Gai,
I suspect a high proportion of the X.0C readings where not rounded but not read at all.
Observer down the pub “Cant be arsed checking the temp, i reckon its about 37”
00
These stations were not set up with the intent of developing a global time series of temperatures. As stated, the observers had no idea that their measurements would one day take on such a great significance. Rules for the use of data for secondary purposes should be adhered to.
My second observation is that these are solely temperature readings. There are no corresponding CO2 concentration measurements. There is even a case for relative humidity to be read at the same time as temperature given the water vapour influence on heating and cooling.
00
Thermometers at airports would have only been read in whole numbers as pilots would not be interested in the decimal place when calculating fuel loads at takeoff etc.
00
Crakar24, this is a really good thought. Likewise they would have almost always rounded up for warmer temperatures (for concerns re weight) and rounded down for near freezing. (for concerns re icing and slippery runways)
00
A couple of extra points that nobody seems to take into account:
– Until about the end of the 1950’s most, commercial thermometers were not made to very high standards of accuracy, e.g. ASTM thermometers were only calibrated (marked) at one degree intervals and the required accuracy was +/- half a degree irrespective of whether it was Celsius or Fahrenheit. In fact, at that time, many were still hand made.
– In rural Australia, very few of the weather stations met any recognised standards, e.g. the max/min thermometer was hung on a nail on the back verandah of the local Post Office and read at around 9.00am (or when somebody remembered) by the Post Master’s wife or whoever was handy. The tall handyman usually read it differently to the short Post Master’s wife. I know of one site where the thermometer was repositioned onto the back verandah after the new weather station was installed (from memory, about about 1951), because it was too far to walk in the rain! If no reading was rung through to the Weather Bureau, a suitable one was made up for the next time.
Of course, these are not scientific, verifiable comments, only anecdotal observations, which should not be treated as gospel as the observer has no scientific qualifications.
00
Temperatures are now measured electronically to 0.1 degrees but this might explain the recording to whole degrees: http://www.srh.noaa.gov/ohx/dad/coop/EQUIPMENT.pdf page 11
00
And GHCN are adding their own adjustments. Just look what they have done to Alice Springs.
http://notalotofpeopleknowthat.wordpress.com/2012/03/15/an-adjustment-like-alice/
00
Well done, great article.
00
[…] it all here. Bookmark on Delicious Digg this post Recommend on Facebook share via Reddit Share with Stumblers […]
00
Streetcred @ 5. This may be what you remember but if not, it sure highlights the point!
“I recall reading recently, one of the ClimateGate 2.0 emails regarding records of Australian temperatures from BoM. If my memory serves me correctly, the email lamented the poor quality of the Australian records.”
Quote:
■FOIA\documents\HARRY_READ_ME.txtgetting seriously fed up with the state of the Australian data. so many new stations have been introduced, so many false references.. so many changes that aren’t documented. Every time a cloud forms I’m presented with a bewildering selection of similar-sounding sites, some with references, some with WMO codes, and some with both. And if I look up the station metadata with one of the local references, chances are the WMO code will be wrong (another station will have it) and the lat/lon will be wrong too.
■FOIA\documents\HARRY_READ_ME.txtI am very sorry to report that the rest of the databases seem to be in nearly as poor a state as Australia was. There are hundreds if not thousands of pairs of dummy stations, one with no WMO and one with, usually overlapping and with the same station name and very similar coordinates. I know it could be old and new stations, but why such large overlaps if that’s the case? Aarrggghhh! There truly is no end in sight!
■FOIA\documents\HARRY_READ_ME.txt OH F..K THIS. It’s Sunday evening, I’ve worked all weekend, and just when I thought it was done I’m hitting yet another problem that’s based on the hopeless state of our databases. There is no uniform data integrity, it’s just a catalogue of issues that continues to grow as they’re found.
http://wattsupwiththat.com/2009/11/25/climategate-hide-the-decline-codified/
00
What was that someone said about weighting before?
00
That’s it, Keith, what a sleuth!
00
For nearly 3 years I collected some of this data. Apart from the thermometer problems(I’m not aware that the instruments in our Stevenson Screen were ever calibrated in those 3 years but I might have missed that)there are timing errors in the 9AM and 3PM readings by often a few minutes.
Plenty good enough for our local forecasting for RAAF operational purposes.
Forget about long term climatology though.
Anybody who thinks they can measure air temperature at 4 feet meaningfully to +/- 0.1 deg C is dreaming. I don’t care whether you are using mercury in glass or electronics. Just opening a Stevenson screen will cause errors. Electronics has all sorts of problems including self heating, drift of reference voltages etc. We’re not talking lab grade here but operational in the field.(I design and manufacture this sort of stuff nowadays)
I doubt that any of this instrumental stuff is all that meaningful for the small temperature changes we think we are seeing not matter how long we collect it for. The exposure will always vary, the sensor tech will change etc etc. Length of growing seasons seems a better integrated measure of change and historical writings and archeaology a better long term measure.
In any case we are in a short relatively ice free period between episodes of glaciation. Around 20,000 years ago the Earth/ocean/atmosphere system received a significant perturbation(hit with a giant baseball bat actually). Exactly what happened we’re not sure but it seems to me that seeing various oscillations in many measurable variables over all sorts of time scales as a result is not at all to be unexpected. Any changes in any one or more of the variables may not be all that meaningful and physical attribution may be impossible due to the complex interactions on many different time scales.
Yeah I just dissed the entire intra glacial field of climatology as probably meaningless.
00
Sorry that should read “intra inter glacial”
00
[…] Australian temperature records shoddy, inaccurate, unreliable. Surprise! […]
00
It is not just their temps that are dodgy. Visit an observing office and take a look at how other instruments are sited. I visited Darwin a few years ago (and being a pilot) was particularly interested in how they gathered the data I use for flight planning. I was stunned to find they measure air pressure inside and upstairs, in a sealed and airconditioned office. Their own specifications, and those of the WMO, are quite clear that the barometer should be measuring the free atmosphere at surface level. When I asked the duty met officer what the QFE (surface level pressure at the aerodrome) was he simply quoted the pressure off the barometer at about 20 feet above the surface which is WRONG. Not only that, the pressure is supposed to be expressed as an interger value (he quoted it to a decimal place; yes, it actually makes a diffence when rounded/truncated properly). I asked why they do it that way and he just shrugged and said they reckon near enough is good enough. Pretty poor attitude towards something that is so important. After all, that pressure reading is used to calculate the SOI. What are the consequences of getting the SOI calculations wrong? Is near enough good enough?
00
Back in 2002 when we moved to Noosa, Queensland I consulted BOM temperature records out of interest. Wanted to see historical low and high temps. and rainfall. Tewantin was the only inhabited place on the river a mile up from the sea had records going back over a hundred years.
Imagine my surprise when I found records from the 1930-1940 period showing low temperatures lower than minus 12C! This is in subtropical Queensland on the ocean!
I sent an email to BOM and received a reply thanking me for pointing our the errors (there were others) but saying it could be some time before they were corrected as they were very busy.I think it is likely the data was entered incorrectly from written records into a computer. The question is, what data was submitted to the IPPC?
00
In 2010, there was an excellent site “A Look at the Australian Climate Network” which unfortunately only went for a couple of months. It started with a post on “Dodgy Post Offices”, provided Google map links to the sites along with detailed graphs and data. It really made the BoM sit up and take notice as evidenced by this excerpt from one of Eloi’s posts and an exchange of comments to which I contributed as kayeveeh1.
“Burketown- but which one is it?
Summary:
The data from the stations in the No. 2 Queensland District are a shambles, to say the least. Across all the stations, there are no continuously unbroken data history prior to 1990, which means that any contribution to “climate records” from this District is – at best – guesswork. There also appears to be very little quality control of the basic station records – “Burketown” and “Burketown PO” seem to be used interchangeably. And finally, when in doubt about which station to include in the RCS, the default position appears to be to select the one that indicates a warming trend – however tenuous.
Posted by Eloi at 8:56 PM Labels: Burketown, RCS
Comments:
kayeveeh1Mar 31, 2010 03:36 AM
Eloi. The BoM map at
http://www.bom.gov.au/climate/change/reference.shtml gives 029077 Burketown Airport as their RCS reference station. Hope this helps.
EloiMar 31, 2010 04:01 AM
Hmmm – interesting. Yet another station that has been quietly changed in the night. Two weeks ago when I downloaded the list, it included:
029004 BURKETOWN POST OFFICE
After the first “Dodgy Post Office” post, they quietly changed Cunderdin PO to Cunderdin Airfield.
Something of a movable feast! Interesting that a 119-year-old station has been replaced by a 9-year-old station. Top quality stuff, that.
kayeveeh1Mar 31, 2010 05:58 AM
Things are certainly moving, literally, as a result of the spotlight being applied on these organisations by diligent people such as yourself from all over the world. As E.M.Smith says, if you find something interesting on the Net, download it fast because it’s likely to disappear! It does show that “the powers that be” are watching the blogs so I guess it’s good we can at least help keep the b——s honest !”
http://rcs-audit-blogspot.com/2010/03/burketown-but-which-is-it.html
Eloi noted and bemoaned the huge data loss statistically when record collection from the old Post Offices was changed generally to the town aerodrome. This is highlighted by the Burketown post above.
IMHO The site is still a treasure trove of information for anyone looking into the Australian BoM Records. Where are you now Eloi?
00
I actually asked the BOM why there are no error bars on the temp record in the 2012 climate report. Error limits are shown on their seal level records.
Still awaiting a reply – only asked some 36 hours ago so one could still arrive.
On a semantic point: Can one have a CLIMATE report for the year 2012?
Should this be a WEATHER report.
Not trying to be a pedant but much time is expended in explaining the difference – where climate is usually expressed over a generational period of say 30 years or so.
00
I’ve not read it, but I’s assume that the 2012 state of the climate report reports on the climate, not the 2012 weather.
00
I’ve not read it either Matt. Do you know which climate it reports on?
Perhaps it’s the tropical climate of the north.
Perhaps it’s the alpine climate of SNSW
Perhaps it’s the Meditterranean climate of SW WA.
Perhaps it’s the desert climate of the red centre.
Perhaps it’s the cool forest climate of Tassie.
Perhaps it’s the……….you get the idea.
00
Hi Matt, Baa, Ron, I have read the State of the Climate report and it reports on what is predicted for the climate- e.g. up to 5 degrees temperature increase, sea level rise, droughts, floods, less cyclones, more intense cyclones,the usual. The last 2 cool years are blamed on La Nina, but any hot years must be climate change.
Yes we would all like to see error bars on their temperature charts, but it might be a bit embarassing for them.
Ken
00
Well it looks now like Australia is officially a Dictatorship glad I left a long time ago
http://wattsupwiththat.com/2012/03/15/aussie-government-proposes-unlimited-speech-regulation-names-climate-skeptics-and-labor-critics-as-targets/#more-59235
01
“glad I left a long time ago”
hey wow me too!
00
Good Gawd, you guys lived together?
I’m sorry for you AFizzyfist…….
00
So which planet did you move to Matt?
00
I didn’t leave… I’m just glad fizzyfist left.
00
A gold fringed Australian flag at a Police media event recently indicates that the Police Force [not service] is now a military force. The police forces new riot control vehicles indicate that the government anticipates some opposition in the not too distant future. We voted for them, so we can’t complain.
00
Slightly O/T but relevant. My nomination for top question of the year goes to Simon at Australian Climate Madness, as highlighted in a post at ICECAP. Commenting on the latest report released by Australia’s top three alarmists from the Climate Commission (Prof. Will Steffan) and Science Advisory Panel (Professors Matthew Green, David Karoly)(as part of the current Government “carpet bombing” misinformation campaign through all it’s grants-bought loyal organisations and CAGW “gravy train” depedendents to reassure the gullible and try to intimidate and stifle doubters), Simon says:
“And from the report itself, right on cue comes the now hackneyed “consistent with” excuse:
The wetter conditions experienced in southeastern Australia in the last two years are consistent with scientists knowledge and understanding of how the climate is changing in the long term.
Because everything and anything is “consistent with” climate change, right boys?
Here’s a challenge for our three heroes: what weather event would not be “consistent with” climate change? Answers on a postcard. ”
http://www.icecap.us/
A simple enough question. Perhaps one of our own pet alarmists could answer. What about it John Brookes, MattB, Catamon, anyone?
00
No individual weather event would be inconsistent with “climate change”. Similarly no individual weather event should be used to confirm climate change.
00
for example… if in 100 years time the world is 5C warmer… and northern europe was frozen permenantly from London north… or it was raining 2000mm a year in the middle of the Sahara, or a one off coldest ever night was recorded in Alabama… none of these events would be inconsistent with climate change.
If in 100 years time the world was the same temp as today, and each of the events listed occured, that would not be an indication that AGW was happening (although the climate may well be changing for some other reason).
00
Really… Europe frozen from London north as an example of a one off event? I’d love to see the thaw in the summer.
00
Increases in atmospheric CO2 is supposed to lead to a WARMING, not cooling. Therefore the correct question would be “What weather events would be inconsistent with global warming”
It is silly to ask about “individual” events in the context of “Global” events.
Cooling would be inconsistent with warming. duh!
However when it comes to ‘climate CHANGE’, first one needs to define what climate is. Understand climate, define it, then compare and contrast any changes.
00
I would have thought the statement “AGW will cause more floods and more droughts” to be contradictory events and therefore could not be caused by the same thing (increasing CO2 in this case).
I also fail to see how an increase in snow over the past decade can be attributed to AGW, increasing snow cover = increasing cold, increasing cold cannot = AGW.
There are many more examples of the linguistic gymnastics we have to endure.
00
Oh and who could forget “I predict the Arctic will be ice free in the summer of
2010,2012,2014,2015some time in the future (Google “ice free arctic predictions” for a good laugh)Lets check that prediction shall we?
http://nsidc.org/data/seaice_index/images/daily_images/N_stddev_timeseries.png
00
MattB. Climate change needs no confirmation as it has been happening continuously since Earth was formed and will do so until Earth implodes/explodes or ends in some other way. As nothing has been proved to the contrary, the null hypothesis of natural variability is still the accepted cause. The hypothesis of AGW is unfalsifiable (which I think was the point Simon was making)and consequently a Fail.
AGW is not climate change so just to clarify Matt – are you saying your first scenario would be an indication that AGW was happening? You see, this is where the deliberate IPCC policy of doublespeak has introduced confusion as it was designed to do, when it was clear Anthropogenic Global Warming was not resonating with the general public. As hoped by the IPCC and warmists generally, AGW is now entrenched in gullible minds as “climate change” but it is therefore difficult to know in any discussion with you or any other AGW believer as to exactly which you are referring in any given circumstance.
01
So what you are saying Matt B, is that CAGW is an unfalsifiable hypothesis over the next 50-100 years.
Isn’t this convenient! The scientists, politicians, eco-engineers and bankers can continue to profit from the promotion of CAGW virtual reality with full impunity. (they will be old or dead by the time CAGW is finally accepted to be a scam).
Meanwhile, everyone else suffers as our money is syphoned into solving a problem that doesn’t exist.
Welcome to the 21st century!
00
Can I be the first to suggest “BoMgate”?
00
Umm,
perhaps this is a BoM waiting to go off.
Tony.
00
Ha ha good one tony,
Maybe we should rename it BOOM (Bureau Of Outrageous Meteorology)
00
all in the name of CAGW. when will Flannery & Co be called to account?
16 March: Andrew Bolt: Queensland flood inquiry report released
UPDATE
Three dam engineers are recommended for referral to Queensland’s crime commission. It seems they did not manage the dam releases according to the manual for two days…
http://blogs.news.com.au/heraldsun/andrewbolt/index.php/heraldsun/comments/queensland_flood_inquiry_report_released/
12 March: Courier Mail, Australia: Flood victims sign up to sue State Government over January 2011 disaster
AN ATTEMPT to sue the State Government for the damage caused by the January 2011 flood is shaping as the largest class action Australia has ever seen, a group of flood-affected residents was told yesterday.
The move to sue the Government for damages is gathering momentum, with nearly 300 people packing a community meeting in Chelmer yesterday.
There are believed to be more than 1000 people signed for the “no win-no fee” action…
http://www.couriermail.com.au/news/queensland/flood-victims-sign-up-to-sue-government/story-e6freoof-1226296493281
00
sincere thanx must go the Hedley Thomas, without whom the truth may never have come out:
16 March: Australian: Hedley Thomas: Dishonesty, collusion and flood victims taken for mugs
IT is now official – the final report of the floods inquiry has found there was a serious cover-up over the devastating floods last year.
It involved collusion, dishonesty and lying. The inquiry found three engineers presented false evidence after the event in an attempt to protect their professional reputations.
The cover-up concealed a breach of the operating manual for Wivenhoe Dam, Queensland’s most dangerous and powerful infrastructure, between 8am on January 8 until the evening of January 9, according to the findings…
http://www.theaustralian.com.au/in-depth/queensland-floods/dishonesty-collusion-and-flood-victims-taken-for-mugs/story-fn7iwx3v-1226301577641
00
if a class action lawsuit does go ahead, surely the Federal Govt and its CAGW policies must be held responsible!
00
ah, but the “climate gods” can predict the precise climate 100 years into the future!
16 March: SMH: AAP: CMC should investigate dam engineers
She (Commissioner Catherine Holmes)found flooding in Brisbane and Ipswich could have been reduced to some degree, if capacity in the dam had been freed up before the December deluge.
But she said it simply wasn’t possible to have forecast what was to come.
“… to appreciate what the magnitude of the rain would be and that it would fall in the dam area would have required a more than human capacity of prediction,” she found…
http://news.smh.com.au/breaking-news-national/cmc-should-investigate-dam-engineers-20120316-1v95d.html
00
why don’t the farmers stand up and tell the govt to get lost:
16 March: Armidale Express: Victoria Nugent: Farmers focus on carbon concerns at forum
Farmer Robert Gordon from Guyra said he found the forum informative, particularly in regard to the Carbon Farming Initiative, which offers ways for farmers to generate and sell carbon credits.
“I think it highlighted the complexity of the whole Carbon Farming Initiative and the paucity of information relating to the cost and benefits of carbon farming initiatives,” Mr Gordon said…
“It’s been well worthwhile, certainly I know more about carbon sequestration on the farm than I did before, but I’m not quite sure how we’re going to put that knowledge to use,” Mr Swales said.
“There’re a lot of unanswered questions there yet.”
Mr Swales said he thought carbon taxation would have a significant impact on the agricultural industry.
“It’s certainly going to impact on our operation,” he said.
“At this stage, all I can see is cost, not return.
“Even though agriculture is not going to be directly taxed, it’s certainly going to have a big impact on things like fertiliser and electricity.” …
http://www.armidaleexpress.com.au/news/local/news/general/farmers-focus-on-carbon-concerns-at-forum/2490588.aspx
unless taxpayers revolt, this rort will never end:
15 March: Business Week: Sally Bakewell: U.K. ‘Wasted’ 4 Years on Failed $1.6 Billion Carbon-Capture Plan
The U.K. must learn from a failed 1 billion-pound ($1.6 billion) carbon-capture funding program that “wasted” four years, as it prepares to open a second financing competition, the head of a panel of lawmakers said…
By last year, Iberdrola SA (IBE) was the only utility left in the contest after developers including BP Plc (BP/) and EON AG (EOAN) shelved projects. The final bid was scrapped in October as Iberdrola was unable to build its proposed Scottish plant within the budget or agree to the contract terms.
The government is preparing a new funding program, with a view to starting commercial operations in the 2020s, Energy Minister Charles Hendry said Feb. 27…
http://www.businessweek.com/news/2012-03-15/u-dot-k-dot-wasted-4-years-on-failed-1-dot-6-billion-carbon-capture-plan
00
guess CAGW projects will be exempt!!!!!
14 March: UK Telegraph: Jonathan Sibun, Louise Armitstead:
UK could lose coveted AAA rating, warns Fitch
The Treasury said the decision by Fitch to follow suit was a lesson to anyone hoping for giveaways in next week’s Budget…
“This is just another warning to anyone who believes there can be deficit-financed giveaways.” …
The move by Fitch represented a second major blow for the Chancellor after the UK’s leading pension group criticised plans to issue 100-year gilts and warned that most of its members will not buy them.
The National Association of Pension Funds (NAPF) said the proposed term was “too long” and not an attractive investment proposition.
http://www.telegraph.co.uk/finance/economics/9144551/UK-could-lose-coveted-AAA-rating-warns-Fitch.html
00
TonyfromOz –
could you or someone else please post here and on the Bolt thread (not sure if a comment i posted there will go up now that u have to register or whatever )approximately how many years of supply a full Wivenhoe can hold, because there are many people who have no idea how large it is, so think it was necessary to fill ‘er up.
00
Hi Jo and contributors.
I’ve recently been analyzing the published BOM data for global average temperature anomaly between years 1850 and 2010
http://www.bom.gov.au/cgi-bin/climate/change/global/timeseries.cgi
I have downloaded and plotted the global, southern hemisphere and northern hemisphere time series and performed a series of calculations:
A couple of things immediately struck me as odd.
Let Northern Hemisphere tempersture series = N1, and Southern Hemisphere temperature series = S1
1. The high degree of correlation between N1 and S1
COR(S1;N1) = 0.89
2. The very small average delta between N1 and S1
AVERAGE(ABS(N1-S1)) = 0.13 degrees
Let me explain why I find this so strange…
I would have expected that the North and South Hemispheres would display very different averages within the same year. Assuming that this data considers satelite, land based thermometers and weather baloons, how is it that the average delta between N1 and S1 is ONE TENTH OF A DEGREE???
How does the BOM calculate these averages?
00
Hi Jo, I’ve been a long time reader of your blog and this is my first comment.
I have always found that the discrepancy between the B.O.M. rainfall readings and my own recordings interesting. I live in suburban Robina on the Gold Coast and have been recording rainfall in two gauges (one front yard, the other backyard) for the last 12 months or so.
Example: 25th February 2012, BOM Gold Coast Seaway: 79.4mm
BOM Coolangatta: 80.4mm
My rain gauge (1): 508 mm
My rain gauge (2): 536 mm
Example: 26th February 2012, BOM Gold Coast Seaway: 23.2mm
BOM Coolangatta: 13.6mm
My rain gauge (1): 6mm
My rain gauge (2): 4mm
Sometimes the difference between the front and backyard is over 50 mm!
Robina is 5 km west of Broadbeach.
00
Bad start. Jan 25 BOM GC Seaway 178.2mm
BOM Coolangatta 164.4
Jan 26 BOM GC Seaway 38.0mm
BOM Coolangatta 81.6mm
00
508mm! Wow! I’m glad I don’t live where you do.
00
no warming here so I don’t think there is anything to panic about.
00
16 March: Ninemsn: Qld flood report strengthens case: lawyers
Maurice Blackburn partner Rod Hodgson said the report, including its finding that Wivenhoe Dam’s operating manual was breached during the disaster, confirmed victims’ suspicions.
“… too much water was allowed to accumulate in Wivenhoe Dam and the strategy for water releases was botched,” Mr Hodgson told reporters after the report’s release on Friday.
“This extraordinary report says that beyond any doubt that dam was not operated the way it should have been.”
He said the findings gave the firm confidence to recommend a class action to any flood-affected businesses, community groups and home owners downstream from the dam.
But he said a class action was not a fait accompli.
“Further investigation work is needed to be done,” Mr Hodgson said.
“The investigations need to include how much difference to the flood level the proper operation of the dam would have made.
“We sense that it would have made a significant difference, but we need to conduct independent hydrodynamic modelling.”
He said he expected that would take some months…
Ipswich Councillor Paul Tully said the report was not the whitewash he’d expected.
“It is quite explicit. It really opens the doors for a class action,” he said.
“It is an opportunity for people who were not insured and lost everything to be able to recover something.”…
The lawsuit could potentially run into the billions…
http://news.ninemsn.com.au/national/floods/8436441/qld-flood-report-strengthens-case-lawyers
00
16 March: Brisbane Times: Queensland floods inquiry opens the way for class action
”If they want to settle the matter in court they are entitled to do that and I would never seek to deny someone their right to do so,” she (Premier Anna Bligh) told reporters in Brisbane today…
Ms Bligh said Seqwater had commercial insurance to protect against these sort of events.’
‘It will be through their insurance that they work through any claims made against them,” she said…
***She said she would seek advice about whether the state government would be paying the engineers’ legal costs…
http://www.brisbanetimes.com.au/opinion/political-news/queensland-floods-inquiry-opens-the-way-for-class-action-20120316-1vac2.html
***how about billing Flannery, Garnaut and the rest..
00
I’m pretty sure the Insurance companies will be looking at their legal options. They will not want to wear major financial losses just to be nice to SEQ Water because someone stuffed up and then tried to cover it up. Also remember about the flak they have been of the receiving end of, from the media and many in the Govt, in particular local councils (who often allowed the building in flood prone areas to begin with). The insurance companies were just expected to pick up the tab for it all, even the outright uninsured and even if it sent them under. There was a lot of beating up on insurance companies and whipping up of public emotion. People took out policies that did not cover them for the risks of the area they lived in (this was often an active decision as to insure for Riverina flood added between 1000 – 2000 extra to their insurance bill). Did people not take out the right insurance because they thought that type of flood unlikely? After all, our dams were never going to be full again!!!!
The Insurance companies’ re-insurance costs are now so high they have had to pass on exponential policy rises to all their customers or the risk is to go under if they are unable to service the remainder of the policy holders in another crisis. I’ve just had an increase because I now have to be covered for all types of flood (flash and Riverina), even though I don’t live in a Riverina flood prone area or even flash flood for that matter (more danger from fire with surrounding bush).
00
Hi Pat, one would ask the same question about the Water Commissioner and the Premier of Queensland because the water was said to be worth 2.6 Billion dollars. It all comes down to money and not what’s best for society.
00
my final word on the flood report:
why can’t a journalist, any journalist, ask the Queensland Premier if her policies regarding Wivenhoe and water in general would be same if she didn’t BELIEVE in Manmade Global Warming?
00
That would be too much like real journalism.
00
‘real journalism.’ Could almost be an oxymoron.
00
Just looking at the BOM section for employment!
The last point 4. is the worry – the only way a data provider (BOM) can aid implementation of a Government policy like the CO2 Tax in justifying the CAGW senerio is to change or alter the data via the exact same methods outlined in the article above by Ken Stewart, Chris Gillham, Ian Hill, Ed Thurstan and Geoff Sherrington (and Jo).
The APS is also in need of a large shakeup – boarding on criminal!
00
Forgot one thing –
Why does it take this –
An independent audit team has just produced a report showing that as many as 85 -95% of all Australian sites in the pre-Celsius era (before 1972) did not comply with the BOM’s own stipulations.
All with a zero budget compared to BOM’s multi millions!
BOM and CSIRO should be ashamed of these findings! Quality Assurance is not in their mission statement!
00
Spot on Dave!
4. The APS is responsive to the Government in providing frank, honest, comprehensive, accurate and timely advice and in implementing the Government’s policies and programs.
The key phrase is “in implementing the Governments policies and programs”.
So the policy and program (aka “the cause”) precedes the data, results and advice.
This is exactly the United Nations approach to science. (Read Agenda 21).
Government scientists are not scientists in the traditional sense – searching for truth and reality.
They are to provide the “truth” and “reality” to support the policies of the adults who pay their salaries!
This is called psuedo-scientific propaganda.
00
Jo,
If you did this same study in many areas of science, you would probably find the same complacency by our scientists.
Many scientists just do a good enough job just for the funding and pay check. Not actually caring about accuracy or even interest in science.
This is why I do not have ANY trust in our scientists and would sooner follow the path of the evidence and clues that our “consensus scientists” ignore.
It has given me a far greater understanding of our planet and the complexities with following the mechanics and NOT the data that scientists have turned into statisticians.
This is how I found scientists totally missed motion and velocities.
00
The latest release from the BOM and CSIRO condemn them selves.They use a graph that showes tempepature has increased 1C from 1910 until 2010 half by 1960 and the rest by 2010.Readings in CO2 in the atmosphere started in 1958 and have increased from 310 ppm to 390 ppm by 2010.The first 50 years is estimated to show 1910/60 only 20ppm increase of CO2 in the atmosphere for a point 5 increase in temperature to 310ppm.The second 50 years shows an increase to 390 ppm an increase of 80 ppm of CO2.This proves CO2 is not causing warming as the temperature increase is the same for each 50 years Good Luck Jo and David
00
Hi Peter,
I wouldn’t say it ‘proves’ CO2 is not to blame for 1960 to 2000 warming, however it demonstrates that from 1900-1940 some other factor must have causes the warming.
If you evaluate the average gradient of the 10 year running average between the 1900-1940 period you will see that its steeper than the 1960-2000 warming.
Therefore my conclusion is that it is impossible to determine to what extent additional CO2 has warmed the environment since the 0.4 degree rise over that period could just as adequately be explained by the natural causes operating from 1900-1940 (and indeed beyond)
When you then consider the tiny fractions of degrees (0.4 degrees warming is not perceptable to humans) along with the problems with data quality and processing you would have to be an idiot of the highest order to live and die by the “CO2 done it” mantra.
00
What temperatures depending on something other than CO2? The scientists will be shocked!
Oh wait, they already know there are other factors, and take them into account. Silly you.
10
No, silly you John.
You didn’t remotely address the points raised in my post but resorted to the hand waving argument, “the scientists have considered everything”.
Congratulations, you’ve outsourced your brain to government employees. (or are you one John?)
00
The latest CSIRO/BOM statement claims that Australia’s average mean temperature has risen 1.0C in the past 100 years.
Does anyone know how this was calculated?
00
No, but with a bit of digging I’m sure the data is massaged to enhance that figure rather than accurately and honestly reporting the objective truth.
But then again, these ‘scientists’ jobs are to provide ‘advice’ to government in implementing their policies, e.g carbon tax, carbon trading schemes etc.
It’s a different kind of scientific ethics that operates today, and it stinks.
00
The data for the Southern Hemisphere between 1910 and 2010 used by the BOM, shows a 0.8 degree increase in the ten year running average.
So they have only exaggerated the figure by 20%, assuming that Australia and the Southern Hemisphere show similar warming trends. This is fairly conservative by the standards of government climate scientists – the unethical bastards.
I would be interested to see the mean global temp anomaly for Australia only and compare with the Southern Hemisphere.
00
I ran some data from a few long-term stations looking at the average mean temps from 1891-1920 and compared them with 1981-2010. Sydney, Melbourne and Perth all exceed the 1.0C increase but many of the rural areas showed very little change – some were up to 0.5C above and some were 0.5C below.
Newcastle (Nobbys) was 0.3C above but Darwin was 0.4C below. It was hard to find stations that have been in continual operation since 1890, and I had to compare say Darwin PO with Darwin AP.
From the stations I looked at, the impression I get is that the rural stations have not changed greatly and the cities tended to have the greater warmer. I can’t see how they can arrive at a 1.0C increase for the past 100 years.
(I used the 30 year decadal means from the BOM website).
00
Looks like HIA is at play here. Perhaps we need to have a variable carbon tax that increases based on your proximity to city center, airports, car parks, and roads.
00
Hi Ian, I was wondering about trends for specific stations like those in the heading article that are compliant from the audit perspective, were you able to use any of those as a point source for a local trend?
Also is it is possible to compare the rate of temperature change that you noted in the capitals with population growth in those centres since greater urbanisation would imply increasing temps in that vicinity?
00
I just used the relevant 30 year averages on the following BOM websites.
Sydney 1891-2010 temp means
http://www.bom.gov.au/jsp/ncc/cdio/cvg/av?p_stn_num=066062&p_prim_element_index=0&p_comp_element_index=0&redraw=null&p_display_type=statistics_summary&normals_years=1891-1920&tablesizebutt=normal
Sydney 1981 – 2010 temp means
http://www.bom.gov.au/jsp/ncc/cdio/cvg/av?p_stn_num=066062&p_prim_element_index=0&p_comp_element_index=0&redraw=null&p_display_type=statistics_summary&normals_years=1981-2010&tablesizebutt=normal
As for population change, there is some evidence that UH increases in larger populations. Nobbys LH in Newcastle is less affected by UH than say Sydney or Melbourne. Hobart, Adelaide and Darwin have not changed greatly, maybe due to smaller populations, but Perth is an exception.
00
From their HQ series, which I calculated to have a warming trend of about 0.85 which is a 25% warming bias on the raw data. I think they use a distance or area weighting to get their final figures.
Based on this study, I don’t think any calculations of trends are credible any more; and anyway I think surface temperatures are minimally relevant to climate study: too much uncertainty.
Ken
00
I regard the HQ site as suspect. For instance, Lismore (Centre St – now closed) records an average max temp for 1915 as 27.4C. The HQ site shows it at 26.7C – an adjustment of 0.7C. I read somewhere that the BOM adjusted pre-1950s down by up to 0.7C (probably using the area weighting adjustment you allude to) but rarely adjusted after 1980.
Just check it out.
Lismore raw data
http://www.bom.gov.au/jsp/ncc/cdio/weatherData/av?p_nccObsCode=36&p_display_type=dataFile&p_startYear=&p_c=&p_stn_num=058037
Lismore HQ graph
http://reg.bom.gov.au/cgi-bin/climate/hqsites/site_data.cgi?variable=maxT&area=nsw&station=058037&period=annual
Maybe others can find more examples but I’m sure Warwick Hughes and Geoff Sherrington et al know more than I do.
00
All this once again draws me to three possible conclusions:
1. That the climate establishment are so confident in their theory that they honestly believe the only reason they haven’t found the missing heat is a problem with measurement not a lack of positive feedbacks.
2. It is a grab for global money and power by the left, UN, major finance houses etc.
3. A combination of 1 and 2.
My guess is 3 but I still fear 2.
00
Climate records, Australian or otherwise, are good for one thing: analysing natural cyclic trends and then extrapolating such. But this may be work for statisticians rather than climatologists, judging by past performance …
Climatologists love to talk about energy being trapped by carbon dioxide and thus not exiting at the top of the atmosphere (TOA.)
It is nowhere near as simple as that. All the radiation gets to space sooner or later. Carbon dioxide just scatters it on its way so you don’t see radiation in those bandwidths at TOA. The energy still gets out, and you have no proof that it doesn’t, because you don’t have the necessary simultaneous measurements made all over the world.
In the hemisphere that is cooling at night there is far more getting out, whereas in the hemisphere in the sunlight there is far more coming in. This is obvious.
When I placed a wide necked vacuum flask filled with water in the sun yesterday (with the lid off) the temperature of the water rose from 19.5 deg.C at 5:08am to 29.1 deg.C at 1:53pm while the air around it rose from 19.0 to 31.9 deg.C.
What did the backradiation do at night? Well from 9:15pm till 12:05am the water cooled from 24.2 deg.C to 23.4 deg.C while the air cooled from 24.2 deg.C to 22.7 deg.C.
According to those energy diagrams the backradiation, even at night, is about half the solar radiation during the day. Well, maybe it is, but it does not have anything like half the effect on the temperature as you can confirm in your own backyard.
This is because, when radiation from a cooler atmosphere strikes a warmer surface it undergoes “resonant scattering” (sometimes called pseudo-scattering) and this means its energy is not converted to thermal energy. This is the reason that heat does not transfer from cold to hot. If it did the universe would go crazy.
When opposing radiation is scattered, its own energy replaces energy which the warmer body would have radiated from its own thermal energy supply.
You can imagine it as if you are just about to pay for fuel at a gas station when a friend travelling with you offers you cash for the right amount. It’s quicker and easier for you to just pay with the cash, rather than going through the longer process of using a credit card to pay from your own account. So it is with radiation. The warmer body cools more slowly as a result because a ready source of energy from incident radiation is quicker to just “reflect” back into the atmosphere, rather than have to convert its own thermal energy to radiated energy.
The ramifications are this:
Not all radiation from the atmosphere is the same. That from cooler regions has less effect. Also, that with fewer frequencies under its Planck curve has less effect again.
Each carbon dioxide molecule thus has far less effect than each water vapour molecule because the latter can radiate with more frequencies which “oppose” the frequencies being emitted by the surface, especially the oceans.
Furthermore, it is only the radiative cooling process of the surface which is slowed down. There are other processes like evaporative cooling and diffusion followed by convection which cannot be affected by backradiation, and which will tend to compensate for any slowing of the radiation.
This is why, at night, the water in the flask cools nearly as fast as the air around it. The net effect on the rate of cooling is totally negligible.
The backradiation does not affect temperatures anywhere near as much as solar radiation, even though its “W/m^2” is probably about half as much.
And there are other reasons also why it all balances out and climate follows natural cycles without any anthropogenic effect. This is explained in detail in my peer-reviewed publication now being further reviewed by dozens of scientists.
http://principia-scientific.org/publications/psi_radiated_energy.pdf
.
00
[…] Australia, a new report is out which exposes severe quality problems with the official temperature records […]
00
Good t shirt messages on Judith Curry’s blog by John from CA & tomfp;
‘Drop the BOM before it is too late’ and ‘Bin the BOM’
(So git yer message t shirts and write yer letters.)
00
David Jones the BOM leading climatologist warned that 2012 was off to a real scorcher,HeraldSun 8/1/12.The frequency of heatwaves in Victoria is increasing.The atmosphere is overloaded with CO2 and its warming our world.The fact the predicted heatwaves did not occur,shows CO2 is not to blame.The former principal research scientist at the CSIRO Colin M Barton said the release of data from the CSIRO and the BOM supporting human-induced global warming shows they are inappropriately using regional Australian weather as evidence of global temperature change.The world wide satellite measurements show that global warming has stopped despite rising atmospheric CO2.As for proof that extreme weather events are on the increase,or that human emissions cause any noticeable warming beyond natural change,the confirming evidence is lacking.In Colins view this is more about politics ,and less about science.
00
[…] http://joannenova.com.au/2012/03/australian-temperature-records-shoddy-inaccurate-unreliable-surpris… […]
01
Way to make a story about nothing!
Climate observations are simply an accumulation of weather observations over a long period. Weather observation readings of temperature are done to one decimal point, as that is the best accuracy you get just by simply looking at a thermometer.
Transmission considerations means they are often rounded to whole numbers (15.7 takes 4 digits to send, 16 uses 2). The original readings – still to one decimal place – are in the written logs that are still available as the national record. There is no “suspicious problem”!
You accuse the BOM of being unprofessional, and appearing to be making unfounded assumptions, and yet you write nonsense like this: “A few things we can say for sure is that observers (who were unpaid a lot of the time) didn’t know how much stock would be placed on their records years after they were taken”. How can you possibly know that FOR SURE? Where is your evidence?
You also wrote: “The cold mornings tended to strip their enthusiasm, possibly explaining why minima records are less accurate than maxima”. Again, let’s see some evidence for this hogwash.
You cite Torok and Nicholls from a 16-year old paper to suggest climate scientists agree with you. You seem unaware that useful results can be achieved by applying sound scientific corrections to data that may be in error. I have worked worldwide and have never, in over 30 years, met anyone who would truncate data down by a whole degree. Even back in 1996, Torok and Nicholls also “…did not think the practice was common”.
Final point: even if the entire Australian dataset was utter rubbish – which it isn’t – there is WORLDWIDE evidence from multiple sources to show that climate change is real and we need to stop listing to people who try to confuse the issue by focussing on minutia.
11
This is the same Chris Gillham who doesn’t even know how to take a block average?
See: https://theconversation.edu.au/peer-review-isnt-perfect-and-the-media-doesnt-always-help-11318
00
#76 states “The world wide satellite measurements show that global warming has stopped despite rising atmospheric CO2.”
No, satellite measurements do not show that.
See
http://www.woodfortrees.org/plot/uah/from:1980
which plots the UAH data for lower troposphere global mean.
Or you could try the GISS data at
http://data.giss.nasa.gov/cgi-bin/gistemp/nmaps.cgi?year_last=2013&month_last=2&sat=4&sst=3&type=anoms&mean_gen=02&year1=2013&year2=2013&base1=1951&base2=1980&radius=1200&pol=reg
current at Feb 2013.
Neither data set shows global mean temperature has stopped. Because it hasn’t.
02
I have long suspected that this may be a problem. As is the accuracy of readings taken by volunteers, the placement and state of the equipment, the actual interest taken by the observer (Property owner, Boss, Stockman or Rousy?” even early, on the literacy of the ‘records keeper’ could in places have been a problem. Add to that a vested intrest in irrigation or drainage and you could open a minefield of suspect readings. I have seen farm where they checked the water gauge once a month, if that. After all it just didn’t rain. Then when it did the gauge overflowed or flowed away. Similar ennui with temperature readings. Hot. hotter and bloody hot are all temperature readings we can equate too. However this does not invalidate the readings for any particular district, unless there existed area wide conspiracies of results to ensure particular outcomes such as drainage or irrigation. Not saying it happened but knowing how close mouthed these remote family run districts can be. Its a possibility. There would be no records of such agreements between gentlemen either. However a close review of the data would show previously unnoticed blips. Would you be prepared to take note of such anomalies…I wonder? Thats the trouble with history and science, the results sometimes don’t fit your earlier ideas and you have to publicly change your mind. But I agree with your suggestion that the results be fully reviewed, especially with regard to the conversions.
Then these have to be explained to the public. At this point any Science group has to consider the demographic. Almost as if there has to be three non exclusive reports. The summary from which the tabloids would grab their headlines. Dependant on their bias that same summary will be rewritten by the media to suit their audience. Then would come a report for those of us who would find two decimal places to be enough. I fit there, my head sort of starts to swell when i see large rows of numbers, so do most pollies. Graphs are great for us you can form the graph from the series and major report.
That final couple of numbers to the third or fifth place, just confirms things for the boffins who will of course, simply end up confirming what most of us already know. and its getting hotter for longer periods.
So yes, you seem to have raised a valid point here and I support your call to review the figures and conversion. I would also like the records to be reanalyzed in a Socio Historical context, so that any anomalies or blips can be explained without skewing the overall result.
Finally we now many other methods of double checking records. Tree rings, Coral growth,
Sand and mud flows, moss growths and historical imagery, (just why aren’t we using early paintings, photo’s and descriptions to replicate the previous landscape, which was relatively wildfire proof, in our cool burns…bah a digression)These are just some of the tools available to check the last 150 years and earlier.
I hope you do get the records checked and even corrected if necessary. It will add a great deal of proof of AGW. As if there is not enough already. Still if I could find just one proof that holds up against the fact that we have just pumped too much and many gases into the air. And not given enough thought to the side effects. Then I will change my mind and publically admit it. Would you?
00
There’s no mystery to the rounding in deg F. Have a look at the NOAA standard for temperature measurement on page 11.
“Record temperatures in whole degrees only.
For example, if the display shows a temperature of 76.5, record “77”.For a temperature of 76.4, record “76)
http://www.srh.noaa.gov/srh/dad/coop/EQUIPMENT.pdf
00