By Jo Nova
It’s just another scientific study doomed to disappear
A Norwegian whaler paid for 2,200 aerial photos of East Antarctica in 1937. Since then humankind has emitted 91% of all the emissions we’ve ever produced and the world is facing an extinction level catastrophe and yet satellite photos show this 2,000 kilometer long section of East Antarctica hasn’t changed — or at least, not in any way related to our uptake of coal power or planes, trains, airconditioners and cars. Basically the human race emitted 1,600 billion tons of carbon dioxide which was supposed to warm the poles twice as fast as anywhere else, but there is still nothing to see here.
Belated Thanks to Tallbloke for the first article I saw on this.
2,000 km of Antarctic ice-covered coastline has been stable for 85 years
Using hundreds of old aerial photographs dating back to 1937, combined with modern computer technology, the researchers have tracked the evolution of glaciers in East Antarctica. The area covers approximately 2,000 kilometers of coastline and contains as much ice as the entire Greenland Ice Sheet.
Compared to modern data, the ice flow speeds are unchanged. While some glaciers have thinned over shorter intermediate periods of 10–20 years, they have remained stable or grown slightly in the long term, indicating a system in balance.
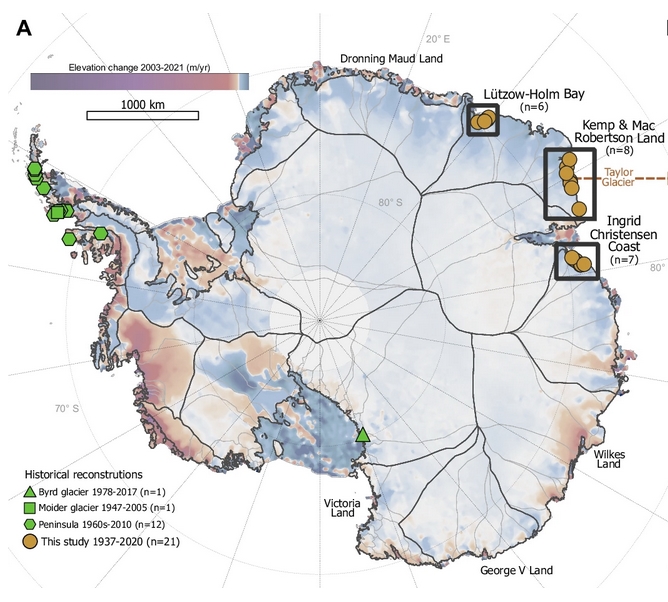
A Existing historical glacier reconstructions (Byrd11, Moider32 and Peninsula31) and glaciers included in this study (frontal reconstructions n = 21, elevation reconstructions n = 12, velocity reconstructions n = 4), overlaid on 2003–2021 Antarctic annual elevation change from Smith et al5., with MEaSUREs basin72
Imagine the fuss if these old photos showed a glacier melting?
Most of the images used in the study were captured during a 1937 expedition organized and paid for by Norwegian whaler Lars Christensen. The mission aimed to produce the first maps of this part of East Antarctica, but the maps were never published due to the German invasion of Norway. Since then, the images have been stored at the Norwegian Polar Institute in Tromsø and forgotten.
When the researchers from the University of Copenhagen read about the expedition, they realized that valuable images were likely hidden in an archive in Norway. They traveled to Tromsø and reviewed all 2,200 images taken during the expedition. They supplemented the Norwegian aerial images with images of the same glaciers from Australian surveys conducted between 1950 and 1974.
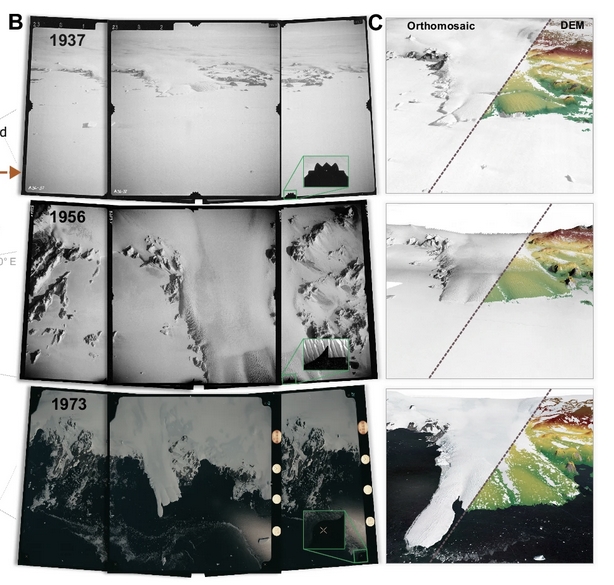
B Taylor glacier in 1937, 1956, and 1973 as captured in the aerial images. Close up shows the different types of fiducial marks used for standardizing the internal image geometry. C Produced digital elevation models (DEM) overlain on orthomosaics generated from interpolated DEMs. For the productions of the 1956 DEM and orthomosaic we included additional oblique images (not included here) as the glacier was photographed with a trimetrogon camera setup.
During the last few decades, several sectors in Antarctica have transitioned from glacial mass balance equilibrium to mass loss. In order to determine if recent trends exceed the scale of natural variability, long-term observations are vital. Here we explore the earliest, large-scale, aerial image archive of Antarctica to provide a unique record of 21 outlet glaciers along the coastline of East Antarctica since the 1930s. In Lützow-Holm Bay, our results reveal constant ice surface elevations since the 1930s, and indications of a weakening of local land-fast sea-ice conditions. Along the coastline of Kemp and Mac Robertson, and Ingrid Christensen Coast, we observe a long-term moderate thickening of the glaciers since 1937 and 1960 with periodic thinning and decadal variability. In all regions, the long-term changes in ice thickness correspond with the trends in snowfall since 1940. Our results demonstrate that the stability and growth in ice elevations observed in terrestrial basins over the past few decades are part of a trend spanning at least a century, and highlight the importance of understanding long-term changes when interpreting current dynamics.
And for those who want to see the ebb and flow here are the detailed graphs of those 21 glaciers. Click to enlarge. It’s obvious that without long term data and climate models that work (which can predict precipitation) we have no chance of predicting glacier growth or loss, and nor should we infer long term prophesies from 20 or 30 year short cycles. Even 85 years of somewhat minimal data shows there is a lot of variation, and none of it apparently related in any obvious way to man made CO2 emissions.
https://www.nature.com/articles/s41467-024-48886-x
Thirty years of propaganda won’t die easily:
REFERENCE
Mads Dømgaard et al, Early aerial expedition photos reveal 85 years of glacier growth and stability in East Antarctica, Nature Communications (2024). DOI: 10.1038/s41467-024-48886-x


Amazing plasticity. It rains or snows on the poles. The ice builds up and puts a vertical load on the older ice beneath it.
That pressured ice is squashed between the ice overhead and the solid rock below. Seeking the path of least resistance the ice under load slowly gives way and moves sideways towards lands edge, near the water.
Most of us are familiar with the fact that if you smack ice with a hammer it will shatter: it doesn’t have time to flow. Under a constant slow load the ice will slowly change shape but “hold together” in a new deformed shape.
[Edited slightly – Jo]
190
The Moon has a stable surface topography.
40
Today saw an extremely high tide locally and big surf to match.
Apparently the moon is in the right spot to exert max pull on the ocean.
90
Is that what causes the boiling?
160
We are approaching a new moon which produces king tides.
However the atmospheric pressure also has an effect on tides.
And strong winds also push sea levels up.
I had a look at the BOM weather map which showed low pressure system over the east coast two days ago which would contribute to both the high tide and the big surf.
110
All my life I have been hearing “official” cyclone warnings in which the rotating, low-pressure cyclone is often associated with a higher thsn normal” (King?) tide.
Cause or “conincidence”?
40
Next new moon is this Friday: last Friday was a half-moon, Saturday it ‘crossed the equator’ heading north, Sunday was perigee (12th closest of the year), Monday that low formed in the Tassie (Sea).
While NSW is on the receiving end of cool southerlies and choppy storm surf, we, on the other hand, are enjoying [the hottest beginning of June EVAAAH?] calm, mild, sunny, pleasant days – if this is ‘change’, I like it! However, I know this, too, will change.
110
Thanks again for your efforts Jo and we also know that the Antarctic Peninsula has cooled over the last 25 years according to the Turner et al BAS study.
And Andrew Bolt’s interview with Daniel Fitzhenry also showed no unusual SLR at Fort Denison in Sydney since 1914.
Yet we also know that SLs on our Aussie east coast were 1.5 metres higher just 4,000 years ago at the end of the Holocene climate optimum.
And during the much warmer Eemian interglacial temperatures were 8 c warmer than today and SLs were 6 to 9 metres higher as well.
There is obviously nothing about our temperatures today or SLs or their delusional so called emergency etc that are unprecedented or unusual at all.
391
BTW Willis Eschenbach is still trying to find any climate emergency by checking all the data and his last update was 9 May 2024.
He also checked Antarctic data since 1950 and 100 years of global SLs and found nothing unusual. This supports Daniel Fitzhenry’s comments during Andrew Bolt’s interview.
https://wattsupwiththat.com/2021/04/25/wheres-the-emergency/
240
Now even NASA and NATURE have reported an increase in coastal land from 1985 to 2015. This is data from the Deltares Aqua Monitor tool.
IOW another 58,000 square KLMs of extra coastal land in just 30 years.
https://landsat.gsfc.nasa.gov/article/tracking-surface-water-changes-over-the-past-30-years/
“The Deltares Aqua Monitor was developed by Gennadii Donchyts, a remote sensing expert at Deltares. It is the first global-scale tool that shows, with a 30-meter resolution, where water has been transformed into land and vice-versa. The Aqua Monitor uses freely available satellite data, [“it analyses satellite imagery from multiple Landsat missions”], and Google Earth Engine, a platform for the planetary-scale scientific analysis of geospatial datasets that is now open to the general public. Gennadii Donchyts: “The Aqua Monitor shows that, around the world between 1985 and 2015, about 173,000 km2, an area about the size of Washington State, has been transformed into land. At the same time, an area of 115,000 km2 has been transformed into water. Both documented and undocumented changes due to man-made interventions, natural variability, and climate change have now been revealed.”
130
This is NOT about coastal land. It is a study of surface water being converted to land and land being converted to surface water. Not coastal land and sea water, although coastal areas are significant in the study due to artifical islands and changes in river flows.
Earth’s surface water change over the past 30 years
35
Studies like this are interesting. The problems begin when folk want to attribute negative aspects of nature to AGW. There is no evidence AGW is controlling anything on this planet, yet here we are in Australia still going down the renewable madness path because: saving the planet.
140
BTW that Dutch study found an increase of coastal land area of 33,700 sq kilometres and 20,135 sq klms of water. That’s an increase of land over water of 13,565 sq klms in 30 years.
Here’s the quote and the link.
“Earth’s surface gained 115,000 km2 of water and 173,000 km2 of land over the past 30 years, including 20,135 km2 of water and 33,700 km2 of land in coastal areas. Here, we analyse the gains and losses through the Deltares Aqua Monitor — an open tool that detects land and water changes around the globe”.
https://www.nature.com/articles/nclimate3111
80
I read the paper. You have not mentioned what subset of coastal land.
36
Good Climate News: Greenland’s Ice Loss Likely Won’t Disrupt Atlantic Current, Say Researchers
Best part:
90
“… we do need hope to fight the climate crisis.”
I hope the world’s climate elites soon grasp the lack of crisis, perhaps by bouncing their craniums off the wall of nonsense they have created.
270
And no one will ever read about it unless they click onto your website JNOVA. This climate change alarmisim madness is going to get alot worse before people wake, a week long blackout should do it, hopefully this summer, but they’ll blame coal of course.
330
Plus ça change, plus c’est la même chose.
120
It don’t mean a thing if it ain’t got that shwing.
https://www.youtube.com/watch?v=3y_d_aQg2xI&ab_channel=EllaFitzgerald-Topic
30
Alarmists, to further their cause,
Report Antarctic glacier thaws,
Blamed on man’s CO2,
Though evidently untrue,
They persist in clutching at straws.
290
I was assured by a Climate scientist recently that the Pine Is glacier is rapidly melting from below! She also claimed that the melting was not due to the underlying volcano.
The melting could only be explained by unusually warm water under cutting the glacier.
I asked her what caused the warm water. She said Climate Change!
160
I asked a very highly awarded and well known Environmental Scientist (under quite some pressure) and they told me that everyone knows it isn’t CO2, they push that because their objective is to bring down the Fossil Fuel Companies. Said person is a stated Communist.
270
I saw a climate scientist / marine biologist on the news. She looked about 26 years old and said,
“Albo you either stop coal and oil or you have a reef, you cant have both”.
That’s an activist, not a scientist.
220
Alarmists to further their cause,
Report Antarctic glacier thaws,
Blamed on man’s CO2,
Though evidently untrue,
They persist in clutching at straws.
90
Oops, please ignore comment at 10,
As I wrote the comment again,
Because 9 failed to go,
Or at least it ran slow,
From a glitch that occurs now and then.
170
🙂
60
Should save this for when it happens to me – though only if it happens at comment 10
24
👏👏👏👍
20
When polar ice is pushed slowly away from the pole, it moves towards the edge of the supporting land and eventually breaks off to become a floating ice berg.
When hanging out over the water the top of the ice is being stretched while the base is still under compression.
Eventually the elastic limit and tensile strength of the ice are exceeded and the ice rips off.
My next experiment will be to freeze a long thin stick of ice and see how much it will bend.
Maybe a straw would do as a mold.
100
?
10
When I was a kid I played with lighting fires in our backyard; just small ones and always under control.
Maybe it’s time to switch focus to ICE.
First test run will be to make a dozen ice cubes and stick them, maybe in pairs on top of each other, then put them back in the freezer.
Will this stack exhibit plasticity and bond together under gravity even while frozen.
Will it drop in height and spread laterally?
Can’t wait.
80
As with satellite temperature measurements, which are not that accurate according to NASA. https://science.nasa.gov/climate-change/faq/which-measurement-is-more-accurate-taking-earths-surface-temperature-from-the-ground-or-from-space/ sea level measurements from satellites may also be open to “computer modelling”. https://earth-planets-space.springeropen.com/articles/10.1186/s40623-023-01764-0. “Global ionospheric maps based on GNSS measurements are nowadays often used to correct satellite altimeter measurements when the instruments have only one frequency or measure over coasts and inland waters. If these corrections do not account for the free electron fraction over the altimeter satellites, this leads to systematic deviations in the range measurements and thus in the estimated sea level. This study compares and assesses different approaches to reduce GNSS-based corrections for the plasmaspheric electron content. It is shown that using a simple scaling with a constant factor of 0.881 gives the best results for the Jason-1 mission, while correcting with the commonly used model ratios leads to higher sea level trend artefacts and larger noise levels, especially for periods of lower solar activity. Using this approach, the sea level trend error for both Jason-1 and Sentinel-6A can be reduced to below 0.1 mm/year, with standard deviations of the differences from the dual-frequency altimeter corrections of 6.74 mm. A simple machine learning approach (boosted regression tree) is also investigated and shows promising results. However, due to the higher processing capacity requirements and the larger deviations from long-term trend, further improvements are recommended before such an approach can be used in routine processing of altimeter corrections.”
So, satellite measurements of global temperatures and sea levels are subject to computer modelling – by the usual suspects. Who’d a thunk it.
70
My point above was that ice can be plastically deformed when it is moving in the glacier.
When it is pushed over the supporting land, it is stretched at the surface and may exhibit some elasticity before it reaches the limit of its tensile strength and snaps.
Iceberg.
90
The thing that gets me about all of this is that these nincompoops don’t understand, or want to understand, that the planet has gone through so many changes – of form, geology, life, climate – over a few billion years, and looks nothing like it did in the beginning.
In fact, if the planet had not undergone all those changes, none of us, literally, would be here.
Why do these people think that “their” world is all there has ever been or should ever be? Because they have been indoctrinated to believe so, and they’ve never bothered to do any thinking for themselves or read (if they can after 12 years in the schools) any dissenting literature.
That there are “public servants” instructing teachers to terrify children into believing that the planet is going to – literally – burn up during their short lifetimes is a crime. Mainstream media support this.
The despots called politicians are doing their best to make food production impossible and basic shelter from the elements too expensive for ordinary people to afford, and seemingly under orders from the WEF, UN etc. The individuals instructing and directing those organisations are the ones …
230
I’ve never met one person who doesn’t understand this. Can you point me to one of these elusive people?
27
I’ve never met Al Gore or António Guterres either. But one said the poles would melt by 2014 and the other claimed oceans would boil. So, there’s 2 people who don’t understand the earth’s natural life cycles right there.
180
Are you saying that making those comments means that they think the planet has never changed? Riiiight……..
16
They didn’t give it a second thought, its not on their agenda.
31
All those in a panic about the slightest change in sea level, temperature and weather are a good start to your search.
90
Thank goodness.
70
I was worried someone might tell him to look in the mirror.
60
Ken Stewart looked at Aussie SLR for thousands of years and he links to many studies.
He called his article “the world’s biggest thermometer” for obvious reasons as he explains at the link.
https://kenskingdom.wordpress.com/2021/08/23/the-worlds-biggest-thermometer/
70
Everyone knows the sea level was higher and lower. The thing they convince themselves of is, that was when the earth was unsuitable for human civilisation, and so humans can only survive as the climate is now. Then the ones who are a bit smarter say, that with the big population we have today the effects of a changing climate will cause too much disruption, and all animals and plants will die or not be able to adapt as the change is too quick; or, that the changes before were natural, this is man made, so therefore dangerous.
All are infantile beliefs, but strangely, go all the way to the top, of every organisation in the western hemisphere. Despite all our advancements, humans have little understanding of the natural world we live in, environmentalists having the least understanding of them all.
101
65 years ago, when I was a boy, I visited Hallet’s Cove in SA quite often. A few years ago, I saw some photos of the cove. The sea was just where I remembered it.
60
There’s possibly lots of these type of papers floating around in science publications. That is, papers and research which clearly throw doubt into the whole climate change doom scenario. But reading the paper’s abstract you would never know. Easy to glance at their summary and move on. Its only Jo ( or her helper ) that has put the slant on it to make it more noteworthy –“2,000 kilometers of East Antarctic glaciers don’t look much different after 85 years and 1.6 trillion tons of carbon dioxide”. Old Mads ( paper’s author) doesn’t want to ruffle any feathers or upset possible grant givers. It’s the sort of article that once you might have picked up in mainstream media. May have even made it to that ABC science program hosted by Robyn Williams or perhaps the TV show Catalyst. No way now, there’s a narrative to keep. This is the blurb from the ABC radio science show ” from the physics of cricket to prime ministerial biorhythms”. Wow, there’s some real important science there, cant wait to listen next time.
90
Is that pompous Robyn Williams still around sucking up the public funded life?
80
yes
24
I don’t recall any theory or hypothesis that would predict a change to the look of East Antarctic glaciers.
Using KK’s description above, a very thick ice layer made slightly less thick by warmer air, would still be very thick and would flow over the land and into the ocean with now visible change from the air. This paper is interesting but doesn’t mean very much in the context you are pushing.
38
There has been an increase in mass balance across Eastern Antartica, caused by the accumulation of more snow, supposedly because of rising temps.
https://www.nature.com/articles/s43247-024-01355-1#Abs1
21
https://www.antarctica.gov.au/news/2023/cool-change-for-west-antarctica/
60
Sadly, you really can’t fight Faith with facts.
Faith coupled with Learned Helplessness is going to need dynamite to fix it.
70
We’ll just have to try harder to make the Antarctic fit the predictions.
50
Amazing that more big cities are reclaiming land from the sea to improve the life and safety of their citizens.
Here’s a NASA link to show the change and expansion of the Shanghai coastal area over the decades.
I’ve read before that this coastal extension has been operational for over 50 years. Shanghai’s population is over 24 million.
https://earthobservatory.nasa.gov/images/145968/the-expansion-of-shanghai
50
When the Climate Disaster happens, they’re all gonna die!
(When I was a boy, I objected to the term “reclaimed”, because it implies that the land has already been claimed, and is now being claimed again. I still object, on the same reclaimed grounds.)
40
Here’s the 8 C higher Eemian temperature link from the Co2 Coalition scientists site and their quote. Obviously much colder today during the late Holocene.
And yet we have ignorant donkeys who want to try and return us to the LIA.
https://co2coalition.org/facts/the-last-interglacial-was-8c-14f-warmer-than-today/
“Recent research by the Niels Bohr Institute (Dahl-Jensen 2013) was the first to target ice accumulated in Greenland during the previous interglacial period, known as the Eemian. The results revealed that the Eemian interglacial warm period, between 130,000 and 115,000 years ago, was much warmer than previously thought. In fact, it was, 8°C (14.4°F) warmer than today. The implications are enormous. Even though the temperatures during the Eemian were 2.5°C (4.5°F) higher than even the most aggressive IPCC predictions, the Greenland ice sheet lost only a quarter of its mass. While 25% is significant, it is far less than the predictions of total ice elimination in response to far less warming. Also, polar bears evolved about 150,000 years ago and survived the Eemian warm period even though there was seldom any polar ice”.
The polar bears survived. Greenland didn’t melt.
Source(s): Dahl-Jensen, Niels Bohr Inst, http://www.nbi.ku.dk/english/news/news13/greenland-ice-cores-reveal-warm-climate-of-the-past
80
Why isnt the msm talking about this ” prediction ” after the huge floods Australia has been having. Gillard ALP government employee TIMMY..” even if it rains again, it won’t be enough to fill our rivers and dams ” so our moronic state and federal governments believed every word and refused to build any kind dams because it ain’t raining again. Ah well, goodluck Australia for when drought returns. No water and no electricity, thanks to the ALP/GREENS/TEALS.
80
[…] From JoNova […]
00
Most if Antarctica has a permanent temperature inversuinnn which causes a negative greenhouse effect. The lack of Antarctica warming is a symptom of greenhouse warming.
22
Really?
Sounds interesting.
The BOM publishes atmospheric soundings (balloon flights) every day for Mawson, Davis and Casey and but I have not found any other sites. Do you know of any?
40