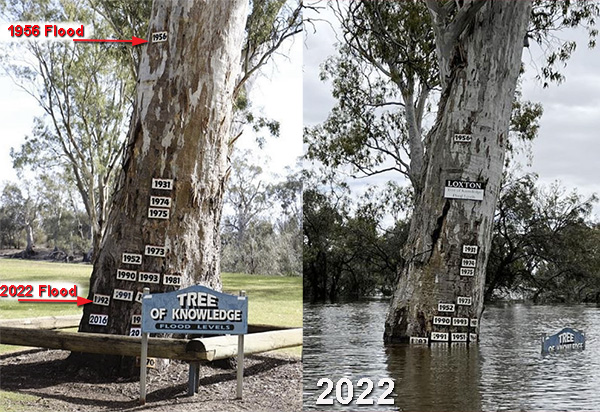
The Murray River was far higher in the 1970 floods and worse still in 1956 when CO2 was just 314ppm. Obviously, if all current floods are “caused by CO2”, we need more of it.*
A photo of flood markers on a tree in South Australia has sparked a debate on Facebook. The only things we know for sure — floods were worse when CO2 was perfect, and censorship of banal truths is the only way to stop the climate change rort unravelling.
Picture of tree at centre of furious flood debate
News.com.au
A picture of a tree in regional South Australia has sparked a wild climate change debate.As floodwaters from the River Murray crept up the Loxton’s Tree of Knowledge, one local thought it was a good time to take a picture to put things into perspective.
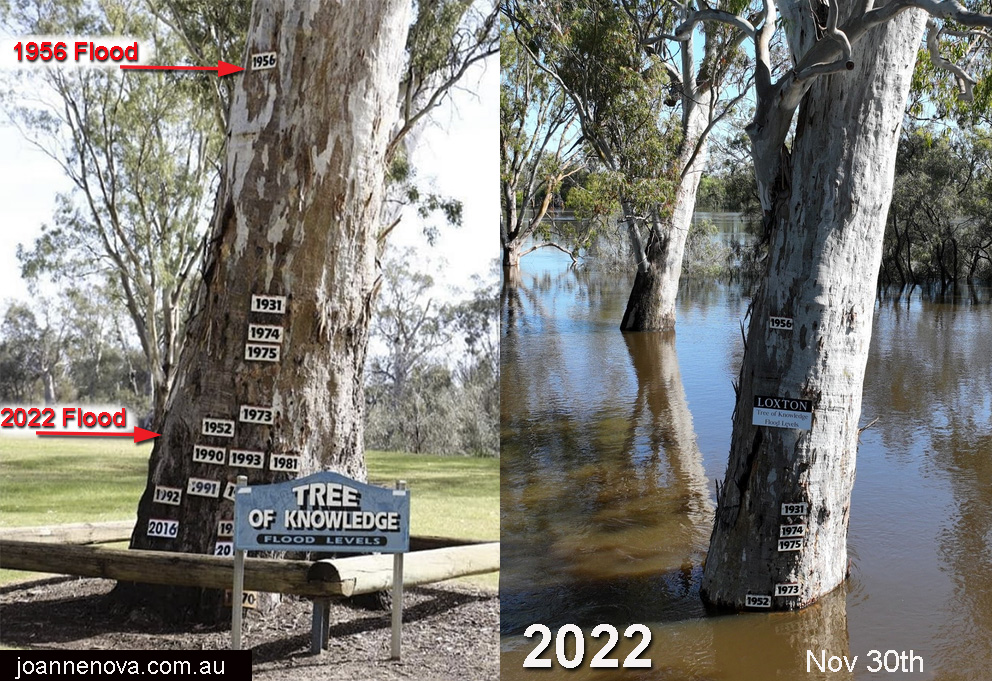
The updated flood markings of The Tree of Knowledge, SA, Nov 30th, 2022. Click to enlarge
UPDATED: Dec 2, 2022. Previous photo Nov 28th. See future updates on flood levels (weekly) here. Thanks to Craig Thomas.
The depth of the scientific response:
“Using one tree as evidence to suit your agenda shows what level of intelligence we are dealing with,” one said.
“There are many factors why areas have worse flooding. There is no denying though, with mass land clearing as one factor, flooding will only get worse under extreme climate events such as La Nina,” he continued.
History speaks on the Land of Droughts and Flooding Rains:
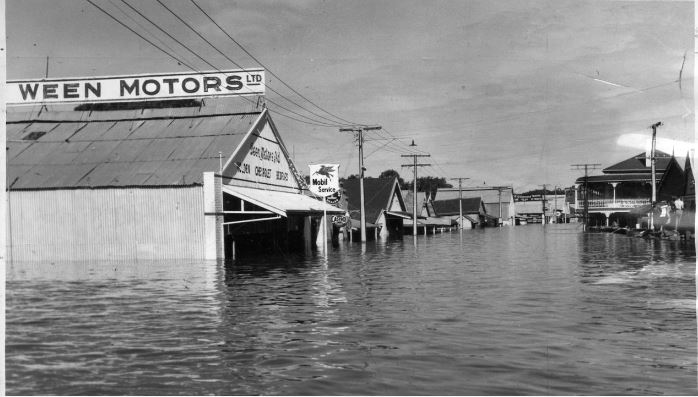
Main street of Mannum under 2.4m to 3m of water in 1956.
As many as 4,000 homes may be inundated as flood waters rise, and our thoughts are with them. Because the Murray River drains a basin that covers one million square kilometers, the waters are flowing from up to two thousand kilometers away. The peak may not happen til later near Christmas.
Murray–Darling Basin Authority. Loxton and Mannum are in South Australia | Click to enlarge
*Using Tim Flannery reasoning.
h/t Richard C NZ and David


Although it may be true to say that there are many factors that can exaggerate local flooding in a huge basin such as the Murray-Darling, there is no doubt that records from many areas, including Lismore and others, demonstrate that the current flooding is not unique or a record anywhere in the basin.
710
Like the climate emergency fairy tales when bushfires are burning.
Friends on a family property in Western New South Wales held by them since 1800s have told me about a bushfire, I think early 1900s from memory, that raged across the State for months and their ancestors were forced to move Sheep to a clay pan area for safety.
341
When DPI research in western Qld began modelling pasture production from climatic records it showed that the early 1890’s must have been bumper seasons. The likes of which we haven’t seen since.
Just coincidently it seems that the last big fire around here was in the early 1890’s. The mail runs of that time each went about 60 miles north and south. The fire started north of the first, came down the creek and went past the second and miles wide.
60
According to the climate alarmists one example of worse events in the past is not indicative of the present being less dangerous but one example now can be indicative of more danger to come. Hypocrites all and so imbued with the need to reinforce their faith in man made climate change that history, no matter how compelling and accurate, must be wrong. I do hope there was push back against the “expert”. Maybe it is his level of intelligence that is questionable. It is certain that his level of intelligence has infected many advisors to government which in turn is causing the widespread hurt and pain of energy bills among other policies to “Stop Climate Change”. Idiots all.
280
For most people who do inhabit a vacuum of real life experience, assessing situations like the current flooding is a duh- dumdum moment for them. Tell them it’s all about climate-change and they have a hysterical episode and any attempt to introduce reality into their brain dead minds. I refer to most people who live in our cities and vote green or labor. As a rule
671
I got myself into trouble at a social occasion by correcting city folk discussing the 2019-2020 NSW bushfires and including them repeating propaganda blaming the Federal Government for not doing more to help. I politely pointed out that the Federal Government has no rural fire service or even emergency service and that primary responsibility for dealing with natural disasters is State Government’s responsibility, State budget expenditure for State Emergency Service, in NSW State Rural Fire Service and others including the RFS Air Wing aircraft fleet.
Unfortunately most of them were certain that I was wrong and a couple of them became quite unfriendly after that conversation.
One supporter was able to also explain that Premiers and Cabinet are the people in control of natural disaster operations, and that when a Premier or Prime Minister is away the Deputy becomes acting Premier or PM. There were a couple of missing Premiers in 2019 and PM also on leave.
You are of course right Glen
411
Like the muppets trying to dismiss one tree as not being a true marker, how many do you need then.
310
One question there – did the buildings also grow to raise their flood level markers? (/s)
180
And these muppets are stupid enough to ignore that water tends to be self levelling.
Eg. Another tree 100m away would indicate roughly the same flood height.
180
There is a pole not a tree outside Charters Towers that shows flooding going way back. Look it up and the mind will boggle at how high past floods have been.
50
According to a chart I can’t find just now but is part of official records there was a flood in the Hawkesbury in about the 1860s that was three metres higher at Windsor than the next highest flood on the record.
One must wonder how much higher modern floods would have been had the Warragamba Dam not been in place.
10
Possibly 1867?
https://www.researchgate.net/figure/Floods-recorded-at-Windsor-NSW_tbl1_287513475
10
My memory of the 1956 flood was a visit to Murray Bridge where my father had worked in the war (munitions factory) and seeing the water not quite up to the hotel there. The building my father was in had only about a foot of the roof top showing.
And as for records
https://farm5.static.flickr.com/4077/5437453363_cd206dec7e_z.jpg
80
Floods are affecting a lot more people today because there are so many more people that our wonderful country is able to support.
But our planning engineers are either inept or over-ruled.
370
Jo, the flood gauge at Gundagai on theMurrumbidgee shows that the five highest floods in Gundagai, were prior to 1900, with the second highest still the greatest peacetime civil disaster in this country with 79 people drowning in 1852, with the highest being the following year 1853.
Yes, on that data, higher floods occur with lower levels of CO2 in the atmosphere
500
Nothing happened before 1909. The BOM say so by omission and they have all the data inherited from the States. Which will remain secret.
520
As BoM management replied to the Abbott Coalition Government Minister responsible for BoM who asked them for a response to the letter and information he received from Dr Jennifer Marohasy, after a LINO majority stopped PM Abbott’s proposal for an independent audit, due diligence be conducted at the BoM in 2014, no denial but response was “errors and omissions” and they would in future be rectified.
232
So Tdef,how do you compare era with and without dams, irrigation and other water management? by the way it is not an issue for the BoM.
440
It might help a bit if you allow historical data to be published, at the time of discussion.
Better still, how about allowing all, unadjusted, data into the public arena?
510
Fact is, that, unless designed specifically as a flood mitigation dam, and empty at the time..
… dams have very little effect on flood peaks down river.
There are no flood mitigation dams in the Gundagai region.
Irrigation is rarely used in times of flood.. 😉
“it is not an issue for the BoM.”
The issue with BoM is that suppresses this type of information..
… and that IS a major issue.
190
Hume Dam has a flood mitigation role B Nice but only when it’s empty and yes it’s on the Murray river though and not the Murrumbidgee .
20
A flood of this size, Hume reservoir would fill within a day and have basically zero effect on any downstream flooding.
Maybe in much smaller floods it might ease things somewhat.
00
Dams can have disaterous impacts. Witness the Brisbane floods where bad operation of the dams exacerbated the amount of water, and flooding, that came down the river.
Here, incompetent dam operators, under the sway of green fake ideology, would not let water go and held it. Then realised the dam may be damaged or fail, so let it go anyway. Pity if you have a property (like I do) in the flood area….
50
1956 was six years after the gates had been raised on the Hume to increase capacity. That didn’t count for much. Flood mitigation is a minor role for the Hume, its primary purpose is irrigation storage. Even if it were a flood dam, the Murrumbidgee, Campaspe, Ovens, Goulburn, Loddon, Darling and anabranch would overcome it in a flood year anyway. Floods are gonna flood. Build higher levees or move to higher ground.
00
Overcome the downstream outflows that is
00
A fair question but it’s not impossible to model.
10
It’s all about the runoff coefficient. Dry land rates in dry vs partly vs fully saturated conditions range from 1 to 5%. Ie depending on that your flood can be 5 times with the same rain.
30
Gee Aye it was an issue for BOM , even the Sky news meteorologist predicted that it would be very wet on the east coast but BOM held off declaring the last La Niña .
20
There used to be, and no doubt still are marks on power poles in Maitland showing the level of the 1955 flood.
Had the Glenbawn dam been completed and empty before that flood the water level at Maitland would have been one inch lower.
For reasons I don’t know the Burrendong Dam seems to be managed differently to others, holding back at times far more than its nominal capacity. Lately in the order of 140 plus %.
In from memory 1990 the daily report on the radio was at 117% and the morning news told of record flooding at Bathurst. The dam went past 160% of capacity. The flood came into the main street in Dubbo, but had the dam not been doing its thing would have been two metres higher. I saw but didn’t verify that the 160% represented six metres above spillway level.
Back to Maitland. In 1955 Lorn did not flood. Now, with all the “flood mitigation” works, Lorn is the first place evacuated.
20
…You mean like that required to deploy wind turbines?
350
If Liddell coal fired Power Station, Hunter Valley NSW, was replaced with wind turbines (excluding “firming” back up equipment areas required, based on Capital Hill NSW wind turbine installation of 67 wind turbines there with Nameplate Capacity of 140MW, on 15,000 acres of land (6,000 hectares), Capacity Factor even using AEMO best 35 per cent rating on average performance, consider how much land would be required to produce 2,000MW Nameplate Capacity of Liddell.
240
I figure it will take 2000 three MW turbines costing about six billion plus transmission. They will need 14 SA batteries costing 1.4 billion per hour of no wind for backup. Batteries last 12 years and turbines 20 so replacing a coal plant with a life of 60 years will cost about 200_250 billion. A new HELE at 4 billion is just so much cheaper.
50
Then the every average of 20 years removal and replacement with more expensive new turbines.
00
I’m wondering if “he” was saying we have more clearing now so flooding will be worse. If so, it perhaps shows the magnitude of the 1956 flood, in comparison to the current flood, given 1956 wasn’t exacerbated by today’s level of clearing.
10
What you have is a classic case of Climate Change causing a drought in the middle of a flood, lowering the peak water level. We’ll be rooned.
340
September 19 2019: The Victorian Government has ruled out new dams, saying CLIMATE CHANGE MEANS NOT ENOUGH WATER WOULD FLOW INTO THEM TO MAKE THEM WORTHWHILE.
What sort of clown world am I living in where this is allowed to slide unopposed and unquestioned, even by the so called ‘opposition’ party, when most of Victorias dams are sitting at 100% capacity or thereabouts only a few years later?
How can so many people be sucked in by this doomsday cult which is always wrong and which is dramatically reducing our standard of living with billions spent to not solve a non problem?
411
It’s obvious that any ALP policy or action or propaganda gets the nod from the LNP in the hope that being a shadow Labor acolyte the people may just vote for the LNP because they are more polite or dress conservatively. Not an LNP leader of any substance in sight. not an LNP with an original policy or thought in sight! The new “ deadbeats “
230
http://ozewex.org/no-point-in-new-dams-says-victorian-government/
Headline confirmed!
80
“mass land clearing”.
He/she/they obviously don’t get out out of Richmond much.
Out here in real Australia, the greening over the last few decades has been astounding.
“Extreme climate events such as La Nina”.
Otherwise known as normal variations in weather patterns.
340
Yes here in Queensland a huge amount of previously improved pasture grazing is going back to scrub, much thicker than it was ever allowed to be in aboriginal times, as it is too expensive to maintain it & grazing returns just don’t make it a worthwhile activity.
30 years ago we used to train our eventers through his 10,000- acre paddock at full gallop. Today you would need a bulldozer clearing a path for you, or the brambles would cut you to pieces.
171
“much thicker than it was ever allowed to be in aboriginal times,”
Prime target for extreme bushfires during the next “low rainfall period”..
… and it will, of course be blamed on …… you know what ! 😉
170
“with mass land clearing as one factor,”
Remember that a lot of the early clearing was based on “The Knowledge of the Time” and was a legal requirement of the “Government Enthusiasm of the time”.
Same as vegetation management of the current time is based on “Government Enthusiasm of the time” driven by what is passed off as “Knowledge of the Time” while ignoring the history of current thickening, and that much of the current clearing being management of that thickening.
40
“Improved Pasture,” I think the last time I heard this term was playing the game “Squatter,” about 30 years ago!
00
It seems the old data presented on the “tree of knowledge” still stands. From 1931 to today.
That data does not seem to have been homogenised or altered by our authorities and scientists.
Why is the bureaucracy so slow?
They could easily fix it.
Just adjust the flood levels on the “tree of knowledge” by using the flood level data from a (similar) tree, standing on a hill nearby (or 150 klm away).
They do that with every other climate data record and source, so It shouldn’t be a problem for them to solve this anomally.
240
I hear the buzz of a chainsaw revving.
191
Watch this ‘tree of knowledge’ get the same treatment as the other one.
150
Hopefully someone with a laser level can transcribe the level of the ’56 floods onto every other tree in the area plus plenty of other places, just for posterity.
120
The “narrative” is PURELY about POWER.
The transfer and acquisition of it by irremediably evil individuals.
At the core is utter MALICE, nothing less.
All statements to the contrary are willful complicity or terminal cretinism.
If you get my drift.
The Road to Hell; its pavement specification, and all that.
120
Could we please not put Tim Flannery in the same sentence as the word reasoning, more appropriate would be treasoning.
250
About to get some reasonable Flannery here in Brisbane this afternoon.
120
The advice earlier from the Climate Council founder was less rainfall because of climate change, dams will never fill again.
He also predicted that the Sydney Opera House would be underwater by 2000.
The tipping point goal post and the sales and marketing hyperbole and puffery for climate based hoax is professional rubbish.
241
Remember the science genius Professor Tim Flannery whose basic degree was in English from Latrobe University when it was just paddocks. He rationalized that the drought was so bad the plants were so thirsty the runoff would be less so the dams would not fill. At least that’s the short version.
On Landline
“PROFESSOR TIM FLANNERY: We’re already seeing the initial impacts and they include a decline in the winter rainfall zone across southern Australia, which is clearly an impact of climate change, but also a decrease in run-off. Although we’re getting say a 20 per cent decrease in rainfall in some areas of Australia, that’s translating to a 60 per cent decrease in the run-off into the dams and rivers. That’s because the soil is warmer because of global warming and the plants are under more stress and therefore using more moisture. So even the rain that falls isn’t actually going to fill our dams and our river systems, and that’s a real worry for the people in the bush. If that trend continues then I think we’re going to have serious problems, particularly for irrigation.”
You don’t need facts when you are a TOP SCIENTIST, but you can frown and lower your voice and act serious. But America has Al Gore, so our Top Scientist hardly compares with a college footballer from Harvard.
310
However to be fair, when only two Australian tenured scientists in twenty years Prof Ian Plimer and Prof Peter Ridd have spoken out, what can you expect? The 500 meteorologists of the BOM and those thousands of hard working scientists of the CSIRO are all fully in agreement on man made CO2 driven tipping point rapid sea rise acidifying oceans Armageddon planet on fire. Apparently.
390
Isn’t that that their salaries agree?
170
Actually, lets not forget Murry Salby spoke out and was abandoned at the airport in Paris, with tickets cancelled, while the Uni tried him in absentia.
And then there was Bob Carter who was cancelled in minutae for nothing — they blocked even his emeritus email and uninvited him to every event including school speeches.
They only have to make an example of a few professors for all the others to know what they are “allowed” to say.
30
Thanks TdeF – I am a geological and environmental scientist and have worked in both fields for over 50 years, and I am not in agreement on man made CO2 driven tipping point. But who would listen to me anyway as I am not a “CLiimate Scientist” something that did not exist for the first 25 years of my working life. And PS – I dont work for the government and only deal with them where I have to to assist my clients.
110
The key propagandist was a PM with a chemistry degree.
00
@1648 (Kilo) / EST, LOTS of “Flanneries” falling in a rolling band across South-East Queensland.
Just your basic, SEQ Summer afternoon affair.
90
Flood gauges are an interesting phenomenon. They are only of of real use if nothing else changes. Say, for example, you lived on the east side of the Marybynong river in Melbourne and for years the flood gauge showed a height of 2metres, all good information. Then say a racecourse on the west side of the river decided to build a huge levee bank to save the racecourse from inundation. Where does the water go. Well at a guess I would think that the good old flood gauge on the east bank would start recording record flood heights, unprecedented for that area, so new records are set. The flood gauge in the racecourse reads zero at exactly the same time the gauge across the river is breaking records. Dont tell anybody, its all due to climate change.
120
Hi. Was just in the region for an extended stay. Loxton is not at peak yet (by the way please date your photo as that is important) nor is Renmark which is upstream. 1956 won’t be exceeded but it is likely to come within a metre. Fortunately ’56 is everywhere in the region in the form of old levees and information as to where to put temporary ones. Thank goodness for local knowledge.
719
So Gee Aye the BoM are paid to document the floods and inform us. Have you asked them to date and report on the photo, or is it only unpaid volunteers who have the obligation?
Where is the BOM press release on this?
On facebook people are tracking “the latest shots” of the tree and so I just picked one representative of the highest reports I could find.
511
The level of water on the tree will change every hour. The photo is meaningless.
010
It does appear to be somewhat premature for Loxton. The link which R.B. provided has a link to estimated travel times (https://cdn.environment.sa.gov.au/environment/images/River-Murray-Estimated-Travel-Times.pdf), which seems to indicate that the current water at Wentworth should arrive at Loxton in 10 days or so. Daily updates of tree pictures would be quite handy, if possible.
30
The tree is all but inaccessible now, at least to anyone without very specific equipment and a penchant for sewerage.
05
But the markers from many years can still be seen easily with the eye.
And trying to make up weird excuses that people didn’t know where to put the markers in past floods…
… seriously.. desperation .. much ! !!
50
It’s not premature to show this photo as long as there are media stories telling us the current floods are unprecedented and caused by coal plants.
If they restrained themselves from promoting witchcraft until after the floods peaked we would restrain ourselves from pointing out how stupid they are.
20
The stoby pole at Swan Reach will still be accessible. We will not know if the 1973 level was exceeded unless it gets to 1974 level, with 1931 and 1917 to be reached before 1956.
https://www.google.com/search?client=ms-android-optus-au&sxsrf=ALiCzsahZjvbBaA0HYOBiGJOlslyjW4cjw:1669750238094&q=flood+levels+swan+reach&tbm=isch&sa=X&ved=2ahUKEwink7iukNT7AhU07XMBHWCaDyAQ0pQJegQIChAB&biw=320&bih=530&dpr=3.38#imgrc=X03VXLz8uCCPzM
00
I can’t reply to Jo’s reply at 16.1.1.1.1, so replying to myself.
It’s certainly not premature for the various places upstream where the Murray is at or near its peak, but it’s still early days at Loxton.
Comparing peaks is sort of fair, but no two floods are the same so most comparisons are only indicative.
There is a lot of overblown rhetoric about the Lachlan floods at Forbes and downstream setting new records (due to local factors) and multiple floods on coastal rivers (uncommon, but not unknown), but all the Loxton tree picture really shows at this stage is that the Murray hasn’t peaked there yet.
As M.R. pointed out, current indications are that the peak will be comparable to the 1970s, at which stage it will be a fair comparison.
The picture is interesting, and daily updates until after the peak would be very informative, especially for those who haven’t seen the progress of an inland flood.
00
Mr. Aye: And it changed every hour, presumably, in all the years noted on the tree, right? Wonder how those folks figured out where to put the sign, eh? Anything that says you’re wrong must be rendered meaningless. Please forgive us for finding meaning in it.
80
Since those signs are remade regularly, I’m guessing you mean when the first signs were placed.
The answer is that they guessed. They might have used a high water mark which of course could be too low if the water receded quickly and the actual high mark was not noticeable, or too high if a wave pushed sediment laden water up the tree or it seeped up (which happens).
08
But not of the difference of past floods as shown by the tree.. A couple of cm at best
Strike number “lost count” from GA. !
50
It’s more likely that the signs were based on levels at other reference points, and put on the tree as a single convenient location for the tourists.
The reference would be river level gauges where these were available, or pegs placed at high points, with the water marks on tree trunks or debris lodged in branches if nothing else was available. The silt “high tide” marks take a while to form, so are more likely to be underestimates. The post-War references would almost certainly be the river gauge(s)
20
Is possible though a lot of effort to get the heights right or close to right, on the tree.
13
Your answer is, they guessed. And you also make a guess. And I say that you are guessing about global warming, the whole thing is a guess- you have merely read and believe. Prove me wrong.
30
touche!
21
It most likely won’t peak for another couple of weeks yet.
The pictures as the water rises provide a useful progress report.
Timestamps would make that more useful.
10
indeed.
12
Wrong, you can see on the MDB chart linked here … although the level is trending up, is it not changing more than about 10cm per day and certainly not fast enough for the exact hour to matter. That’s at “Lock 4” which is fairly close to Loxton. Long term average (from 2007 to today) at that station is 11.0m but current is 15.0m so it’s up by 4m above average.
https://riverdata.mdba.gov.au/lock-4-downstream
There’s a map of the recording stations here.
https://riverdata.mdba.gov.au/map
Judging by eye, from the size of that tree they would need another maybe 2.5m to 3m above where they are now in order to hit the 1956 marker. The data at Euston Weir (downstream) goes right back to the 1970’s and long term average at that site is 44.2m but currently they are 51.8m and falling after just barely peaking at 52.0m (7.8m higher than long term average). Unless more rain comes, seems unlikely that will deliver sufficient to flood the tree. If you check the Euston Weir chart, it’s been above the long term average and slowly rising since May this year. The flow peaked 25 Nov and is not dropping at that location.
20
The latest prediction is a peak flow of 175 Gl per day with a low probability of 220 Gl. https://www.environment.sa.gov.au/topics/river-murray-floods/river-murray-flows
That is well below the 340 in 1956.
Then there is the estimated flow of twice that 250 years ago, which was a flood (which people using a scientific method claim) 2.11 m higher.
https://web.archive.org/web/20120206204122/http://www.unisa.edu.au/news/media2002/130902.htm
1956 wasn’t even a 1 in 1000 year event. Hopefully, the 1750 one was that rare. This will definitely be on of the larger ones that the tree shows comes around about every 20 years.
60
The whole area is very “old”, and was formed by much larger floods. !
30
Thanks for the link. There’s some very good info there.
40
“Thank goodness for local knowledge.”
Yep, the locals KNOW that flood like this have happened before.
ie… Nothing has “changed”
110
Correct, the Clausius-Clapeyron relationship still holds. Atmospheric water content increases by between 6 and 7% per 1 °C of temperature rise.
26
That means it can HOLD a few percent more before it changes to clouds.
Try again. 😉
40
Oh, and, there was a step up in rainfall in the early 1970s..
… but there is no trend in Australian rainfall since then that could possibly be related to atmospheric CO2.
Another hit and miss….. strike ‘n’ as n → ∞
60
The air still needs to cool before rain drops form. What it cools to when interacting with a cold front varies more than a degree, and on average should also be more than a degree warmer (since most of the warming is of minimum temperatures at higher latitudes).
There hasn’t been a 1% increase in global rainfall in 100 years let alone 6 to 7%.
1% more rainfall is centimeters higher flood. For a v shaped valley, the cross area increases with square of height while flow rate in shallow slopes is also dependent on river height. Very roughly, 1% more rain should be 0.2-0.3% higher flood height.
Referring to an equation verified in laboratory experiments sounds good but it’s just blather in this context.
40
Simon >”Atmospheric water content increases by between 6 and 7% per 1 °C of temperature rise”
In theory. Problem is what happens with little or no temperature rise:
From: Homogenized Time Series of the Atmospheric Water Vapor Content Obtained from the GNSS Reprocessed Data
Figure 7: Time series of the monthly IWV anomaly for three GPS sites [1998-2010]
https://www.researchgate.net/profile/T-Ning/publication/291955833/figure/fig1/AS:389119822843925@1469784804434/Time-series-of-the-monthly-IWV-anomaly-for-three-GPS-sites-a-HOFN-152-BULLET-E_Q640.jpg
Flat WV time series from 1998 to 2010 at those sites.
10
Thanks for the update. It’s always good to have info from somebody on-site. As a matter of interest, did you fly or drive? If you drove, how do things look further east? If you flew, could you see much from the air?
The BoM NSW river height map (http://www.bom.gov.au/nsw/flood/) shows that the Lachlan peak is around Hillston, the Murrumbidgee peak has reached Hay and the first Murray peak has reached Wentworth.
The Darling peak has only reached Tilpa, but still extends back to Brewarrina, so there is a lot of water coming down.
Just eyeballing it, the Murrumbidgee will probably raise the river levels in the Murray, the Lachlan will extend the duration, and the Darling will give a second peak in the lower Murray when that water arrives.
It looks like it will be wet down there for some time.
30
The whole region needs a good “wetting” from time to time. !
Maybe not quite this amount, though ! 😉
30
To paraphrase M. Dundee.
That’s not an environmental flow.
That’s an environmental flow.
50
I didn’t get a good view coming into and out of Mildura from the south. Chatted to people who have had to pick their way around different parts of NSW using multiple detours.
The river will be up in SA for quite a long time but hopefully not too far up. The 1975 level is a year bandied about, though only time will tell how that matches the particular tree in the photo
23
Thanks. I would have thought Mildura was bloody wet as well.
A friend was working in Griffith a few weeks back and said it was good and wet there.
How about the rest of the trip? I quite understand if you don’t want to give out too much info regarding which area you live in.
20
The riverside water play park in Mildura is very literally a water play park.
11
Yeah, that’s one of the reasons country towns usually have their parks, playgrounds and sports ovals along the river or creek.
The other reason is you can whack a pump in the river and use a travelling irrigator to water them.
It used to work well for the council-run caravan parks as well, back before the proliferation of demountable cabins and permanent caravans.
00
https://www.abc.net.au/reslib/201112/r869660_8448062.jpg
There is still some of the old bridge on the Mildura side of the Murray. It’s lower than the new one but it will give you some idea of what 1956 was like.
10
Using a fact as evidence?!! Insolence.
What would Greta say?
201
If it had been three different trees they could have applied homogenization adjustments and 2022 floods would have be uuuuge.
110
Tel
By the map I have it looks like Loxton to Birdsville is about 950 km. As that is within the allowable 1200 km fot homogenising one of those trees could have been at Birdsville – for a precise result. (/s)
40
“Using one tree as evidence to suit your agenda shows what level of intelligence we are dealing with,””
Yamal ! ?
160
Best to have all the flood levels on the on the one tree I would have thought.
Then again I would have thought that a properly mounted secure post would be best as trees have a habit of growing, then dying and then falling over.
30
I wonder what he says about Michael Mann’s level of intelligence given the hockey stick partly based on select tree rings and not a broad base of trees.
20
The Murray Darling basin is a complicated system. Huge and not exactly straightforward in terms of water flows etc. I heard it described very well as an analogy. The MDB is like draining a drug of water in the corner of a carpeted room and then maybe at sometime the opposite corner might get moist. Most people think it is like a piped system where you put water in at one end and it drains out the other. Nup. That probably only applies in a succession of wet years, when all the inter river soil profiles are relatively full. That Loxton water level is probably more influenced by what is happening locally or in previous years. It’s why the concept of buying back water by governments doesn’t work. But one thing we know, major floods and droughts are nothing new in this country. There is no such thing as an unprecedented climate or disaster event in Australia.
180
We have had a succession of wet years.
40
The climate council have just released a good report. Covers all the issues related to climate, weather and Australia in 2022
131
The climate council are hardly unbiased.
Their whole existence depends on them being chronically wrong about everything !
You really should learn what reliable scientific sources are..
The climate council is diametrically the opposite of reliable science…
All they produce is nonsense suppository driven propaganda… that is their job !!
The last three years of above average rainfall have been because of recurring La Nina ..
absolutely nothing to do with “climate change by CO2”
150
I really doubt they are capable of that. Unless good = something that reaffirms my entrenched psoition.
90
They say we are dealing with ‘unnatural disasters’, which I strongly disagree with. CO2 doesn’t cause global warming, so its a massive fail by the climate council.
120
When the PDO is negative its a natural flood disaster.
https://chaac.meteo.plus/en/climate/pdon.png
20
The latest release of ARR makes it very clear that the climate of the east coast is very strongly driven by El Nino and La Nina events.
They even split the “rainfall recurrence” up into two parts based on this fact.
60
Pretty much the first statement, is one totally unsupported by science.
“Climate change, driven by the burning of coal, oil and gas, was a major factor in the Great Deluge.”
Utter and complete non-science nonsense. !
Everything else is bound to be just as bad.
Its the “Climate Council” after all.. propaganda lies in their very name.
60
Peter >”The climate council have just released a good report”
Peter Ridd on that:
Chicken Little Propaganda Dressed As Science Permeates New Climate Report
https://climatechangedispatch.com/chicken-little-propaganda-dressed-as-science-permeates-new-climate-report/
“Greening” so passé now ?
60
“Using one tree as evidence to suit your agenda shows what level of intelligence we are dealing with,” one said.
Obviously this utter dimwit has not realised that a tree in the flood plain with accurate records is all you need to gauge the variation between various floods. And the variation is, as Jo points out, less so these days vs the past. Instead of ad hominem attacks do they understand what is shown here?
And on a related point since they mention intelligence, his or her intelligence is severely lacking as they have no doubt just relied on a diet of falsehoods, over-estimating models, and outright fraud from their friends in the alarmist movement, rather than try as I and most here have, to understand the issue and look at the data rather than accept at face value the lies of the green movement.
352
Ad Homs, person attack, well done you
128
He had reasoning. You don’t.
Learn the difference between ad hom reasoning and an insult.
320
Really? Quote for me the bit in the guide where that is defined!
014
So, PF, you have no counter to the factual arguments presented by PoB…
Why not just say so, and stop whinging !
80
Only a very dim person would think that a very old tree, backed up by several other nearby markers, was NOT a pretty good indicator of past flood levels.
Don’t be that person , PF !
141
Also.. Interesting that “a whinge” is all the counter you were able to offer ! 😉
Must mean that you agree with PoB’s assessment..
I agree with it as well !
90
He didn’t call him a dimwit for once having accidently put on his shirt inside out, so his claims are stupid. He called him a dimwit because the claims were stupid.
It is pretty simple to spot an ad hom rather than harsh judgement.
120
Prophet of Boom
“just relied on a diet of falsehoods, over-estimating models, and outright fraud from their friends in the alarmist movement, ”
What I referred to in #8.1.2 as “passed off as Knowledge of the Time”
20
And climate change reduces global cyclone energy!
https://www.climatedepot.com/2022/11/27/2022-global-tropical-cyclone-activity-likely-to-finish-lowest-in-the-satellite-record/
70
The map, above, reminds me of my childhood in the late 1950s and early 1960s: I was taught about Australia four times before I was twelve, it was so important to Britain.
It was partly because I went from the local infants to junior, then another junior school, then secondary and each time, it was more detailed, but a map of the Murray-Darling Basin was always present.
Happy days!
100
The map, above, reminds me of my childhood in the late 1950s and early 1960s: I was taught about Australia four times before I was twelve, it was so important to Britain.
It was partly because I went from the local infants to junior, then another junior school, then secondary and each time, it was more detailed, but a map of the Murray-Darling Basin was always present.
Happy days!
40
The climate is flexible! It can be all things for all people
40
The climate is flexible! It can be all things for all people
50
Genius agitprop.
‘Climate ‘Change’
So vague it means anything.
Hard to fight evil people that have no respect for intellectual integrity.
Truly amazing how they were able to turn ‘science’ into an anti-reason political weapon.
Hard to know where this goes.
90
And the rain that falls, may well have been evaporated from an ocean many thousands of kilometres away.
The BOM radars only tell us about the rain within range of the radars. The rain band that hit SE Queensland today was from clouds that had formed over the “dead heart” /central desert, not a good spot to pick up a million tonnes of water. Somewhere in the Indian ocean seems like a more reasonable source. The winds are not linear; lots of updrafts and down drafts. (Ask any pilot about those)..
LOTS of evidence of huge changes in precipitation and ground-flow of water in the geological record, GLOBALLY. And, just for giggles, toss in “continental drift” and wild solar fluctuations.
You need more than a couple of Stevenson screens and a glance out of the window to keep track of all the variables and “Three-score and ten” doesn’t exactly provide for long-term, consistent observations, especially if some bozo keeps moving the instruments and / or radically changing the environment around them.
80
I have seen the same thing with flood markers along rivers such as the Rhein and the Danube where some from centuries ago are higher by a long way.
And in response to the ‘science’ d******, ENSO is not a climate event it is a weather event which strangely in the world of settled science nobody is able to predict or explain why it happens. As for one tree, well it was fine for the crook Mann to use to create his ‘hookey stick’ but then isn’t it always like that with climate fascists.
60
Willis E takes a look at another “settled science”
“Sea Ice Mysteries”
https://wattsupwiththat.com/2022/11/27/sea-ice-mysteries/
30
The flood in 2007 in Worcestershire and Gloucestershire was not up to the level back in the 1600s. The various flood levels are marked in the gate down to the River Severn below Worcester Cathedral.
The awful flood in Cockermouth in Cumbria in November 2009 was still below an earlier mark recorded on a shop doorway.
40
I was reading the Australian version of the British Spectator about the failure of the British Writers Association to get behind J.K. Rowling and others who have received death threats. But they refused as they do not intervene in private disputes. Which is nonsense. Other authors are outraged as they pay their fees and the organization’s charter is to protect free speech and authors. But few could openly support Rowling and those who did were vilified, attacked, threatened. And others said they would like to support her but could not afford to lose their contracts or their agents.
It has come to this, silence in the face of oppression by the extreme left. It is so reminiscent of pre war Germany
Climate Change, BLM, Trans, gender, pronouns and all the rest of the extreme left platform. And people are silent. Especially the scientists who know man made CO2 is nonsense, by far the most soluble gas in the atmosphere.
230
According to the United Nations “climate change” is so broadly defined that it can mean everything and anything.
Everything mentioned is 100% normal in the natural order of things.
And how bizarre to include both droughts and floods!
Talk about having an each way bet!
120
The mayor of a hick-town just north of Wellington claimed recent mud-slides and POT-HOLES (!) were the devastating result of man-made you-know-what. The storm which brought heavy rain to that hilly, earthquake-prone suburb had, only a few days before, dumped snow all over your ski areas and provided Mt Hotham (Coldham?) with its record-breaking -7C temp for Nov. Join the dots? Nah, claim AGW and shout for govt handouts… bollocks.
30
BOM have reported an “Angry Summer” where Australia was the hottest ever recorded because of large areas of Australia that were well above average but had one (or one just outside in a not so hot region) station with such poor record keeping that there is no way of knowing what the average for the base period was without making up data. One tree on the river bank where all the water funnels through is a he’ll of a lot more reliable. Maybe BOM can homogenize the markers.
The Conversation (the only approved conservations)
Just propaganda put out in a La Nina year of lots of rain which that tree shows, with zero doubt, is not unusual and not unprecedented.
“We found the influence of climate change on El Niño and La Niña events, in the form of ocean surface temperature changes in the eastern Pacific, will be detectable by 2030. This is four decades earlier than previously thought.”
And they don’t actually make the claim that this evidence of it but those with child like minds will see the news reports as confirming it as if experimental evidence.
90
““We found the influence of climate change on El Niño and La Niña events, in the form of ocean surface temperature changes in the eastern Pacific, will be detectable by 2030.”
ROFLMAO.
We can already detect the “changes in climate type” due to El Nino and La Nina.
They have been known for quite a long time.
That are actually built into “Australian Rainfall and Run-off”
Who makes that sort of comment !!
50
‘Climate Change’ has no observable effect except alleged tiny slow warming of the atmosphere, which stopped a decade ago.
Now by what mechanism does that affect ocean surface temperature oscillations like La Nina/El Nino? I have read a NASA press release that the oceans ‘stole the warming’. How does that work if the atmosphere does not heat in the first place?
Then the amazingly silly idea that air heats the water? Try boiling water with a hair dryer.
The world oceans are 3.2Km deep on average, so 320x heavier than the air and water is 4x the specific heat capacity of dry air, so 1400x the total heat storage of the atmosphere which dramatically cools even overnight, it is the water which controls air temperature and water evaporation which controls atmospheric humidity at 1% to 4% and ocean water which causes all the rain. And we measure water content with barometric pressure. More steam, lower pressure.
Ocean temperatures and ocean currents control all climate? The Gulf Stream, the Humboldt Current and the major gyres. These vary and there are vertical oscillations. The mass movement of heat in the major source of atmospheric heat on our planet apart from the sun. Ocean water evaporation what keeps people from frying on the equator and the price is humidity of 4%.
But still the pagan druid Conversation worships the atmosphere as the source of all weather and water. That is pre science ignorance.
Without oceans there would just be sand storms. Predicted Man Made Global Warming, aerial warming, stopped and was very minor. We are in a world period of rapid cooling.
If people really think +1.5C in 150 years was devastating Climate Change, we have a drop of –
5-2C coming over the next 20 years, back to about 1940 and WWII.130
“we have a drop of -5C coming.”
I hope very much that you are wrong.
A drop of that amount would devastate huge areas of farming in the NH. !
A bit of extra warming, on the other hand, would open huge areas up to agriculture and habitation.
It is COOLING that everyone should be very concerned about !
90
“Ace Forecaster Bastardi: “Something We Used to See In 1970s”, Warns Of “Spectacular Cold” ”
https://wattsupwiththat.com/2022/11/28/ace-forecaster-bastardi-something-we-used-to-see-in-1970s-warns-of-spectacular-cold/
50
Sorry, the figure predicted is -2C. And that is from a graph at 12:32 which uses only two regular cycles and fits the last 250 years like a hand in a glove. You can see the peak we have just passed, now the slide down the other side.
The scientific method of Prof Weiss with blind Fourier analysis is just spectacular. And confirms incidentally that CO2 has nothing to do with temperature. It’s all the 99.99% of solar energy stored in the oceans and small variations in solar intensity. Two and only two cycles explain 95%. And of course there are other small cycles but the fact that you explain accurate data with two and only two cycles which exactly match major known cycles is enough for me. Man made Global Warming is busted. (Besides we do not control CO2 anyway and CO2 is provably just under 3% man made )
60
Still, a drop of -2C would still be quite a big problem.
Takes us down to or below the temps of the LIA !
Arctic will be frozen solid again, sea life up there will become untenable. 🙁
Plants and livestock will suffer from the cold.
It would not be a pleasant time for many NH countries.
20
TdeF >”the figure predicted is -2C. And that is from a graph at 12:32″
Spectral analysis tells. CO2-centric climate scientists don’t like going there. The solar fluctuation prediction at 10:57 is common to solar physicists predictions too.
Paper here:
Multi-periodic climate dynamics: spectral analysis of long-term instrumental and proxy temperature records
Ludecke, Hempelmann, and Weiss (2012)
https://cp.copernicus.org/articles/9/447/2013/cp-9-447-2013.pdf
The 230 yr cycle secular trend (ST) with 65 yr cycle oscillation (MDV) in CRU data at 17:40 is essentially the same as that found by Singular Spectral Analysis (SSA) of HadCRUT4 (see Figure 1):
Application of the Singular Spectrum Analysis Technique to Study the Recent Hiatus on the Global Surface Temperature Record
Macias, Stips, and Garcia-Gorriz (2014)
https://europepmc.org/article/MED/25208060
Best part in the abstract:
Also contrary to CO2 forcing theory so will never be addressed by the “scientific community”.
10
” … ocean surface temperature changes in the eastern Pacific, will be detectable by 2030. This is four decades earlier than previously thought.”
Hmmm … more Modoki La Nina, a cool body of water in the central Pacific, flanked by warm SST in the east and west. Its only natural.
21
“Water, water everywhere, nor any drop to drink”.
Samuel Taylor Coleridge (1772-1834) The Rime of the Ancient Mariner (1798)
40
A geography quiz:
Where was the ship when there was nary a drop to drink?
20
Doldrums.
40
But in Oz
From a Ted Egan song about characters in the NT (IIRC)
“Sitting on the table
As the flood waters covered the land
Drinking rum and a deluge chaser
From a pannikin in each hand”
20
Using that epic poem as a metaphor (I can recommend it to everyone) the question is – shot the darn Albatross!
10
who shot the albatross I mean’t…
10
Now UNESCO has started AGAIN to drum up support for declaring the GBR to be endangered.
They tried this just before the FED election but decided to back off until they’d have a more clueless govt to deal with I suppose.
Yet we all know that the GBR is the best it has been for about 40 years, yet these leftie con merchants want us to waste even more billions $ on their lefty lunacy ASAP? Unbelievable but TRUE.
https://www.smh.com.au/environment/conservation/great-barrier-reef-should-be-added-to-heritage-danger-list-un-report-20221129-p5c1zl.html
40
‘Australia does “not provide any clear pathway to avoid significant negative impact” from climate change.’
As 98% of all CO2 is from overseas, how do we fix the Great Barrier Reef problems caused by Climate Change caused by Global Warming caused by Carbon Dioxide from overseas?
If we stopped producing any CO2 at all, 100% of CO2 would be from overseas. That would be far worse.
So we should produce 50% more CO2 and take 3% of the blame, relieving others of the worry of looking after a natural structure as big as Germany at 350,000km2.
80
TdeF the CSIRO also tells us that the SH is a NET co2 SINK and the NH is a NET co2 SOURCE.
I know the silly kiddies don’t like to be reminded of the Cape Grim link, but I also couldn’t care less about their silly fantasy world.
Here’s the CSIRO Cape Grim data , see under Seasonal Variation.
https://capegrim.csiro.au/
“Seasonal variation”
“Carbon dioxide concentrations show seasonal variations (annual cycles) that vary according to global location and altitude. Several processes contribute to carbon dioxide annual cycles: for example, uptake and release of carbon dioxide by terrestrial plants and the oceans, and the transport of carbon dioxide around the globe from source regions (the Northern Hemisphere is a net source of carbon dioxide, the Southern Hemisphere a net sink)”.
50
The fact is the Southern Hemisphere is cooler because there is so much ocean. Antarctica alone is 3.5Km high of solid ice, the size of two Australias. So of course CO2, which is in equilibrium, is more absorbed in teh Southern Hemisphere than in the North as it is in continuous and rapid equilibrium. CO2 is absorbed very quickly and all we have in the atmosphere is what escapes from the ocean when the surface is warm. This is all described in Henry’s Law but accelerated by rain and wind and waves and the huge surface area of rain drops and spray from crashing waves. If the surface was still the fish would drown, as they do in stagnant pools. No oxygen.
And you can see the CO2 graph is an almost perfect straight line, not an exponential. The bumps show the seasons, differing between North and South as in summer more CO2 comes out than average and in winter more is absorbed.
Human CO2 I have calculated is a tiny fraction of the CO2 which is exchanged in this continuous process. Plus the fact that the way equilibrium works is that if there is an imbalance, the force driving back towards balance increase. This is shown in a simple clock pendulum where the time to swing does not vary with amplitude as the forces driving back to the centre increase with amplitude.
Further with a known half life of CO2 in the air of 6 years, human CO2 is self limiting and while increasing steadily with human population, is diluted by the 50% increase in natural CO2.
All this CO2 stuff, the atmosphere controls the weather, oceans are irrelevant is nonsense. What is most amusing is that when the predictors of doom are completely wrong, they blame the oceans, La Nina and El Nino, the Indian Dipole. That is an amazing admission that ocean currents dominate the weather, as everyone knows. But they also determine CO2 levels. A warmer ocean surface means more CO2.
40
And the unproven assertion that CO2 warms the oceans lacks only one thing. How?
40
TdeF >”And the unproven assertion that CO2 warms the oceans lacks only one thing. How?”
Exactly. The root of the IPCC’s scientific fraud that I addressed in ‘Winning’ here:
1) The IPCC presents no physical evidence just speculation – “the expected mechanism” is “air-sea fluxes”.
2) The microphysics and thermodynamics of the AO interface precludes 1).
3) The energy-per-photon of downwelling IR-C radiation (DLR) is miniscule in comparison to solar IR-A/B (3 orders of magnitude less) and incapable of heating water.
4) The change in the CO2 component of DLR as a compared to total DLR changes is insignificant; WV changes completely overwhelm CO2 changes, see Wang & Liang (2009):
5) The sun heats the ocean in the tropics – not GHGs.
And see next comment re 2)
40
In 2) I neglected to add that the IPCC’s own Surface Energy Budget shows no net IR air-to-sea fluxes, the net is an outgoing flux (OLR). That’s this:
An update on Earth’s energy balance in light of the latest global observations – Stephens et al (2012)
http://lecuyer.aos.wisc.edu/publications/2012_EBupdate_stephens_ngeo1580.pdf
Figure 1: Surface energy balance
https://www.researchgate.net/figure/Surface-energy-balanceObserved-and-climate-model-deduced-energy-fluxes-all-in-Wm-2-in_fig2_260208782
They overlook the only other downward flux SW down – the solar radiative flux.
30
Both the Cape Grim and Mauna Loa (Hawaii) observatory CO2 levels have always looked very “sus” to me. Apart from the inter year seasonal variation the full history ( 1960-> for Mauna Loa ) trend line looks unnatural. Too smooth. Also, as was shown during COVID lockdowns unaffected by reduced human activity. To claim the rise in CO2 is solely the result of human activity is just junk science. But, who am I to contest, there’s literally hundreds ( maybe thousands?) of people who earned PhD’s based on this incomplete science.
30
We used to laugh at fake PhDs. Now they are extremely common. As someone said to me, he did not do a PhD. Didn’t have the time or the money. You used to have to be better than all A grades to even be invited. Now it’s an elective.
I went to a PhD ceremony for Victoria’s RMIT. They graduated a few thousand people that night, including 200 PhDs. One thesis was on the distribution of trucks for Halal meat delivery.
There are now PhDs in subjects which have just been invented, like Climate Change.
51
Ross >”Both the Cape Grim and Mauna Loa (Hawaii) observatory CO2 levels have always looked very “sus” to me”
Mauna Loa will be even more “sus” soon:
World’s largest active volcano, Hawaii’s Mauna Loa, starts to erupt for first time in 38 years
https://www.stuff.co.nz/world/us-canada/300751396/worlds-largest-active-volcano-hawaiis-mauna-loa-starts-to-erupt-for-first-time-in-38-years
30
Interesting that the BOM MDB rainfall converted to an anomaly graph shows 2010 to be the wettest year and rainfall from 1900 ( or 1897) to 1949 was below the average line. So why is there never any mention of this terrible 1900 to 1949 very LONG MDB dry period by the BOM?
http://www.bom.gov.au/cgi-bin/climate/change/timeseries.cgi?graph=rranom&area=mdb&season=0112&ave_yr=8
Also here’s the Australian rainfall for the same period. And certainly much better rainfall since 1970 for most of Australia.
But the millennium drought doesn’t seem as easy to see from the full Aussie rainfall graph.
http://www.bom.gov.au/cgi-bin/climate/change/timeseries.cgi?graph=rranom&area=aus&season=0112&ave_yr=8
30
Thanks Neville for drawing attention to the 1920’s – 1930’s – 1940’s dry period.
It is also fact – ignored by many that in years starting 1947 the large numbers of surplus ex RAAF C-54’s – DC-3’s and large number surplus ex RAAF pilots – helped start a large program of cloud seeding over various areas of SE Oz which lasted over a few decades.
So the NSW record rain year of 1950 and wet years MDB post late 1940’s for a few decades could have been made wetter by cloud seeding.
30
The cloud seeding was apparently inconclusive.
There was some indication that rainfall increased in the immediate area of the cloud seeding, but decreased downwind – more or less a zero sum game.
30
https://wattsupwiththat.com/2022/11/26/an-inconvenient-tree-is-climate-change-driving-worse-floods/
20
Now remind me why we don’t have any dams to hold this water?
60
The money that should have been spent on dams was thrown away on solar and wind subsidy farms and desal plants – because the government was told it was never going to rain again.
50
Easy answer – “Said Flannery”
20
The only dams that would make any sense would be in the headwaters on the western slopes of the divide.
Any other dam would take up huge areas of valuable farmland…
… have a really bad surface area to volume relationship, (ie very shallow for storage held)
… and would turn salty from evaporation rather quickly.
20
Here’s Northern Australian rainfall graph from the BOM and a very dry period from 1922 to 1970 and much higher rainfall after 1970.
http://www.bom.gov.au/cgi-bin/climate/change/timeseries.cgi?graph=rranom&area=naus&season=0112&ave_yr=8
Here’s Southern Australia from the BOM and still that dry period from 1922 to 1949 and also dry period from 1900 to about 1915.
http://www.bom.gov.au/cgi-bin/climate/change/timeseries.cgi?graph=rranom&area=saus&season=0112&ave_yr=8
30
The appalling election result in Vic-dumb-istan proves that most people, including politicians, are stupid and the country is leaderless and clueless.
Present company excepted, we have very few or no people to work with in order to inject reason into the minds of the majority who seem to believe in the anthropogenic global warming fraud.
70
The stupidity I witnessed in my 10 minutes at the local polling place has certainly firmed my stance that compulsory voting is bad for the country. I just a few minutes:
– can I use ticks instead of numbers?
– do I have to fill out both forms?
– do I vote above and below the line?
– oh this is all too complicated!
all from people well old enough to know better and have voted many times before
60
That is appalling, you’d expect it from millennials, but you say they are not that young.
20
I also detected a bit of general unwillingness to vote amongst some of my younger family and acquaintances. I know of a young couple who were attending a wedding in SA on 26/11/22, but didn’t bother to postal or pre-poll. They said they were happy to provide an excuse for not voting if challenged. A couple of others in the younger bracket who had actually forgotten to vote. Initially, I saw this as a BAD thing, but maybe it indicates a general lack of interest in politics and government. We actually need an exit poll asking people – ” ….if voting wasn’t compulsory, would you have voted today ?” . I think the result might be quite surprising.
30
Here’s a very recent interview of Canadian scientist Dr Tom Harris from FOX news.
He started as a true BELIEVER but now he wants to challenge the con merchants and liars. This is a very short interview and I like his punchy style.
https://www.youtube.com/watch?v=Qdg4uQW8Dlg
40
Here’s a 2021 talk in Ireland from Dr John Christy and he has many graphs and data to support his claims.
This is about 48 minutes but is well worth your time if you want to really understand the Science.
https://www.youtube.com/watch?v=D2Cd4MLUoN0
30
Just before the Last Glacial Maximum there was a monstrous flood which inundated Lake Mungo, never seen before or since.
‘Here we identify evidence at Lake Mungo for a previously unrecognised short-lived, very high lake filling phase at 24 ka, just prior to the Last Glacial Maximum. Mega-lake Mungo was up to 5 m deeper than preceding or subsequent lake full events and represented a lake volume increase of almost 250%.’ (Fitzsimmons et al 2015)
31
Murray River flooding was made much worse by Hume Dam being kept so high in a year they knew would be wet , when they were finally forced to release massive amounts of water it just added to an already swollen system . The strange thing about Hume Dam is it has a dual purpose of flood mitigation and water storage but flood mitigation is only used when it’s near empty .
40
Same with Wivenhoe Dam.. a dam expected to carry out two totally contradictory functions..
Of course there will occasionally be “problems” …. d’oh !!
40
And I thought we were all supposed to want greater “environmental flows” that periodically flooded the riparian zone. So how did they propose to get environmental flows that flood the riparian zone with out floods? Did they not think that one through?
50
I grew up along the Murray River. It seems every town has some concrete/brick structures with water-stain marks left by the flood of ’56…. (and having not seen that tree before, the relative heights of the markers look about right).
40
If you convert the water-stains on concrete and trees etc to Milli-flans it all makes sense to me after finding out about this measurement and its application. There are a thousand Milli-flans in a Flannery of rain i have heard elsewhere..
30
Here is a video that includes historical footage of the 1956 flood
https://www.youtube.com/watch?v=TOHbCj38eWo
00
Part 2 of the video
youtube.com/watch?v=E3bP9gRt7sY
00
[…] Climate change apparently makes floods less severe […]
00
Your 2022 marker on the tree is wrong.
Will you apologise for posting inaccurate information?
https://www.loxtonwaikerie.sa.gov.au/high-river-advice/loxton-tree-of-knowledge-updates
02
Thanks Craig, The photo I posted was accurate on the day I posted it. The post is dated. And I warned people the waters would continue to rise. Nothing about the latest update changes anything material, but I tweaked the photo anyway. Thanks for letting me know they did a newer photo.
Will you apologize for irrational demands? Should I have psychically been able to see the future rise two days before it happened? – Jo
30