If Climate Change was a real threat, the Bureau of Meteorology might even look at their own historic records.
When Jennifer Marohasy and Chris Gillham did just that, they found that as bad as the current situation is, it’s happened before:
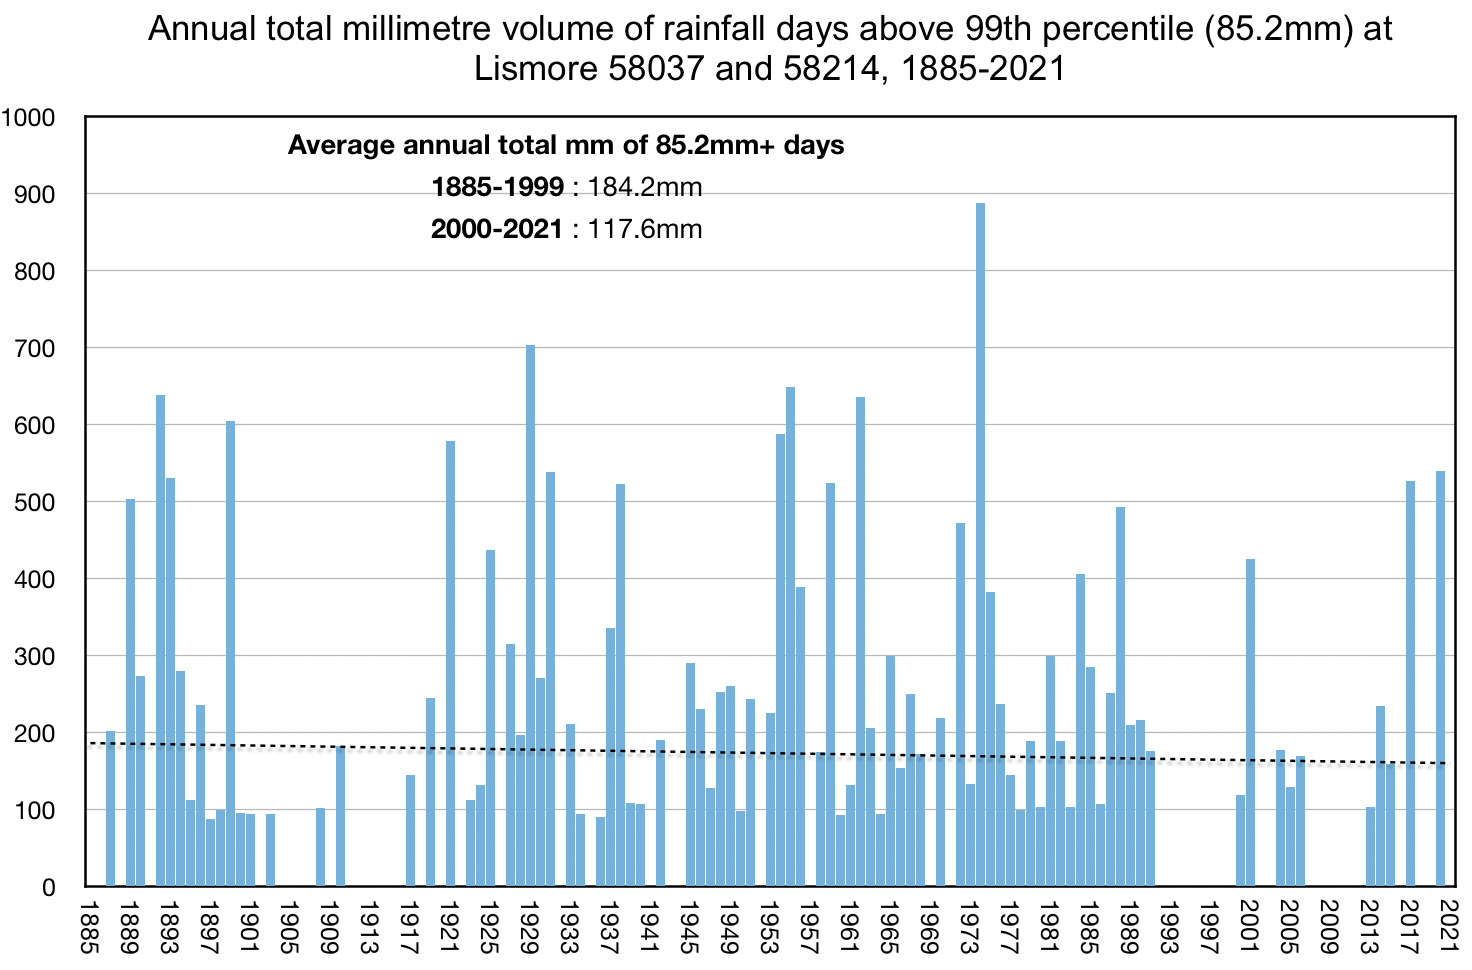
- The wettest day in Lismore was in February 1954.
- The wettest year for Lismore was 1893.
- There was no increase in the intensity or frequency of extreme wet days at Lismore, or the towns around it.
Now if the BOM looks at this with a supercomputer, they might find an effect from CO2. But if the BOM just used a calendar, like I did, they might find the latest floods started the week after Hunga Tonga volcanic dust rolled across Australia. Maybe that matters?
No one needed a supercomputer to read a rain gauge in 1885, and we have excellent long data. Imagine how handy that might be if the BoM wanted to understand, say, Australian flood cycles? There are 137 years of rainfall records in Lismore from 1885 to now, but the BOM said we set a new record for Lismore based on Lismore airport where records started as long ago as… 2002.
The Bureau of Meteorology is guilty of exploiting taxpayers, vandalizing Australian history, and spitting on decades of work by the earliest meteorologists in Australia. And they want us to think they care?
Here’s what big rain looks like in Lismore:
Like it happens all the time.
Australia has always had floods and rain bombs.
Well done to Chris Gillham for his help at WAClimateNet.


Thanks Jo, at least someone still has a brain not linked to the climate change mantra. One should also consider Lismore’s physical placement in relation to the Richmond River. That river has always been prone to flooding and has a very steep catchment area. Most towns and cities were built on rivers for the access to water supplies and Lismore is one of the most vulnerable ones. Why people continue to build in flood prone areas puzzles me. Then they and the politicians cry for government help every few years. Australians suffer from this world wide problem… “One thing we learn from history is that we never learn anything from history!”
400
In the UK the Met Office has recently run a citizen exercise to digitize rainfall records from the 19th century.
The figures were hand written and this made it difficult to computerise the process. There was a very fast job done by volunteers so the digitised records go back to the early 1800s.
And guess what, the records show that there were heavy rainfall events in the 19th century. No doubt heads will roll as this is against the official narrative, and it will be interesting to see whether the figures will be homogenised.
https://greatdriffieldradio.co.uk/news/uk/item/87245-uk-weather-victorian-era-rainfall-data-digitised-during-covid-pandemic-by-thousands-of-volunteers-breaks-records
20
There is a greenhouse gas effect, water vapour increases by roughly 7% more per 1°C of warming. Overlaying this are decadal weather patterns and long-run climate changes in rainfall distribution. Single site attribution is going to be difficult.
447
As usual Simon, you nail it
344
Yep, he nailed another post of nonsense, un-backed by anything resembling science.
A PF-emulating post.
370
Quite so, b.nice. More evidence that the leftist brain works in curious ways. Hard wired to stupid and ignorant messages that further their confirmation bias. Read all about it on the ABC.
92
” Single site attribution is going to be difficult.”
So when will the ABC, BBC, BOM start to be honest about that Simon and Peter, or don’t you care if they continually misrepresent the floods as “climate change” when there is no evidence at all that they are.
And it’s not OK if the mainstream media just finds some activist librarian of Nowehereville to interview and say “it’s climate change” — if the BOM and “experts” don’t admonish and correct the media for perpetrating a scientific lie.
50
Climate is not linear, its a highly complex system.
Do volcanic eruptions cause rain bombs? Did the 1893 eruption in South America impact Lismore?
61
‘One of the largest historical eruptions in southern Chile took place from Calbuco in 1893-1894. Violent eruptions ejected 30-cm bombs to distances of 8 km from the crater …’ (Smithsonian)
It was a fairly long lived eruption and smoke had a chance to reach Australia, depending on the season and what the jetstream was doing.
41
It’s not just Lismore in 1893, but the a similar area of the east coast to this last burst. 1893 Beaudesert received 1726mm, 85% above average 932mm, 674mm of it in February, the wettest to date in measured rainfall.
Next comes 1954, with 1457mm, again with 550mm in February. This year fits in well here, with 619mm, again in February. Interesting that each of these events were about 60 years apart. I wonder if that has any significance. We may know in 2075 or so.
70
‘ … about 60 years apart.’
The 60 year cycle is seen in ice cores and shallow sea cores, so it cannot be ignored.
50
If we travel further back another 60 years we see that 1829, 1830, 1831 and 1836 were all wet in South East Australia. So presumably La Nina and a negative PDO, coupled with a positive SAM, must have happened at that time.
Three consecutive La Nina are clear to see and a period of severe drought followed in the latter 1830s.
61
Yes “Peter Fitzroy ” Simon nailed his green colors to the mast again and loves his greenhouse gobble talking points ….The La Nina weather anomaly compounded by the Tonga Hunga volcanic dust and aerosol cloud passing over Australia had nothing to do with the precipitation dumps and floods that followed within a few days .It was just an extraordinary coincidence …A perceptual selection effect ! All that sulfate and water vapor pumped into the stratosphere by that huge Pacific undersea eruption must have magically disappeared somewhere ..I still remember the summer downpours in Victoria that followed the Mt. Pinatubo eruption
70
Yet post Roman cooling made Britain considerably wetter, as did the LIA.
Whilst the current warm period shows no significant trend.
240
Don’t confuse the poor little boy with facts like those. He will feel “unsafe”
240
“Whilst the current warm period shows no significant trend.”
We are not in a particularly warm period. !
In the 10,000 year Holocene, we are still nearer “cold” than “warm”, maybe just up around the small MWP peak, but probably a bit lower still.
Thank goodness its not still the LIA !
210
The last 7,000 years has seen oceans drop by between 6
to 4.2 metres in total.
That’s a very strong pointer to the idea that the polar caps are holding on to the rain and snow and storing more Ice.
Of that sea level Fall, 1.2 metres of it was in the last 2,000 years and in my lifetime there’s been no significant movement either way.
But back to the fantasy Disneyworld UNIPCCC. ……..
40
H2O is the only gas that can alter the rate of net radiative transfer in the atmosphere.
It is nothing to do with CO2.
Historical data shows no trend in severe rain events on the north coast of NSW.
Why is that so hard for you to grasp !
Your simplistic lack of understanding of basically everything, and your total lack of data to back up anything nonsense you sprout, makes you look like nothing but a religious zealot.
300
There isn’t a failure to grasp these facts, only a failure to ACCEPT them.
230
Well said.
100
Sorry, but when he comes to grasping things, he has his hands firmly stuck in his pockets.
100
And that’s why the system sorts itself out. Eventually, saturation occurs, clouds form and that starts a cooling process as sunlight is reflected back to space. Clouds are the big unknown in all climate models, and cloudiness or the lack thereof seems to be a far more important variable in determining global temperatures than the chemical composition of the atmosphere. Doubling CO2 might raise the temperature by 1 deg C, doubling Cloud cover would probably result in an Ice Age.
210
Hi Simon
You say “water vapour increases by roughly 7% more per 1°C of warming.” and ” Single site attribution is going to be difficult.”
But this is not just a single site. The same pattern of more rain and floods in the past and decreasing extreme rain and decreasing floods is seen at MANY sites in eastern Australia, especially SE Qld. This rain event was not unusual (see https://kenskingdom.wordpress.com/2022/03/03/how-unusual-is-all-this-rain-weve-had/) and Australia’s natural disasters are not getting worse (see https://kenskingdom.wordpress.com/2022/03/23/is-australia-getting-harder-to-live-in/).
90
I’m more worried about Brownian Motion inherent in every molecule in the atmosphere; the quantity of energy involved in beyond belief.
40
‘ … water vapour increases by roughly 7% more per 1°C of warming.’
It doesn’t amount to much, 95% of greenhouse gases are water vapour.
50
It seems that both the BoM and CSIRO are on the list of “marched through” organisations.
It works like this: infiltrate a hitherto respected organisation, gut it, wear it as a skin suit and use it to issue propaganda.
271
I think all government departments and institutions have well and truly been marched through by Rudi Dutschke’s “der lange Marsch durch die Institutionen”.
The Left won.
100
In Perth, it has been a hot summer but we’ve had many very mild ones in the lead up to this one. We also experienced very heavy rainfalls in mid 2021 which gave us well above average rainfall for winter. So, what do I hear a BOM spokesperson say today? She pointed out that we’ve had a very dry hot summer. “Could also be the hottest Autumn if this warm weather continues” she says.
Our fruit growers were complaining that without backpackers being allowed into WA, they couldn’t find workers to pick cherries. I know some champion cherry-pickers at our Bureau of Meteorology that surely could help.
30
Very confusing graph – I read it a single days above the 99th percentile, which is a thunderstorm (admittedly an big one).
What we saw in Lismore’s various catchments was 6 or more days of heavy rain, producing the 2 flood events. These are now called rain bombs.
I note that there is no mention of such an event (2 500 year in a month) – which makes that unprecedented.
My trust in BOM remains
335
And your denial/non-comprehension of data is also still there.
180
Not necessarily a thunderstorm but possible.
And if 1893 was the wettest year it must have had a lot of days when it rained.
160
“These are now called rain bombs.”
BoM’s method of attempting to scare the weak-minded and historically illiterate.
220
Now when I was a boy!!!!
WE used to call those things Cloud Bursts.
Take your pick.
140
Peter, see my reply to Simon above. I looked at 4 day rain totals in the upper Brisbane catchment. Nothing spectacular. Weather happens.
100
thanks Ken
12
Peter Fitzroy,
Rather than confusing, I’d say it’s weird: the annual total rainfall of just the really wet days. So a big spike in this graph might be due to big downpours 11 months apart wuth neither being a flood. OTOH, there’d be no spike at all for a long run of not quite 99th percentile wet days.
If I wanted to show how flood-prone weather has trended/not trended, I’d plot something like a rolling 30 day total rainfall throughout the record. To come up with a year-by-year summary you could just choose the maximum 30-day total from each year. Obviously I plucked 30 days out of the air. Maybe it should be 7, or 50.
40
Garbage PF, check my Beaudesert figures in my post 3131.
20
sorry, what has Beaudesert got to do with Lismore? Just randomly picking a couple of weather events from a random town means nothing
32
a topo map.
11
Peter Fitzroy : ” What we saw in Lismore’s catchments was 6 or more days of heavy rain producing the 2 flood events ”
” what has Beaudesert got to do with Lismore ? Just randomly picking a couple of weather events from a town means nothing ”
You mean a couple of weather events from a town like Lismore? If it is meaningless to choose one town in isolation you would be happy to discuss Beaudesert’s data Quaint exercise in doublethink there Peter
51
roflmao… Its the other side of the same watershed hills…
Be more aware before commenting .. please. !
30
Peter Fitzroy contradicted himself ….
10
Evidently the caveat in the fine print is of no importance to him and his fixation with Lismore’s precipitation and flood history : ” There are 137 years of rainfall records in Lismore from 1885 to now but the BoM said we set a new record for Lismore based on Lismore airport where records started as long as…..2002 ”
The staggering scale of the 1974 rainfall totals are still a record in the BoM Australian nationwide rainfall series since 1900 ….Australia’s worst bushfires followed in the summer months of 74-75 burning 117 million hectares of the continent. The equivalent landmass of France ,Spain and Portugal combined The climate crisis in the midst of the 1970’s global cooling hysteria must have been something to behold
30
I’d say that compared to a normal time you would call more than two flood events. There were two record breaking flood events, piled on top of a number of lesser floods.
In the last 60 years locally there were two storms which caused spectacular flooding, one called at more than six inches, the other at up to ten inches, which gave us three inches as it wound down.
Neither registered anywhere near those figures on an official gauge, but the floods they generated make those numbers feasible.
Intuition tells me I haven’t in that time seen much above half a dozen events where three inches registered in 24 hrs.
00
G’day Ted1,
I’ve only been out here for 30 years. The previous owners measured 10 inches from an overnight storm a couple of months before we arrived, there was one more a few years later, but my heaviest rain was three and three quarters inches in just under an hour. The latter ripped the guts out of the laneway to my front gate and it took several weeks of our and neighbours’ work to get the laneway back to normal use.
All of those storms were local, and missed the official gauge at Mudgee airport, about 25 kms away.
Another indicator of variability of rainfall: A neighbour about 2 kms to my west and I are separated by a low ridge. On several occasions we’ve compared numbers and he’s had an inch more than I’ve had from the “same” fall.
As far as I can tell, the “official” figures can only be considered to be better than nothing, and at least provide a consistency of location and recording.
Cheers
Dave B
40
It was a wonder nobody died in that flood. Lucky nobody was on the road just then.
An awful lot of sheep did die.
I drove to town next morning not knowing that the Stoney Creek bridge approach was undermined. It held up.
10
Peter Fitzroy’s ‘trust in BoM remains ” …15 years ago the BoM’s David Jones cast the Millennium Drought as our ‘new normal “
50
Australia’s Bureau of Meterology effectively erased all records from before 1910 and they are not part of the official ACORN record.
How convenient of them to delete a warmer and perhaps wetter period of Australia’s recorded weather record.
310
Memory holes in action. Good that we have the internet to catch the facts before the memory holes eat them up. Let’s hope that the internet remains that way.
[ Wee edit] LVA
120
Anyone listening to BoM’s nonsense would think that Lismore flooding was an unusual event..
… but !
https://lismore.nsw.gov.au/cp_galleries/recreation__comm/master/05bdac8abfe79b63955f2b2be3322a0c.jpg
https://static.ffx.io/images/$zoom_0.153%2C$multiply_1.6402%2C$ratio_1%2C$width_378%2C$x_27%2C$y_27/t_crop_custom/q_86%2Cf_auto/d5c82e7532648f890c65c223bfd4deb8714ea2c4 1974 !
1. Its built on a natural flood plain.
2. Lots of increased urban run-off effect.
Anyone versed in geomorphology, can see that the whole area was formed by much larger floods.
120
Lismore and Gympie have a lot in common, they should become sister cities.
Every time it rains heavily, they flood and have done so for over a hundred years or more.
90
My mother comes from Grafton in the same area and noted that flooding has always been a regular occurrence in the area.
141
Let’s see if this works:
The entire Northern Rivers District is in the much-eroded caldera of an ancient “super-volcano”.
This thing chucked a lot of big rocks a long way and the pyroclastic flows extended past Ipswich in Queensland. You can walk past the welded ash beds (Tuff) in White Rock Park, near “Spring Mountain”. Welded Tuff: Fine volcanic ejecta that was so hot when it was blown out in huge pyroclastic flows, that it fused to the previous deposits and became “interesting rock formations” covering tens of thousands of hectares.
The SAME rock was used in a large amount of civil construction in Brisbane’s early years.
Australia was once extremely geologically active, especially along the”east coast”; Glasshouse Mountains? Heavily-eroded volcanic “plugs.In the north there are the crater lakes on the Atherton Tableland and the impressive Undara lava tunnels. The planet is a seriously dynamic system; Get used to it.
20
As bad as the Liberal Party (pretend conservative party) is, climate lies are only going to get even worse when Green Labor is elected federally.
The latest polls (If true) show Green Labor 8 points ahead.
101
In all the charts discussed, there appears to be a trendline suggesting a reducing volume of rain? Still no suggestion of human-induced climate change but perhaps a changing climate just the same?
80
Exactly what was predicted by Tim Flannery
However, what is the vale of comparing a 20 year mean with the older 120 year mean. meaningless
016
What part did he get right, Peter?
160
GEEEZZZZ you’re a nasty bloke David. Peter’s hero Flannery reigned supreme during the Rudd, Gillard disasters and we’ll probably see him resurrected if the Labor/ Greens donkeys take over in May.
Talk about the blind leading the blind, what a mob of clueless fools to put the final nail into the Aussie energy coffin.
And ZERO difference by 2050 or 2100, but many more billions $ flushed straight down the drain.
131
David:
did you miss the one (2004) Tim Flannery predicted that ‘Perth will be the 21st century’s first ghost metropolis.
(2005) Tim Flannery predicted Sydney’s dams could be dry in as little as two years because global warming was drying up the rains, leaving the city “facing extreme difficulties with water”.
(2007: ‘Brisbane and Adelaide – home to a combined total of three million people – could run out of water by year’s end.’
(2008) about Adelaide running out of water by early 2009
By December 2008, Adelaide’s reservoirs were 75% full, Perth’s 40%, Sydney’s 63%, and Brisbane’s 46%. The following year, dams in Brisbane, Canberra and Sydney were filled to overflowing.
70
you missed the full quote, so here is the second sentence, „This problem may not occur for several hundred years, but by the time we see the first signs, it will be far too late to do anything about it.“ love cherry picking do you?
19
So it is basically an unfalsifiable doomsday prophecy? Exactly what we need from scientists yes?
60
Flannery’s expertise was Kangaroo droppings.
He just thought he could translate it across to climate BS !
40
Flannery, of “never fill dams” fame ! roflmao
You are talking rubbish, yet again..
There is no trend in heavy rainfall events on the north coast of NSW.
“There was no increase in the intensity or frequency of extreme wet days at Lismore, or the towns around it.”
110
“comparing a 20 year mean with the older 120 year mean”
Denial or deliberate ignorance of historical weather, is the hallmark of the AGW meme. !
100
‘comparing a 20 year mean with the older 120 year mean. meaningless.’
Strongly disagree, if we look at the 60 and 30 year cycles the picture becomes clearer.
‘We compared our historical rainfall data to previous El Niño/La Niña events and found a weakening in the relationship during 1920–1940 and 1835–1850. The breakdown was especially clear in data from the southern part of our study region. This is the first time the 19th-century breakdown has been seen in Australia using instrumental data.
‘Of course, the next question is why? Why does the impact of El Niño and La Niña on Australian rainfall change over time? What happened in the mid-1800s? It might be El Niño’s cranky uncle, the Interdecadal Pacific Oscillation, or perhaps strange behaviour in the atmosphere around Antarctica.
‘We’re still not sure.’ (Ashcroft and Karoly 2017)
31
el g – randomly picking 2 means using different selection criteria is not how science works. Of course,if you want to suggest that the east coast is drying then by all means (sorry for the pun) use this method.
24
Flannery’s linear perspective on climate change is flawed and to discover where we are heading, we have to look back, its a cyclic phenomenon.
50
there are cycles, and that is a given, and if there was no anthropogenic changes to the the composition of the atmosphere it would be both reasonable and logical to assume that yes – the past is a good predictor of the future. However, man is changing the climate, on a small scale with UHI and on a larger scale with GHG’s soot, etc etc.
What the models forecast is the increase in the amplitude for the cycles something which is seen now with the el nino’s not being as cold as previously.
05
“man is changing the climate”
Again with the unsupportable anti-science. !
Only GHG that can effect weather, is H2O ….. There is no evidence that CO2 has any effect whatsoever, (as you have repeatedly show)
Man has basically zero effect on the global climate.
El Ninos used to be a lot warmer only a 1000 years ago. We just happen to be coming out of the coldest period in 10,000 years..
A really stupid period to choose to compare things to.. But its all the AGW hoaxers have.
Choose a model that forecasts something, then another that forecasts something else.
So many models so many conflicting “predictions”
None of them correct except by pure chance.. !
30
” the el nino’s not being as cold as previously ” ? The 1876 -78 El Nino was as unusually warm as the 1998 El Nino You are making it up as you go along and the climate models are voodoo science
30
‘ … on a small scale with UHI …’
ENSO is a driver of world temperature.
https://www.drroyspencer.com/wp-content/uploads/UAH_LT_1979_thru_March_2022_v6.jpg
30
“ENSO is a driver of world temperature.”
And there is absolutely no scientific or physical way that humans can affect ENSO.
To quote Crowded House.. “Its only Natural !“
40
The BOM should now be called the “Bunch of Muppets”. What a complete waste of $1m a day.
70
Note above at the graph for heavy rainfall days and then ask yourselves how there were two recent very dry periods in 1990s and after 2000.
These periods are very obvious and again proves these higher co2 level periods are not connected to just high rainfall events.
IOW we can have these very recent decades that have multiple years of lower rainfall and higher rainfall events.
I think ENSO would be the reason and ongoing el nino or la nina events seem to be the best explanation.
BTW co2 levels in 1992 were about 356 ppm and in 2012 about 394 ppm. But the Hunga Tonga volcano event will certainly require more research as well.
80
There is no evidence, or scientifically rational way, in which tiny proportions of CO2 can be connected to weather events, or climate in general.
81
Notwithstanding I upthumbed you still I maintain your assertion is baseless there being more things in heaven and earth Horatio…
Were some nutjob able to demonstrate a carbon dioxide to weather nexus crawl out of the woodwork next week we’ll have nowhere to hide.
02
Any explanation they fabricate, has to be contrary to science and physics.
Yes, they would be a complete nutjob, and provable so.
30
I suppose we should also remind everyone that co2 levels in 1900 were about 296 ppm and about 304 ppm in 1920.
In that period there were more gaps in the Lismore higher rainfall events. But previously from about 1880s to late 1890s there were higher rainfall events when co2 levels were lower than 295 ppm.
Certainly nothing to show that co2 levels have made a difference at all.
121
So what is the right amount of rain for Australia?
Also, government edict should enforce equitable distribution.
(While we’re here, If I could also get the right Global Average Surface Temperature, I’d appreciate it. In F please, I’m American.)
End Anthropogenic Rain.
80
Just enough rain to keep filling our dams. If not enough then build more dams. Simples.
70
(While we’re here, If I could also get the right Global Average Surface Temperature, I’d appreciate it. In F please, I’m American.)
It’s not hard to covert C to F. Multiply degrees C by 1.8 then add 32 to get degrees F
04
Ian:
The Global Average Surface Temperature is 14.0, 14.5. 15.0. 15.2 all in Celsius and depending on who did the guessing.
Satellite measurements are supposedly more accurate but only measure about 80% of the surface. That’s better than the figure for 1855 – 1857, which is based on ONE thermometer for the whole of the southern hemisphere in what is now Indonesia (and for the next 5 years on 3 only as Sydney & Melbourne were added).
There is an alternative conversion method – Add 40 to the temperature reading, then multiply by 9 and divide by 5, then take off 40. For Fahrenheit to Celsius just reverse the calculation. It may sound silly but it works and is based on minus 40 being the same temperature in both scales.
30
Sorry, that should be for Honk R Smith.
20
Nope not buying it.
It makes sense where it is and it starts with Ian not Honk.
00
Dude (or not), seriously?
Don’t play in the street, you’ll get flattened by an oncoming joke.
Those unequipped to recognize sarcasm will get no quarter.
30
What is it with Progressives and humor?
The same culture that produced The Simpsons and Family Guy became insufferable pearl clutchers.
Overnight.
In 2016.
Trump.
He punched back and made them run to Mommy and cry.
31
As I usually can’t find a calculator, and can’t be bothered doing it in my head….
… I just type in “Convert temperature” into google. Its something they haven’t corrupted yet.
20
When are people going to understand?
DO NOT BUILD ON FLOOD PLAINS
Why is this so complicated to understand?
Even Aboriginals warned early settlers not to do this.
101
Back in the day when they had proper schools (not indoctrination centres) one of the topics taught was “geography”. That included the topic of flood plains which people used to know about.
A modern kid will never have heard of geography or flood plains but they will be able to cite by rote all 57 (or whatever) supposed genders…
150
”
A modern kid will never have heard of geography or flood plains but they will be able to cite by rote all 57 (or whatever) supposed genders…”
I suspect you’ve not had too much interaction with modern kids. They use the internet a lot admittedly primarily to play endless games with hordes of like minded friends but also to gather information
Take flood plains. Wikipedia says
A floodplain or flood plain or bottomlands[1] is an area of land adjacent to a river which stretches from the banks of its channel to the base of the enclosing valley walls, and which experiences flooding during periods of high discharge.[2] The soils usually consist of clays, silts, sands, and gravels deposited during floods.[3
As you can see the language used may require help but certainly broadens their vocabulary and often leads to further searches to find out what adjacent and silt and high discharge means.
07
A basic description, with little understanding.. Ok !
20
One problem with the Lismore rain record is the AP site went down on 1st March at around 3:00am. I remember it had recorded up to 330+mm at that point. It is still not operating as of 4th April.
http://www.bom.gov.au/jsp/ncc/cdio/weatherData/av?p_nccObsCode=136&p_display_type=dailyDataFile&p_startYear=2022&p_c=-677785815&p_stn_num=058214
50
The Big Green Hardware store sells a reasonable (Chinese-made) rain-gauge for about twelve dollars. It even includes support so the assembly can be attached to a suitable post.
Finished cost of a “new” BOM-approved rig? Going by any government “protect pricing”, fifty grand minimum.
Plus “spillage”.
Follow the (your) money.
20
The 7% increase in water vapour with 1 degree temp rise, is just potential. Explain the 2019 drought?
In the video she mentions extra flood height caused by chock points. Nah. It was way above any restraining levies.
As for the way of measuring by the 1% heaviest rain. It’s one way of illustrating. Does making it a longer period help? The Northern Rivers has been wet, wet, wet. I doubt we’ve had 14 sunny days this year? So the soils are saturated. But no one was losing any sleep about that, before the 2 day, then the later 1 night downpours. No warnings, everyone happily tucked themselves into bed those nights; if it’s wet, take an umbrella, and awoke to devastation. I totally slept through the last one. What rain? So it was those 3 very heavy nights that did the damage. Actually it might have been just 2 nights? For the big one it rained as predicted the night before, and up to lunchtime, but the rivers weren’t doing much. It stopped raining for the afternoon, so no problem, but then it really kicked in well after dark.
60
So why are Humans so wealthy and healthy today and why has our global population grown so rapidly since 1800?
In 1800 our pop reached 1 billion people, then 2 billion by 1927,then 3 billion by 1960. then 4 billion by 1974, then 5 billion by 1987, then 6 billion by 1999, then 7 billion by 2011 and today about 7.9 billion and soon 8 billion by 2023.
Yet the rate of global pop growth has DECLINED since about 1968, although a very young African pop ( about 19 years) has ensured a much more rapid growth in that continent since 1970.
But the Malthusian donkeys plus some of the kiddies etc all tell us we are living in the end times and are facing a Climate CRISIS or EXISTENTIAL THREAT etc.
AOC and Biden, UN, UK, EU, plus Aussie donkeys etc think we only have a few years left before we face the apocalypse and we’ll all be punished for our sins.
So how come we now have a global life expectancy of about 73 today and increasing wealth and YET we’re supposed to fall over the precipice in just a few years time? Any ideas, anyone?
https://en.wikipedia.org/wiki/Estimates_of_historical_world_population
50
“So how come we now have a global life expectancy of about 73 today and increasing wealth and YET we’re supposed to fall over the precipice in just a few years time? Any ideas, anyone?”
Clean water. Sanitary handling of food. Clean air. Refrigerators Efficient sewage disposal. Hospitals. Medicines for many diseases. Vaccination during childhood. Understanding how bacteria spoil food and make it dangerous. All that sort of stuff
31
I agree with all that Ian, so where does their EXISTENTIAL threat fit into their apocalyptic forecasts?
And Africa has increased their population nearly 4 fold since 1970 and yet they now are better off and their life exp has increased from 46 years then to about 63 yrs today.
And that 63 years is now higher than the global average was in 1970. And Africa had to suffer from the HIV/AIDs disaster over the last 40+ years as well.
The climate has been very beneficial for a very long time and deaths from extreme weather events have also dropped by 97% over the last 100 years.
30
Clean water. Sanitary handling of food. Clean air. Refrigerators Efficient sewage disposal. Hospitals.
Yep, all available because of the use of coal, oil and gas. !
40
And one that the BOM don’t have.
The main creek drainage for the area goes through our property and is joined by a smaller creek just to the south of the site of one grandfather’s homestead.
According to district rain gauges there was nothing outstanding about the rainfall for the area in May 1917.
However Grandfather arose one morning in that May to the sight of the main creek channel running uphill from water from that smaller creek. He headed for the next homestead south in time to swim the occupants off the roof of the house.
At a homestead on that smaller creek a kerosene tin bucket that was empty the night before had overflowed during the night. I found one and they’re about 14 inches high.
Hasn’t happened again as yet but residual sandbanks suggest there has been a lot of water around here in the past than in European experience. I am reminded of the paleo floods mentioned by Geoff Pickup from CSIRO Alice Springs.
60
Can anyone point me to where the BOM mentions eithor or both of “rain bomb” and “unprecedented”
13
well spotted
12
Point is I didn’t spot it. Maybe it was a duty forecaster talking on local radio?
14
When did an ECL become a rain bomb.
https://www.weatherzone.com.au/news/is-a-rain-bomb-really-a-thing-/535403
10
Thanks el g
13
Looks like PF spotted another “non-spotted”?
30
Just do a search for “BOM rain bomb”. Pages of it.
If its not from BoM, its certainly from the MSM !
40
No one up for the challenge. All I’ve found on these words is from politicians and journalists.
01
Some fun facts regarding floods in Australia.
In 1810 Governor Macquarie proclaimed 5 new towns on the high ground along the Nepean and Hawksbury rivers. However settlers on the flood plains refused to move. In 1817 he wrote to the Earl of Bathhurst, frustrated that settlers would not relocate their families and livestock one mile from the flood plain. He noted that farmers had “infatuated obstinacy in persisting to reside with their families, flocks, herds and grain on those spots subject to flood” And as a result “they have often had their prosperity swept away.”
In 1851 Bega floods killed 17 residents and it was estimated that the town site was covered by 9 meters of water and extensive damage was done to crops.
The town of Bega moved to its current location.
In 1852 Gundagai relocated after 89 people drowned from a population of 250. Originally it was located between 2 rivers.
In 1916, Clermont ( QLD) was relocated after 64 people drowned in an unexpected flood.
In 2012 Grantham did a land swap after 2011 floods , it is expected that 70-80% of residents will move to the new town.
20
“In 2012 Grantham did a land swap after 2011 floods , it is expected that 70-80% of residents will move to the new town.”
Not far enough?
https://www.smh.com.au/environment/weather/families-in-grantham-devastated-by-floods-20220304-p5a1yc.html
20
I notice that Tim Flannery (AKA Tom Foolery) has been mentioned. This intellectually challenged individual would not know the difference between climate and the dark side of the moon. His Australian of the Year Award was moved by Kevin (C)Rudd…enuff said.
30
And he may have been wrong about the demise of Australian megafauna, on my reading it looks like climate change killed them off and not humans.
20
Last gasp from the beeb.
https://www.bbc.com/news/science-environment-60984663
10