What do you say when the Big PR bell is rung? You know the litany: “2010 was the warmest since measuring began, and the previous decade was also the warmest decade on record.” (eg The AGE)
- Sure, and the world has been warming for 300 years, long before the industrial revolution. The trend hasn’t changed as our emissions rose. No one knows exactly why it started rising back then, but it wasn’t CO2.
- Sure and 150 years of “records” is not long. It was warmer 1000 years ago, 2000 years ago, 5000 years ago and 130,000 years ago. In fact its been warmer for most of the last 10,000 years than it is today, and it’s been warmer for most of the last 500 million years. Only people who think CO2 matters keep repeating that it’s warmed from 1850 to now without pointing out the bigger perspective.
- Sure, and the records have been set with thermometers like this one (next to concrete and exhaust vents — see below). There probably weren’t too many car parks or air conditioners in 1880 either. Not to mention the non-random adjustments, and that mystery about how 75% of thermometers are ignored.
Nothing about the “hottest year ever” is meaningful or significant on a big scale. Nor is anything even certain about it on the 150 year scale. After all, most of the original raw data records are missing aren’t they?
Here are some graphs:
This is just a cycling warming on a long term trend that started before CO2 became an issue:

The big temperature picture. Graph and insight from Dr Syun Akasofu (2009 International Conference on Climate Change, New York, March 2009)
Discussed in the post: Global warming: a classic case of alarmism
The trend hasn’t changed:

...
The trend figures come from Phil Jones’ interview with the BBC. Graph discussed here.
The holocene optimum
Don’t forget to allow for another century of warming at the end (be generous) assume its 0.7C more than the last dot on this line and mentally draw a line from -31 across. A lot of the last 10,000 years was warmer.

Greenland Temperatures - last 10,000 years
It was warmer 130,000 years ago:
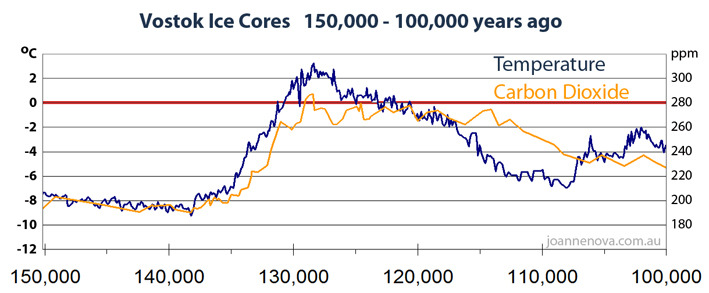
Vostok Ice Core. Present temperature marked in red.
It was 2 degrees warmer 130,000 years ago. Somehow corals survived, so did the Great Apes.
The Vostok Graphs (and all the posts tagged “Vostok”)
The last 65 million years:

65 million years of global temperatures Image created by Robert A. Rohde / Global Warming Art
Image created by Robert A. Rohde / Global Warming Art
Discussed in the post: The big picture: 65 million years of temperature swings
Why measure “records” with thermometers like this?

Figure 1: An official thermometer at a waste water treatment plant. It gets extra warming from air conditioning and refrigeration exhaust, concrete, a brick wall, and some mechanical equipment. It is protected by windbreaks. In addition, the effluent flowing under the grates is well above freezing in winter when vapor can be seen rising from the grates. (The red lines show possible heat paths; obviously only a small portion of the heat from each source gets to the thermometer.) Photo courtesy of Anthony Watts, www.surfacestations.org and Steve Tiemeier.
Discussed here in: Is the Western Climate Establishment Corrupt? Part I and in The main “cause” of global warming is air conditioners. p7
Lets not forget they mysterious Dying of Thermometers:

The Great Dying of Thermometers
Right about now, it’s time for someone on the Big Scare Campaign to pop in and remind us that Skeptics never back up their arguments.
Resources:
Christopher Monckton roasted one journalist who repeated the litany. And in the interests of fairness, Steketee responds.
Thanks to Ainslie for The Age article and the inspiration.
I’m off on holiday for a few days. See you mid next week.


C3: NOAA & NCDC Pursue Goal of ‘Warmest Year Ever’ For 2010 – Release Newly Fabricated Global Temperatures………..
http://www.c3headlines.com/2010/12/noaa-ncdc-pursue-goal-of-warmest-year-ever-for-2010-release-newly-fabricated-global-temperatures.html
50
Wow! I didn’t know all that stuff. I’m really convinced now 😉
31
Tim Lambert is sweating on Andrew Bolt’s response to
Steffan’s[Should be David Jones] prediction in Dec 2009.http://scienceblogs.com/deltoid/2011/01/do_you_think_bolt_will_mention.php
I suppose the short answer is: “It was BS then, and it’s BS now.”
Ryan Maue on WUWT reports Green’s pique about the media’s lack of song and dance.
http://wattsupwiththat.com/2011/01/13/green-journalists-lament-the-lack-of-overwhelming-coverage-of-global-warming-in-the-liberal-media/
Maybe the message, a la your points #1, #2 and #3, is finally getting through to the MSM. Either that, or there may be too many journalists around the world shivering in record low temps to believe the record hot claim!
[Correction made as per comment #8] ED
20
Just saying…..
http://wattsupwiththat.com/2011/01/14/according-to-ncdcs-own-data-2010-was-not-the-warmest-year-in-the-usa-nor-even-a-tie/#more-31629
20
John Brookes:
At #2 you admit the ignorance that you have often displayed here when you say;
So, I add a bit more information to help you.
People need to think what these claims of ‘hottest year on record” mean, because they do not mean much, and they certainly do not indicate any anthropogenic (i.e. human) influence on global temperature.
People affect local temperatures (e.g. it is warmer in a city than surrounding countryside) but such local effects (even from land use changes) have trivial and indiscernible effect on global temperature.
The average of temperatures everywhere around the surface of the Earth is called ‘mean global temperature’.
Temperature changes everywhere, and the mean global temperature varies, too.
The mean global temperature seems to vary in cycles that are overlaid on each other. And two of these apparent cycles seem to have dominated recently.
One cycle is indicated by archaeology and it seems to have a cycle length of ~900 years. It provided
the Roman Warm Period (RWP), then
the Dark Age Cool Period (DACP), then
the Medieval Warm Period (MWP), then
the Little Ice Age (LIA), then
the present warm period (PWP).
Warming from the LIA to the PWP has been happening for about 300 years.
Thermometers have been measuring temperatures at places around the world since about 1880. And this thermometer temperature record is used to estimate mean global temperature. These estimates are very inaccurate because most places do not have thermometers and both the number and places of the thermometers has varied throughout the time since ~1880. However, these estimates show the global temperature has risen since 1880, and this agrees with the archaeological information.
And the thermometer-derived estimates indicate another temperature cycle with length ~60 years. It provided
cooling or no warming before ~1910, then
warming from ~1910- to ~1940, then
cooling or no warming from ~1940 to ~1970, then
warming from ~1970 to ~2000, then
cooling or no warming since ~2000.
Of course, the recent temperatures are the highest in the thermometer record because there has been a general trend of warming for about 300 years. Hence, it is not surprising that “the decade that just ended included nine of the 10 hottest years on record” as NCDC says in a recent press releas. However, the lack of warming since ~2000 combines with the measurement errors such that there has been no statistically discernible (at 95% confidence) change in the temperature over the most recent 15 years.
If the pattern of these two apparent temperature cycles continues then either
(a) the mean global temperature will continue to show cooling or no warming until ~2030 when it will resume its rise towards the values it had in the RWP and the MWP,
or
(b) the mean global temperature will continue to show cooling or no warming until cooling towards temperatures of the DACP and LIA will initiate before ~2030.
A change to this pattern would indicate a change to the causes of the pattern of changes to global temperature.
But the fact that recent years are the warmest since ~1880 indicates nothing.
Richard
30
Jo,
From this planets’ birth it was getting naturally colder due to moving away from the sun.
Scientists treat climate science as a simple understanding when actually it is far more complex than the human body it created.
You cannot just slap a general theory together to blanket the globe(done in many areas) as there are highly complex systems in place that have different energies working interactively. The atmosphere and pressure smooths out these actions across the globe.
The physical planetary changes were and still are fluffed off to AGW without investigation.
I do a great deal of research in motion, mechanics, history, mass and gases properties, etc. This breaks many laws and theories as individual areas generated boundaries.Even religion does not stand up to planetary history, especially the study of Ice Ages.
20
O/T I know but Jo I see your old mate Lewandowsky giving the world the benifit of his opinion over on their ABC Drum
20
My comment at 9:28pm referred to Steffan in error. Should be David Jones. Cut from the same cloth, though.
20
Richard@5:
Looking for patterns in data – whether it be 900 year cycles, 60 year cycles, or whatever, is fraught with danger. It really is just too easy to see stuff which isn’t there. Even where there is a physical reason for cycles, and they’ve been going for a while, that doesn’t mean they will continue. Take the ice ages. For a long time they followed 41ky cycles, then they swapped to 100ky cycles. Both 41ky and 100ky have orbital origins, that is, there is an actual reason to believe that our climate should follow these cycles. Even so, we don’t really know why we changed from 41ky cycles to 100ky cycles.
But to reiterate the original point, hunting for patterns in data is a good way to delude yourself. Its even worse if you have no known physical reason for the patterns.
AGW may not be right, but at least it has a convincing physical origin, and data which behaves as you would expect.
21
Oh, and Jim@4, what is the fascination with temperatures in the US? Does AGW say the US should be getting warmer? Not really, it says the world as a whole should get warmer, but the last time I checked, the US wasn’t the world.
21
One last thing, if you guys don’t want to have to put up with this “warmest year ever”, or “warmest decade ever” stuff, just arrange to have some cooling, and you won’t have to listen to it.
21
No warming for 350 years in Central England.
http://thetruthpeddler.wordpress.com/wp-admin/post.php?post=462&action=edit&message=1
20
Re: Percival @ #1. Thanks for the link. What I do not understand is why adjustments to the temperature record for recent years always seem positive? Based on my understanding, the UHI effect alone would suggest the raw data should receive negative adjustments in more recent years if at all. Not sure I’ve seen this explained here or elsewhere. What is the establishment’s explanation for the recent upward revisions? Secondly have the satellite results for 2010 been made available yet, as perhaps no one should be getting too excited until we have?
20
John Brookes,
Here’s a question for you (actually 3 in 1). I keep asking this to those making the “warmest year ever” claim. If it is the warmest year ever, then there must be somewhere with a convincingly high temperature — or some region with that characteristic. Otherwise you can’t make the “warmest year ever” claim.
So John, exactly where were those high temperatures measured, who measured them and how were those measurements made?
You seem convinced of the claim so surely you can tell me those little details.
I await your enlightening answer.
Roy
10
John Brookes:
At #9 you repond to my factual statements concerning the behaviour of global climate over the last two millennia by arm waving assertion that you summarise as:
But observing behaviours and looking for explanations of the observations is what we scientists do. It seems to have worked reasonably well since the rennaisance and so I – together with all other scientists – will ignore your assertion. Sometimes the patterns are merely fortuitous, but examination of those reaveals what is realy happening. Therefore, your comment is an attack on the scientific methos and I reject it absolutely.
Then you follow that with the fatuous assertiona:
No!
AGW does not have “a convincing physical origin”.
It is based on three assumptions: viz
(1) It is assumed that the anthropogenic CO2 emission is the major cause of the increasing atmospheric CO2 concentration
and
(2) It is assumed that the increasing atmospheric CO2 concentration is significantly increasing radiative forcing
and
(3) It is assumed that the increasing radiative forcing will significantly increase mean global temperature.
There are reasons to doubt each of these assumptions. But if any one of them were known to be false then the entire AGW hypothesis would be known to be false.
Think about it.
The AGW hypothesis is that a trace atmospheric gas which is the very stuff of life itself may – if it increases its atmospheric concentration – become Shiva, the Destroyer of Worlds. In fact, it’s worse than that. Nature emits 34 molecules of CO2 for every molecule of CO2 emitted by human activities so AGW suggests that a minute increase to the annual emission of this essential trace gas could cause Armageddon. Furthermore, in the geological past and during ice ages the atmospheric CO2 concentration has been more than ten times greater than it is now.
If you had never heard of AGW and somebody came in off the street and tried to sell it to you would you say, “Oh dear! Of course, we must change the economic activity of the entire world”?
Richard
10
John Brookes:
One additional point.
If the AGW hypothesis is true, why has there been no statistically discernible (at 95% confidence) change in the temperature over the most recent 15 years while CO2 emissions and CO2 in the air have both continued their relentless rise?
Correlation does not prove causation
but
absence of correlation disproves causation.
Richard
10
Ahoy John @ 9
The light is shining through.
& while you can’t know just how much of the information is subjectively reported & then cynically manipulated by successions of entities who have their own agenda.
Finally “we are from the government & we are here to help you” (Tax you & homogenize you life) or “we are from the media & we are here to inform you” ( homogenize your thinking, spending patterns & political ideology)
It is a very human trait to see what we want to see & base our beliefs on our “experience”.
10
“Richard S Courtney” (14), in your reply to the troll “John Brookes” you urge him to “think about it”.
THINKING would be a NEW experience for John Brookes.
He should try it some time.
He might actually come to enjoy it!
10
Not sure if the MSM gives the margin by which 2010 was “the hottest year” but NASA, in its report, seems to be unsure on whether it was significantly hotter than 2005. It settles for 2010 being 0.018F (perhaps 0.018abc0baF would have sucked in the MSM to an even greater degree)which of course even rounded to 0.02F is hardly significant.
Hansen on any measure is paranoid about those wicked oil companies messing up our lovely Garden of Eden and his highly likely to be rigged figures are balanced with a skeptics. Here’s “Roy Spencer’s hottest year”:
“WHO WINS THE RACE FOR WARMEST YEAR?
As far as the race for warmest year goes, 1998 (+0.424 deg. C) barely edged out 2010 (+0.411 deg. C), but the difference (0.01 deg. C) is nowhere near statistically significant. So feel free to use or misuse those statistics to your heart’s content.”
For the arithmetically challenged 0.01C = 0.018F. And Spencer confirms that Hansen’s 0.18F is statistically nowhere near significant. So no need to get in a lather lads. Hansen’s still in the conning game and your average editor/journo is a pisswit when it comes to asking the necessary, “yeah but by how much”?
10
….Hansen’s (0.18F).. try (0.018F).. Bet Hansen would love me doing his typing.
10
The Age continues to disappoint.
Yesterday was this muddled offering from Ian Lowe:
http://www.theage.com.au/opinion/society-and-culture/drowning-in-a-hothouse-20110113-19pr1.html
And today Penny Sackett chips in with a self-contradictory column:
http://www.theage.com.au/opinion/society-and-culture/room-for-hope-as-floodwaters-subside-20110114-19r8n.html
10
If as Penny says AGW means more/unit time and severer droughts plus more/unit time and severer floods then bob’s your uncle. All we may need are a few more dams to get us through the new style droughts and to collect and store water from the new style floods.
One spin off from those effects of AGW is there would be less work for weather forecasters.
10
Jo,
“No one knows exactly why it started rising back then, but it wasn’t CO2.” is generally right, but the problem has not been posed correctly.
It should be stated as ‘what caused the Little Ice Age that preceded it’ that caused the catastrophic cooling. It also assumes that LIA temperatures were “normal” and that the subsequent warming is abnormal, when it’s pretty obvious that it’s simply the earth system returning back to its previous state of the MWP. And then it still hasn’t reached that thermal state as MWP Greenland remains unihabitable even now. Now THAT is something we actually don’t yet understand.
We do know why the earth started the warming trend back in 1850, the effect of the LIA ceased and it’s more important to understand what caused that, then trying to understand why the earth has been warming.
It’s like extracting a near frozen person from an ice cold lake (the person fell through the ice) and observing that person increasing in warmth and temperature after being rescued, but being mystified why the person is warming up.
That’s what climate science is obsessing about – why is the earth warming up! Why is joe the almost drowned person warming up! Unfortunately sceptics are also concentrating on this as well.
It’s the cause of the LIA that has to be studied, not the present day warming. When and if we get back to MWP temperatures and the warming continues, then maybe there is a problem, but right now there isn’t one.
10
Out of the mouths of babes…
John Brookes:
lets see….like that day-night thing?
Yes it would be truly unwise to think that something that has happened on a predictable cycle would suddenly stop. NOT!
Especially, John, compared to the “wisdom” of believing a theory that has no example throughout history to support it.
10
[…] This post was mentioned on Twitter by Robert J. Robert J said: @AI_AGW The Warmest Year Antidotes « JoNova http://goo.gl/PUkN2 […]
10
Richard S Courtney @ 5
A couple of other things to add to the list:
1. Until the mid 20th century, the thermometers used were hand made with an accuracy commensurate with the old “nose to finger tip” definition of a yard. Even later machine made thermometers to ASTM standards were only marked to a half degree.
2. Many temperature measurements taken in country Australia, at least until the mid 1950’s, were from thermometers hung on a nail on the back verandah of the homestead or the local post office. The farmer’s wife or the post mistress took a reading when she remembered and rang it through to the then weather bureau. How do I know this? Because I watched my aunty do it and it was major event the first time she allowed me to do it!
3.How accurate were the temperature readings taken on the 70% of the earth covered by sea, i.e on a ship, before the advent of satellite measurement? Surely being surrounded by steel exposed to the sun would have an effect?
4. What percentage of the earth’s land area was inaccessible and could not provide date? Add that area to that of the oceans and the early data was from a very limited and hardly representative area.
Were all the readings from the avaiable sources than “homogenised” to develop some sort of consistency? They as sure as hell were not comparable either to data collected at the same time or by satellite!
10
I find one of the greatest antidotes for CAGW is simply going over to RC and looking at some of the moderator comments… how can you take them seriously when their leaders, like Jim (Bouldin), make comments like this:
Link: http://www.realclimate.org/index.php/archives/2011/01/overheard-in-the-newsroom/
Say denier a few more times Jim, but be careful that you don’t burst a blood vessel. And then the hardcore supporters like Tamino weigh in:
To his credit he does say “I’ve been at it for years, and my ignorance is still impressive”… grats Tamino, but we knew this about you for some time mate.
You see kids debating an issue and one of them is clearly beaten but unrepentant and refusing to let go of their position, you expect obstinate digging in of the heals and lines like “liar, liar pants on fire.” For CAGWists it is “denier.” This is starting to become their favourite word (note how many times Trenberth said it in his prepost of the upcomming AMS speech), so you know they are losing the debate when they resort to one-word insults.
10
In this months ‘New Scientist” pg 38 “Behind the Predictions – the truth about Climate models” – still a lot of faith in computer models. They envisage more complex models including a number of more complex processes. Underlying theme, “models don’t matter much … if we don’t cut emissions.” hmmm. for a moment there I thought NS was going to publish something scientifically credible …..
10
Why is the media reporting on global warming so biased in favor of those supporting it? Shouldn’t there be two sides to every story? Why are all the western governments pushing for global warming taxes when the science remains unproven? Why do people still believe that hypocrite and snake-oil salesman Al Gore?
Al Gore has no friends and is just using global warming to get attention. His own wife divorced him and his children are on drugs and booze because of him. I’m super cereal.
By the way, there’s no possible way for America to pay back its debts. Even if Americans passed a carbon tax, they still couldn’t overcome their budget deficit. They can’t print money forever. I look forward to the day when China buys America and turns it into a sweatshop. Of course, America could always go rogue like North Korea and threaten everyone with nukes.
10
Mark my words. The western nations will be punished for their arrogance and for pushing this global warming scam against the rest of the world. Jared Loughner is just a symptom of the cancers eating America from the inside. If this global warming scam is not stopped, and its perpetrators not punished, then prepare your family and kids for HELL ON EARTH. STOP THE UN before the fascists take over.
10
The Lewandosky article at the ABC is here:
http://www.abc.net.au/unleashed/43020.html
He advocates against cherry-picking and then immediately turns arouns and does it several times in the same article – he’s a hoot that crazy ole prof…
I just gave him a serve, here is the pre-blog:
10
Wow they closed comments on Lewandowsy’s blog already and it is the most recent blog on Unleashed. Mind you 272 comments got in before the plug was pulled. The CAGW ferals were out in force… it would be interesting to do a word count on “denier” and see how many times it was used.
10
Louis Hissink @ 23:
Agreed. It’s long been known to have coincided with the Maunder Minimum, however we still don’t understand how an inactive or reduced sunspot Sun should have such an impact. Perhaps the small but pervasive impact of sunspots forces and feedbacks on other factors. We are aware that greater cloud cover creates greater albedo, likely caused by higher temperatures allowing for more tropical conditions and atmospheric water vapour.
It’s still the DIFFERENCE in atmospheric temperature regions that allow water vapour to condense into cloud. Regardless, these warming and cooling cycles appear to complement each other, forced by the Sun, buffered by the oceans and atmosphere, continually seeking equilibrium. More severe ice ages would require something akin to Milankovich Cycles but in any case as we’ve all seen in the past, those forces are far more powerful than any trace gas could ever hope to be.
If we’re ever to understand these forces, we need to either abandon this incessant and inaccurate computer modelling for a while, or punch in the right numbers from actual observations. However, we’re all well aware that CAGWists just love to spend grant money on new hardware to download porn faster.. 😉
10
John Brookes,
Sorry to rub it in but you haven’t answered my question from post 14. If you could have answered I think you would have been happy, even eager to shoot me down. So I think you can’t answer it.
You follow several others who make the warmest year on record claim and then can’t back it up with what should be easy data to provide were the claim actually true.
10
That graph is so compelling. It’s somewhat shocking that it isn’t more widely seen.
10
Roy Hogue @#14, #34
Excellent question, Roy. I can picture John Brookes still googling like crazy for an answer! Australia can’t help him. 2010 was the coolest here since 2001. It seems that New Zealand’s estimate for 2010 is not posted yet. Presumably NIWA there is still “working” on it. What about, say, Central England? No joy there, either. 2010 was the 6th coldest there since 1950.
It would be really interesting to list temperatures for 2010 from localities around the world, if that can be done, and compare the average of those with the historical record. So keep googling, Mr Brookes!
10
Warwick Hughes http://www.warwickhughes.com/blog/?p=780#more-780 has a Guest article by Pat Frank
Dr Frank says
We’ve all read the diagnosis, for example here, that the global climate has suffered “unprecedented warming,” since about 1900. The accepted increase across the 20th century is 0.7 (+/-)0.2 C. As an experimental chemist, I always wondered at that “(+/-)0.2 C.” In my experience, it seemed an awfully narrow uncertainty, given the exigencies of instruments and outdoor measurements. I did a study which led to the paper that is just out in Energy and Environment [5]. Here’s the title and the abstract:
Title: “Uncertainty in the Global Average Surface Air Temperature Index: A Representative Lower Limit”
(abstract follows and conclusion)
This lower limit of instrumental uncertainty implies that Earth’s fever is indistinguishable from zero Celsius, at the 1σ level, across the entire 20th century.
There’s a link in a comment to the above article by Geoff Sherrington
to http://www.geoffstuff.com/Jane%20Warne%20thermometry%20Broadmeadows.pdf
A Preliminary Investigation of Temperature Screen Design and Their
Impacts on Temperature Measurements
and as for me I’m still running in circles screaming and shouting; I can’t believe we’re getting so heated over such an infinitesmal temperature rise (if it exists at all)
10
Puzzled @#
Steady on, mate! Only those responsible for the scam must be held to account. Period. And Loughner is just a symptom of the cancers eating Loughner from the inside. Period.
10
One or two posts above discuss the non human factors that have led to slight global warming over the last few centuries. The CAGW crew are pretty smart propagandists re the 2011 Queensland floods and are connecting AGW with greater rates of evaporation causing greater rates of precipitation.
I notice that though the 1893 Brisbane region flood peaked at greater heights at some locations than 2011 did there appears to be heavier episodes of rainfall on the days immediately around the flooding this time. That may need checking in terms of soil moisture for 1893 and a larger rainfall window but that data could be used to show that more rain fell this time to substantiate that AGW is the cause. Of course if the “extra heat” were all or principally from natural climate change that also may account for greater rates of evaporation/precipitation this time if that is indeed the case.
There also is the likelihood that the distribution of the rain was over a larger or smaller area and the total evaporation required to feed the relevant precipitation in 1893 and 2011 may need fuller assessment.
(Not forgetting also that weather is a tricky beast that has more than one or two variables causing and influencing it i.e. the alarmists claim is possibly too simplistic).
10
Since most climate researchers are on “soft money” (i.e., 100% of their salary comes from grants) — and, speaking as an engineer and reluctant academic also on soft money — their “primary responsibility” is getting more grant money. Anyone who can’t get grant money is out of a job.
The amount of grant money available for research showing that AGW is a huge problem requiring massive government intervention exceeds the amount of grant money available for research likely to show that AGW is not a big problem by about 3000:1.
As Upton Sinclair said: “It is difficult to get a man to understand something, when his salary depends on his not understanding it.”
10
From point one.
That rate of warming has increased over the last 300 years. The temp anomoly has been getting steeper. Do you disagree?
As for Roy’s challenge, Roy Hogue @#14, #34
You can’t be serious with that obsurd suggestion Roy. Look it up yourself. There were lots of places with record warmth at various times of the year in 2010. HINT: you don’t even need to use google.
10
Graham,
Puzzled is only one of many who are quick to blame the Arizona shooting on everything but the schizophrenic mind of Jared Loughner. I don’t know where Puzzled lives but from his tone I’d say he’s not an American.
We have many problems but the vagrant opinions of such people don’t help a bit.
For those not familiar with the metaphor, “vagrant opinion,” it’s an opinion without visible means of support.
We have an endless supply of those on the left blaming any and all Republicans/Conservatives for the shooting, when in fact all such incidents I know about are the acts of single individuals, possibly with the help of no more than 1 or 2 others and are hatched out of the perpetrator’s own twisted understanding of events or personal gripe based on their own imagination and pathology.
10
I just learned something more about Australia. I believe the folk song Waltzing Matilda has a verse that mentions a swagman, something I never understood. But when I looked up “vagrant” I found that a synonym for it in Australia might be swagman (Merriam-Webster Online). Then I just had to look up swagman directly and there was the full definition. So my ignorance on that subject is now settled. By the way, I’m an avid fan of authentic folk music from around the world.
10
Manwichstick @#41
Look at the first graph (the linear factual one, that is.)
The question was for the year, not instances during it.
List them, please.
10
Manwichstick @41,
Then please answer my “obsurd” question. Surely you can do it after such a statement as #41.
Roy
10
Googling’s not such a bad idea, MWS — unless you like to be a tool of propagandists.
Just a year ago, a scientist at NCAR published a study that proclaimed that “the decade of the 2000’s had the largest ratio of high temperature records to low temperature records ever! (In the US.)
Yep, that was true. Check out this graph, however, and you’ll see that it was also a deliberate deception. Sure enough, the ratio is the highest of all decades since the 1880s — but the 1930s had 6 times as many high temperature records as the 2000s. (These, BTY, are unbroken records.)
So (as of 2009) the 1930s had 6 times as many unbroken high temperature records as the 2000s — but the NCAR author tried to fool the unwary into believing that the 2000s somehow beat the 1930s for high temperature records, by only talking about ratios.
When unbroken, all-time temperature extremes were compiled by Univ. of Colo Climatologist Dr. Richard Keen, he found that 50% of the all-time temperature records (per state) were set in the 1930s alone. Only 29% of the all-time high records have been set since 1950, and a trivial number in the 2000s.
Responding to the NCAR study’s deceptive analysis, Keen concludes: “The bottom line is that if one wishes to express climate change by the varying number of temperature extremes, there has been no climate change for over 100 years.
10
“You can’t be serious with that obsurd (sic) suggestion Roy. Look it up yourself. There were lots of places with record warmth at various times of the year in 2010. HINT: you don’t even need to use google.”
There were also lots of places with record low temperatures last year also. I think the climate crazies like to call that weather. What do you think?
“That rate of warming has increased over the last 300 years. The temp anomoly (sic) has been getting steeper. Do you disagree?
Hard to be sure it is not pretty flat within the bounds the error limits but one thing we and you can be absolutely sure of is that at least the first 200 of your 300 years were not due to increases in atmospheric CO2 levels. Contemplate the last 1000 years or so of them from the URL below and tell us what was driving your curve in that period?
http://www.johnstonsarchive.net/environment/co2table.html
No need to apologize or say you are a bit stupid or what a dickhead I’ve been because most of us, I’m sure, are quite able to make that sort of assessment without any help.
http://www.johnstonsarchive.net/environment/co2table.html
10
It would take half of China just to buy California. (We might even be willing to sell, if we could pick which half 🙂 )
Better hope not, mate — America has nukes that actually work.
(If you knew what you were talking about, your comments might make sense — if you weren’t an idiot.)
10
Val @ #37
Val, it’s not surprising the CAGW obsess so much over microscopic temperature changes – it’s a belief system that we are dealing with, not objective science. It’s the logical outcome of state sponsored science, pure and simple.
10
@Ray #45
Canada (where I live), Greenland, China, Northern Africa, Parts of Asia and Russia.
Also, if 2010 is amoung the hottest in our lifetime, there must by default be some hotspots. You can conclude that without even looking.
Again thanks to all of you for more links to follow.
BTW to BOBC
Did you read Archer’s recent paper on CO2 resident time in the atmosphere?
10
@50,
Do tell! Sorry, that’s not responsive to the question. But thanks for trying. Default to, there must be some hotspots because 2010 was the hottest in our lifetime, is just an appeal to authority. It doesn’t fly.
10
Thanks Louis for that comment
If you have time could you visit
http://jennifermarohasy.com/blog/2011/01/flood-crisis-consistent-with-accentuated-hydrological-cycle-a-note-from-luke-walker/#comments
My relevant comment is today January 16th, 2011 at 9:32 am
I need some informed help with Luke’s responses
10
BobC:
I hear you BobC… I used to teach economics and finance at the WA School of Mines. That was a hard-monied teaching position (albeit contracted) because it was traditionally a teaching-focused institution. With the merger into Curtin University, however, the focus started to shift somewhat to research.
10
Val @ #52
Val,
Good grief – Luke Walker is still posting at Jen’s? I’ve noticed Jen has restarted her blog as well – looks like the CAGW crowd have got second wind for another foray into reality.
I’ll have a look in any case, and I might have some solid ammunition against the CAGW take of the Brisbane flood as well but will take a week or so and will be published in AIG News next month. However the counter argument can be made using this new material.
10
Val
I just read Luke’s responses – he basically dismisses the idea of a global temperature rise and changes the goal posts to the variation around that computed mean. This means that if his argument holds water then statistically the variance around the mean must be increasing with time. This means that both minimum and maximum temperatures must be increasing while the mean remains more or less constant.
If Pat Franks’ paper is considered, then the intrinsic error in the measuring equipment seems to be greater than the statistics so derived, and thus any computer trends mathematical artefacts.
I am reasonably sure that if max and min temps had been lowering and rising over time that this data would be thrust down our throats by the Lukes of this world – but the fact that no numerical data are presented to support his case is your clue.
In any case Pat Franks’ work suggests that changes in temperature are not the forcings in weather that the CAGW group think it is, and that weather is being driven by other physical factors.
Luke argues by way of ad hominem as a starting point and is one the more active Qld department of climate change bureaucrats (he is associated with the “Long Paddock” group)commenting on some of the blogs.
10
thanks Louis, I’ll try using that amunition; for a lay person such as I am it’s difficult when people keep changing the goalposts
10
Val, Luke is very good at changing the goal posts and when that doesn’t work, he reverts to abuse etc, as you will soon find out. The problem the CAGW supporters face is that they demand we prove unproveable tests, much like Trenberth did with his inversion of the null hypothesis. It’s an intellectual debate that we are involved in, but embellished with specious science, and as their side is government funded, while ours out of our own pockets, then it’s hard. We should never forget that we are fighting the state, not global warming per se, and that is always dangerous.
Take no prisoners is my credo in this battle.
10
Roy Hogue@34:
I didn’t mean to not reply to your question, its just that I didn’t really understand it. You seemed to be saying that, given it was a hot year, could I please tell you some places which were hot?
Off the top of my head, how about Russia in the last northern summer? And again with an unusually warm spell in the middle of their winter.
Somewhere (I forget where) there is a site which lists country wide weather records, highest max, lowest min etc. A rather astonishing number or record highs were set in 2010 (along with a rather smaller number or record lows). But of course you guys don’t care about this sort of thing, because if we are getting warmer its just that we are coming out of the little ice age, and its entirely natural, with no artificial colourings, flavourings or CO2 added.
10
John Brookes:
At #2 you made a facile comment that I refuted at #5. You responded with silly nonsense #9, #10 and #11.
That nonsense was answered with a question put to you by Roy Hogue at #14, by my refutations at #15 and #16, and a superb putdown of your nonsense by Mark D at #24.
You did not answer Roy Hogue’s simple question which was
so he pressed it at #34. In #58 you have replied by saying;
Say what!?
You did not understand the question? If your comprehension of the subject is so little then perhaps you shold consider not pontificating about it.
And the best answer you can give is “Russia in the last northern summer”. John, a year does not only consist of a summer. Russia did not have a hot year but had hot weather during part of the year.
So, the best you could do in attempt to justify your nonsense is to provide this additional nonsense:
John, if this is the best you can do then STOP because you are giving trolls a bad name.
Richard
10
John Brookes
The following site lists the highest and lowest temperatures recorded worldwide.
http://members.iinet.net.au/~jacob/worldtp.html
10
Oh come on Richard S Courtney! I do my best.
Louis Hissink, I looked at that page, and it looked a bit dodgy, particularly the bit that said “This page was last updated on the 17th October, 2005 at 1:00pm WST”.
Anyhow, you’ve forced me to find the reference, and its in Wikipedia (yes, sorry, maybe you’d prefer Conservapedia – see http://www.conservapedia.com/Climate_change), see http://en.wikipedia.org/wiki/List_of_weather_records for the left wing view.
Chad, Niger, Sudan, Iraq, Kuwait, Burma, Pakistan, Qatar, Russia, Saudi Arabia, Belarus, Cyprus, Finland and Ukraine all recorded their hottest days (since records began of course) in 2010. Of course, these records don’t really count, because they didn’t happen in the USA.
We should be fair and list the record cold temperatures in 2010 – but if you believe the Wikipedia page – there weren’t any. Sweden did set a cold record in December 2009, so we can include that at a pinch. Actually, lets be really fair and guess that there might have been a few record cold temperatures set in December 2010, and that these haven’t made it into Wikipedia yet. Its still looking pretty one sided.
But as I said before, don’t sweat it, we’re just coming out of the little ice age, and the warming will stop any day now.
10
And besides Richard, every site needs a tame troll, and I’m yours.
10
42Roy Hogue says:
“Puzzled is only one of many who are quick to blame the Arizona shooting on everything but the schizophrenic mind of Jared Loughner. I don’t know where Puzzled lives but from his tone I’d say he’s not an American.
“We have many problems but the vagrant opinions of such people don’t help a bit.
“For those not familiar with the metaphor, ‘vagrant opinion,’ it’s an opinion without visible means of support.
“We have an endless supply of those on the left blaming any and all Republicans/Conservatives for the shooting, when in fact all such incidents I know about are the acts of single individuals, possibly with the help of no more than 1 or 2 others and are hatched out of the perpetrator’s own twisted understanding of events or personal gripe based on their own imagination and pathology.”
——-
Crazy people exist everywhere. Unfortunately, cunning, unconscionable politicians have now discovered a way of exploiting them and the tragedies they cause for undeserved personal gain.
10
John Brookes,
You treat the list of world temperature extremes linked by Louis as though you didn’t understand it (too old to be worthwhile). So you miss the important implication that record setting temperature extremes have been happening for a long time. Look at the dates on some of those events. They go back to early 20th Century and before.
Anyway, you not only failed to answer my question but you could never answer because it’s really impossible to answer. All you have that you can point to are some isolated hot days or periods which mean nothing by themselves. See what I said above. And that’s why I throw out the question. So far, including you, three different alarm bell ringers have tripped over it — complete silence or if pushed about it, an excuse of some kind.
FYI we had a record setting hot day right here in California last summer when downtown Los Angeles got up to 113F (45C) on one hot day. So it does happen here too.
For reference, the west end of the San Fernando Valley (just north of downtown and part of the city of Los Angeles) can get up to 110F in the summer. 100 is not uncommon. I know this from personal experience. Downtown is on a coastal plane and is usually cooler. But we regularly get what are called Santa Ana conditions in which already warm air from the higher desert to the east is forced down the Santa Ana Canyon, heating up as it goes lower. This brings high temperatures and sometimes very strong destructive winds all over the region.
Shall I worry about 113 degrees? Only if it begins to stay that hot!
PS:
Actually you appear to have replaced MattB as the site mascot (not really the best term but I don’t know a better one). 😉 That you seem to be content in that role does not speak well of you and I would think you’d want to be seen in a better light.
10
Florida,
You are absolutely correct.
10
And here, for the benefit of John Brookes and others, is Climate Depot’s rebuttal of the 2010 is the hottest year on record nonsense. Note that even James Hansen agrees.
Making a big deal out of nothing has become a full time occupation.
10
No. Do you have a more complete reference (where published), or a link? I’d like to take a look.
10
Florida @63 (and Roy)
You are exactly spot on in your observation! I Don’t think it fair to burden this site with too much off-topic commentary about the tragic shooting except to say that:
Sounds very familiar in the context (on topic) of CAGW.
Florida, thank you for confirming all my observations and they are the same as yours.
10
So much for warming being global. While there are cool areas all over the globe, the warm now seems mainly confined to 130 deg E to 50 deg W and above 60 deg N.
http://www.esrl.noaa.gov/psd/map/ANIM/sfctmpmer_01a.fnl.30.gif
Is this area the departure lounge for the last remnant of the solar warming of last century?
10
Have a look at the DESPICABLE and INSENSITIVE LIES made by the COMMUNIST bob brown from the WATERMELON PARTY (greens)!!!!!!!!
“Coal miners to blame for Queensland floods, says Australian Greens leader Bob Brown”
He may as well have been saying the people who use Electricity got what they deserved!
http://www.news.com.au/breaking-news/coal-miners-to-blame-for-queensland-floods-says-australian-greens-leader-bob-brown/story-e6frfku0-1225988806619
WHAT A TRAITOR AND A SCUMBAG bob brown is!!!!!!!!!
10
Good one Siliggy, and yet the arctic is still building ice. Let’s just hope that we have SOME warmth left for a few years.
Ironic to me that the warmists believe arctic melt is a sign of warming. I rather firmly believe it is just the opposite. With open water able to lose much more “heat” than snow covered ice caps. Further, the cold melt water will circulate and displace warmer seas. Perhaps we are watching the next ice age setting up in the staging area.
It would be entertaining just to sit back and watch the universe take care of “business” without the hassle of arguing with trolls and con artists wouldn’t it?
10
To BOBC #67
This article came up recently, but it is older than I thought. Sorry for the bait and switch.
Perhaps it was flagged because it was recently made available to all without subscription… I don’t know.
Atmospheric Lifetime of Fossil Fuel Carbon Dioxide
Annual Review of Earth and Planetary Sciences
Vol. 37: 117-134 (Volume publication date May 2009)
10
John Brookes @ #61
Indeed we are coming out of the LIA and my position is that until Greenland gets to where it was before the LIA, then there is no problem. If, however, global temperatures keep rising after that, then that would be of interest, but not necessarily of concern.
It’s the cause of the LIA that is important to understand, for that then helps to understand what is happening now.
Incidentally the CLimate Change belief has reached the stage where its proponents assert that any change in weather and climate verifies it, which means that that nothing does. Which means it isn’t a scientific theory since its reached the state of not being capable of being falsified.
10
Re: BobC @48
I nominate the western half of California, roughly from a line drawn down the middle of the Sierras. Those haughty San Franciscans and Angeleños would find what it’s like to actually live under the jackboot of true authoritarians.
On second thought, there really should be three Californias. Northern California, starting just north of Marin County to the Oregon border, could become the 51st state. The state of Breadbasket, from south of Monterey, to about Thousand Oaks, could become the 52nd state. The remaining two portions could still be called California, but they’d be ceded to China in repayment of the debt of the United States. The slave wages of those Californians would just barely cover the interest on the debt.
10
US banks on coal, not Gillard’s dreams………
http://blogs.news.com.au/heraldsun/andrewbolt/index.php/heraldsun/comments/us_banks_on_coal_not_gillards_dreams/
Coal Driven Power Stations and Carbon Dioxide……
http://www.4bc.com.au/blogs/michael-smith-blog/coal-driven-power-stations-and-carbon-dioxide/20100111-m2h2.html
Our coal riches don’t spill over ……
http://www.dailytelegraph.com.au/news/opinion/our-coal-riches-dont-spill-over/story-e6frezz0-1225974111670
10
Here is a very interesting article in The Age which indicates the fickleness of public servants under the spell of alarmist activists.
Keep in mind a few short months ago the five billion dollar desalination plant was sold to the public, by the same genre of experts, on the basis that ACC has, is and will lead to a drier Victoria. Well that was up til she stated raining a few months ago and the dams started filling. It’s amazing how a few pictures of flooded streets set empty minds racing (Public “servants” well call them).
However, apparently though it is going to keep getting hotter and hotter because of continuing AGW, somewhere along the line the physical law that now will cause greater rates of evaporation as the Earth heats up will be suspended – kput – just like that. Thus whilst it will be getting wetter for quite a long time it will then be getting drier as apparently a now current physical law re evaporation no longer exists or doesn’t work anymore or something like that.
This brilliant discovery really encapsulates the message of the alarmists who, instead of thinking in terms of the real known weather drivers that always have caused weather, including its extremes, are hung up on a very minor factor which is very unlikely to matter one iota in terms of weather outcomes, now or in a thousand years even if the reserves of fossil fuels lasted until then.
http://www.theage.com.au/environment/weather/melbourne-suburbs-likely-to-flood-more-often-20110116-19sjc.html
“MELBOURNE should expect more of its suburbs to be flooded more frequently, according to an analysis of the metropolitan area conducted by Melbourne Water and private experts.
Modelling obtained by The Age warns that Melbourne’s drainage infrastructure will be overwhelmed almost twice as often by 2030, and the area affected by flooding may be 25 per cent larger across most parts of metropolitan area.
“The warnings are based on rainfall events becoming more intense under climate change, despite the expectation that Melbourne will ultimately be a drier place in the future.”
10
Llew @ 76.
I noticed the same thing in an article by Micheal Pascoe ( business journalist in the SMH ). His article was mainly on how the Brisbane authorities had not learnt anything from the 1970’s flooding ( when he was a cadet reporter up there). But he had to add that “only the diehard denialists ” did not understand that these events would become more common. The lack of logic is breathtaking.
10
Ross @ 77
My take on the Brisbane flood history ex BOM, over about the last almost 200 years, is that it is a powerful tool against the claim that anthropogenic CO2 emissions are leading to more and more extreme weather events. That history considered alongside the relevant atmospheric concentrations of CO2 give the lie to that claim.
Weather in a given region though it recurs cyclically is, I would suggest, never exactly the same because the multiplicity of factors that operate are very unlikely to combine in exactly the same way or with the same intensities. So if there are different or more extreme components to cyclical drought and flood events it is not necessary to look outside the historic weather drivers for answers eg to ACC.
10
Moderator: I just posted a reply to Manwichstick that disappeared into the aether (or, more likely, the spam filter).
I swear I didn’t do anything to suggest spam (I think)!
[So Sorry BobC I looked in the spam filter, deleted posts and held for moderation files. There wasn’t anything from BobC. (I can say that a trip to the spam file is an experience!) Don’t close your browser and look at “recently closed” in your history tab. Maybe it isn’t lost] ED
10
That makes me an outlier.
I think the ordinary and unexceptional cyclical warming since 1850 bares repeating along with presentation of Akasofu’s diagram at every available opportunity.
But I don’t think CO2 matters in that context.
10
But never too soon for Bob Brown to blame a coal miner for the floods…………
http://blogs.news.com.au/heraldsun/andrewbolt/index.php/heraldsun/comments/never_too_soon_for_brown_to_blame_global_warming_for_the_dead/
10
Why was the Wivenhoe Dam too full to save Brisbane from the floods?
http://blogs.news.com.au/heraldsun/andrewbolt/index.php/heraldsun/comments/why_was_the_wivenboe_too_full_to_save_brisbane/
10
Richard C (NZ)@ #80
What bears repeating as I see it, Richard, is that the cyclical warming/cooling is natural and is expected to continue, with an underlying warming trend, until natural climatic processes dictate otherwise. 1850 is the starting point of the cycles in the graph because that’s when land thermometer records became available. Coincidentally, CO2 emissions started around 1850 also. Yet warming, presumably in much the same cyclical fashion, had already been under way since the emergence from the Little Ice Age around 1700. So, essentially, CO2 emissions have been inconsequential over that entire time course.
10
The drought that warmists said might “never break” just did……..
http://blogs.news.com.au/heraldsun/andrewbolt/index.php/heraldsun/comments/the_drought_that_warmists_said_would_never_end_just_did/
10
Some of the ridiculous statements being made on The Australian’s blog attached to the Brown article beggar belief (linked again for convenience):
http://www.theaustralian.com.au/in-depth/queensland-floods/miners-attack-greens-leader-bob-brown-over-call-for-coal-producers-to-fund-flood-clean-up/story-fn7iwx3v-1225989350682
It would appear that many now accept that any extreme* weather event is a result of global warming caused in turn by man’s CO2 emissions. The ignorance so on display makes me mourn for the Australian education system which must surely be dead.
* that’s assuming you think the tag “extreme” is even appropriate for things such as floods which likely occur every few decades on average.
10
“Bulldust” (85), I noticed that now there are only 3 comments on the new article mentioned “http://www.theaustralian.com.au/in-depth/queensland-floods/miners-attack-greens-leader-bob-brown-over-call-for-coal-producers-to-fund-flood-clean-up/story-fn7iwx3v-1225989350682”
Censorship?
Surely not!
(sarc)
10
Percival,
Click on the rest of the 88 comments to get the rest- no censorship.
One interesting comment was that of “who burns all the coal we mine here in Australia – government”!
10
Graham: #83
Yes, natural should be the essential descriptive but I decided on a variation to avoid sounding like a broken record.
Worth highlighting too is that AGW and the IPCC prescribe accelerating rise in temperature and sea level. Syun’s diagram highlights the IPCC temperature prediction spectacularly but there’s not the same that I know of for MSL. I’ve submitted a post to Climate Conversation Group (not up yet) with a series of graphs displaying the decelerating rise in MSL and OHC because we hear so much of “the sea levels continue to rise” as if that supports the hypothesis.
10
Not there. Apparently it was the aether, then! 🙂
I’ll wait until I actually get the paper Manwichstick referenced, then write up a complete review.
Thanks for looking.
10
Manwichstick@72:
That paper about CO2 in the atmosphere is very interesting. They seem to think that if you pump a lot of CO2 into the atmosphere, it will take >200 years to equilibrate with the oceans, but when it does, the level of CO2 in the atmosphere will still be considerably higher than before you emitted the CO2 – because the atmosphere and ocean have established a new equilibrium, but both with higher concentrations than before. After that, much longer time scale processes gradually remove CO2 from the atmosphere and oceans.
The logical conclusion is that if AGW turns out to be a real problem, we will have to actively remove CO2 from the atmosphere.
10
Noticed Bastardi has appeared here quite a few times before but cannot locate this interesting interview here. Marginally relevant to the topic anyway:
“January 14, 2011 4:00 A.M.
Bastardi’s Wager
A meteorologist has a challenge for climate scientists.
Joe Bastardi’s great love is atmospheric science. He says he’s been fascinated by it “since I was a baby. My dad’s a meteorologist, his great-grandfather was the town weatherman in Sicily, and my son wants to be a meteorologist.”
And he’s disturbed by how the science, which he values for its own sake, has been infected with politics. According to Bastardi, the intelligentsia see new weather developments as an “incessant stream of confirmations” of global warming: “I just took out the New York Times from ten years ago, saying the reason it’s not snowing is global warming. Now you’ve got guys in the Times saying the reason it’s snowing is global warming…….”
http://www.nationalreview.com/articles/257040/bastardi-s-wager-matthew-shaffer
10
One point Bastardi makes that caught my eye is this one:
“● Fifth, today’s weather exhibits no unique patterns that require a unique explanation. They’re nothing we haven’t seen before.”
This is very relevant in the context of the 2011 Queensland floods and the significantly higher rainfall of the last few months that is now bringing flooding into Victoria which has been so dry for years. In fact it is still drizzling and chilly in Melbourne right now in the middle of summer.
To those of us who appreciate the debates here on the various factors that may or may not be significant in terms of radiative forcing, the enjoyment in part, is in the breadth of the physical concepts employed and the scientific/mathematical solutions. A bit like watching an Ashes contest with the poms.
However though this is an important battleground at the scientific level, the science is mostly too arcane or esoteric to win the argument with the average person. Further it is very unlikely that the warmist scientists, even in the face of compelling technical evidence would throw in the towel ( hopefully a few of the MSM’s more intelligent editors will do it for them ).
For that reason and because the weather data often extends back to times when atmospheric concentrations of CO2 are essentially at pre Industrial Revolution levels this is actually, in the case of Queensland, the most damning line of evidence against the claim of man made global warming and potentially in many other long term records. If on investigation and Bastardi suggests this, the same characteristics become an actuality in other records around the world it shouldn’t take long to put the AGW hypothesis to bed.
10
John Brookes @#90
“the atmosphere and ocean have established a new equilibrium … The logical conclusion is that if AGW turns out to be a real problem, we will have to actively remove CO2 from the atmosphere.”
John, there is a sound basis for expecting that, far from being a problem, raised CO2 levels may be welcome.
1. The heating effect of atmospheric CO2 is logarithmic. That is, temperature change progressively decreases as CO2 increases. As shown in Archibald’s fourth graph, the IPCC’s dramatically contrary claim is patently false. Above 280 ppm, warming is about 0.03 degC per 20 ppm CO2 increase, not 0.43 degC as proposed by IPCC.
2. Using the 0.03 degC figure, 560 ppm would correspond to a mild temperature anomaly of less than 0.42 degC. However, consider the dramatic benefits of the increase in CO2. In this most informative lecture, Free Air Carbon dioxide Experiments (FACE) are described. They showed that doubling CO2 increases the growth and yield of agricultural crops by about
-60% or more overall
-15-30% for wheat, with the larger response found under water stress
-100% increase for orange trees
-40% increase of a range of plants under “ideal” conditions
-60% response under stress (less when nutrients limited).
Furthermore, there was an interactive effect of elevated CO2 and temperature on growth and yield. That is, the beneficial effects of elevated CO2 were enhanced as temperature increased.
(FACE experiments conducted in Australia gave similar results for wheat.)
So to answer your question (finally!), it seems that CO2 related warming will not be a problem, but a godsend. Plants will love it, and the more so because of the modest rise in temperature.
Incidentally, key stages for each topic in Kimball’s lecture are at
0:12, 1:40, 3:29, 7:17, 10:40, 11:38, 12:19, 14:05 (FACE), 19:08, 24:21, 27:35, 40:06, 43:34, 46:20, 49:38 (Conclusions). Enjoy it, John!
10
Well, Graham@93, I like oranges, so you’ve sold me!
10
@Mark D -71
I’m with you on taking increased Arctic melt as a possible precursor of much colder climate.
Much of the NH suffered a very cold early winter as the frigid Arctic air went on holiday.
Lots of snow, a huge and stubborn increase in albedo in areas which have far greater levels of insolation than more northerly climes.
I’ve not seen it quantified and can’t do the sums but vast amounts of energy must have been removed from the annual planetary budget.
10
John Brookes:
Earlier in this thread I asked you to think about the subject of AGW, but your post at #90 demonstrates that my request fell on deaf ears. It says:
OK. So let us think about that.
If that paper is right
then a century or more in the future the people then (n.b. not “we”) “will have to actively remove CO2 from the atmosphere”. Making the very reasonable assumptions that at that time
(a) the total wealth of the world will be more than now
and
(b) the available technology will be more advanced than now,
then it will be cheaper for them to “gradually remove CO2 from the atmosphere and oceans” than for us to reduce our emissions of CO2. Indeed, anything we did to reduce our emissions would reduce wealth and development for use in the future.
If that paper is wrong
(it probably is) then there is no need for us to do anything and there will be no need for them to do anything.
See, John, this thinking thing is quite useful. It really is worth trying before posting nonsense.
Richard
10
Arctic sea ice underestimated by 193,000 square miles
http://www.examiner.com/weather-in-baltimore/arctic-sea-ice-underestimated-by-193-000-square-miles?do_not_mobile_redirect=1
[Percival, this is a story from February 2009] ED
10
Richard Lindzen lays it all out in clear language.
http://wattsupwiththat.com/2011/01/17/richard-lindzen-a-case-against-precipitous-climate-action/#more-31890
10
“Nor is the assumption that the earth’s climate reached a point of perfection in the middle of the twentieth century a sign of intelligence.’
That really is the assumption that can only be based on utter ignorance of Earth’s much longer weather history.
Excellent summary by Lindzen of the extent and power of natural climate variability.
10
The use of degrees Celsius in these plots is part of a blatant deception. If the temperature had been plotted in degrees Kelvin (the only correct method in the physical sciences) AGW would be a total non-event. The graphs would look completely flat. No one would be concerned by a 0.2% rise in temperature over 150 years.
10
Bulldust @ 85
It would appear that many now accept that any extreme* weather event is a result of global warming caused in turn by man’s CO2 emissions. The ignorance so on display makes me mourn for the Australian education system which must surely be dead.
* that’s assuming you think the tag “extreme” is even appropriate for things such as floods which likely occur every few decades on average.
While watching a news cast concerning a recent cold spell with extreme snowfall I made a snide comment to the effect of “Damn that global warming!” and a co worker replied to the effect of “Amen brother” I thought he was in on the joke with me but it turned out that he was serious.
I asked him how he could be serious that global warming(AGW/ACCC/whatever)could be responsible for the cold and snow. His response was “That’s what global warming is. Hotter summers and colder winters”. I asked him to reconcile the fact that ice core data shows CO2 levels lag Temperature, to which he gave me the blank stare in answer. I asked how one trace gas could be responsible for hotter temps, colder temps, more rain and less rain? I asked him to pick an effect and show me any proof whatsoever that man’s CO2 emmissions had any effect on it. He told me that he “..could show me all the proof in the world but [I] would never believe it” because I am a denier! At this point the pain between my eyes became so extreme that I was forced to stop bashing my head against the wal and walk away.
10
Richard S Courtney@96: But doesn’t the proverb say, “A stitch in time saves nine”?
Anyway, whats with your assertion that the paper is probably wrong? What makes you think this?
10
John Brookes:
At #102 you write and ask me:
I prefer science and logic to proverbs.
The paper is wrong because:
1.
Their model of the residence time of atmospheric CO2 concentration is probably wrong
(ref. Rorsch A, Courtney RS & Thoenes D, ‘The Interaction of Climate Change and the Carbon Dioxide Cycle’ E&E v16no2 (2005)).
2.
Trenberth’s “missing heat” is still missing (I have checked it is not down the back of my arm chair) and there cannot be ‘warming in the pipeline’ in the absence of stored heat.
I shall be away and out of communication for several days (possibly two weeks) so unable to reply to any responses to this post. Sorry.
Richard
10
Richard, when you get back, can you let me know how to read your paper (preferably without having to pay for it!).
Thanks,
John
10
for Graham #95
My question is about this part of your post:
The effect of every new CO2 to the atmosphere has less of an effect as time goes on due to the saturation effect of the infrared absorption in the CO2 band. This is why methane molecules (by comparison) have a larger greenhouse effect (on a per molecule basis) at this time.
The IPCC authors are well aware of this fact, so I’m not sure where those numbers you quote (.03 vs .43) are coming from.
Do you have references for them, or are they from that lecture you link to in your post?
If you don’t have time to reply to this message, I’ll get around to checking out that lecture eventually and maybe the answer will be in there for me.
10
Manwichstick @ #105
Indeed so. Quote from the text immediately following the third graph in the WUWT post:
Text immediately following the sixth graph in the WUWT post:
I took that to mean that, although natural T/CO2 is logarithmic, above 280 ppm it may be regarded as essentially linear at 0.03/20. Still strictly logarithmic, though, and hence my “about 0.03”.
There’s always time to reply to a good question, Manwichstick, though we may have fundamentally differing views (for now!).
Time well spent, you’ll discover.
10
Way, way back in 2001, Drs. Sallie Baliunas and Willie Soon pointed out that it has been long established that it was warmer in the recent past than today and that modern climate variation is well within the historical parameters:
–The great British climatologist, Hubert H. Lamb, 1965
Evidence supporting Lamb’s studies have been vastly buttressed by further generation of research…So who is really in “Denial”, or were the supporters of CAGW in the 2010 born yesterday afternoon?
http://www.heartland.org/policybot/results/9569/Recent_warming_is_not_historically_unique.html
10
I’m skeptical of the catastrophic AGW (CAGW) hypothesis only because there is literally no evidence to support it, other than that it’s a perfectly fine presupposition.
After all it’s not rocket science, as they say.
The fact that temperature rose modestly (~0.7c) in the last 100 years no more proves CAGW than the rise in chocolate bar sales over the last 100 years correlates with average waist size increases to prove CCO (Catastrophic Chocopogenic Obesity) will occur according the “standard run” computer models by the middle of the 21st century.
Just for starters the supporters of the CAGW hypothesis must show that modern temperatures are anomalous in amplitude and climate evolution is anomalously rapid, ie, outside the climate envelope set by the most recent interglacial period. But they can’t even get past the last 1,000 years. Michael Mann and the Team understood the dire necessity to prove modern climate was truly anomalous which led them to manufacture the now debunked Hockey Stick temperature reconstruction of the past 1,000 years. Their goal was to flatten past climate variations into a virtually Climatic Garden of Eden from which they could launch anomalous modern warming, the working end of the hockey stick.
Total Rubbish.
In fact modern rates of “climate change” are mild and well within recent historic parameters. For instance, it now thought that onset of the Younger Dryas took less than a decade to drop global temperatures by up to 5 degrees centigrade. Now that’s what climate historians can fairly call catastrophic climate change! If a modern Younger Dryas were to occur tomorrow civilization would truly collapse and billions would die within a few years. The AGW hypothesis offers no insight into the natural processes that caused the Younger Dryas or any other climate variation before ~1940…
http://www.newscientist.com/article/mg20427344.800-mini-ice-age-took-hold-of-europe-in-months.html
Likewise, in more recent times the Medieval Warming Period cause global temperatures to rise probably more than 2 or 3c in less than 50 years. That’s a rate of 4 to 6c a century compared to the modern rate of 0.7c last century! The decline of the Medieval Warm Period was just as rapid, particularly in northern Europe. The whole Norse culture that existed in Greenland was extinguished within a single lifetime.
The Old Norse Sagas blame Deity Induced Global Cooling (DIGC) obviously as punishment for the Sins of Mankind. Sound familiar? CAGW is simply the post-modern secular update on the Viking explanation for climate change from 1100 ad. As such the CAGW hypothesis appears to be a faith-based mythopoeia rather than an empirical hypothesis derived solely from observational evidence.
http://pages.science-skeptical.de/MWP/MedievalWarmPeriod.html
My question for John Brookes and Manwhich,—assuming we’re having an evidence-based rather than faith-based discussion here is—Why is a special one-off hypothesis required to explain our rather unexceptional modern climate when far more rapid and extreme climate variation occurred in the past at much lower levels of CO2? Doesn’t the Principle of Parsimony suggest that an ad hoc hypothesis that can account only for one minor phase shift in a particularly complex and volatile system not only useless, but more than likely, false?
http://geology.geoscienceworld.org/cgi/content/abstract/28/4/379
http://jonova.s3.amazonaws.com/graphs/lappi/vostok-last-12000-years-web.gif
http://www.co2science.org/articles/V6/N43/C2.php
http://wattsupwiththat.files.wordpress.com/2010/11/a_regional_approach_to_the_medieval_warm_period_and_the_little_ice_age.pdf
http://climatechange.umaine.edu/Research/Expeditions/2006/seals/index.html
10
Wes George@108:
A car may accelerate rapidly if allowed to roll down a hill with its engine off. That doesn’t mean I’m wrong if I say that putting your foot down hard on the accelerator will cause acceleration. Anyway, at least one of the rapid climate shifts you refer to, the younger dryas, was not a global shift, but just a local one.
Still, maybe you are right, and our current warming is entirely caused by things we don’t understand properly yet. Or maybe its caused by pumping billions of tonnes of CO2 into the atmosphere. Take your pick.
10
John,
Please provide a citation for your foul DENIALISM* of the Younger Dryas as a global phenomena. I believe the “SCIENCE IS SETTLED” (TM) on that one.
* * *
It sounds impressive to announce that we pump “billions of tons of CO2” into the atmosphere, but it’s limp attempt to mislead. What were you expecting: OMG! That’s so much pollution! It’s so BIG, Johnny!
Really now, Johnny is that all you got? I’m very disappointed. The truth is that Mother Nature adds about 220 billions tons of carbon “pollution” to the equation each year and our human addition to the climate is only 7 billion tons or about 3% of the total.
Atmospheric CO2 accounts for only ~380 molecules of air out of every million others in the atmosphere, while we mere human only provide every 2 or 3 of those 380 CO2 molecules per million per year.
Assuming you have grade school math proficiency, Johnny, you might want to get a grip on the Logarithmic Effect of CO2:
http://wattsupwiththat.com/2010/03/08/the-logarithmic-effect-of-carbon-dioxide/
Meanwhile, we’re still waiting for for an evidence-based reply to the question:
*By denialism I am hoping to subtly link your denialistism of the Younger Dryas as a Global Phenomena to the neo-Nazi apologists who attempt to deny the extermination of Jews by Nazi in various death camps of WWII occurred. I hope you aren’t offended by this ridiculous moral equivalency and simply STFU and accept the smear as part of normal civil discourse. Please don’t try to pull a Sarah Palin on us. Thank you for your submission in advance. Cheers.
10
Greetings Wes George,
I’m not sure what I want to respond to in #108 and #110.
You say so much. There is your main question:
And then there is all the stuff you surrounded it with.
Highlights include:
No evidence for CAGW
Hockey Stick
Delta temps are within normal fluctuations
example MWP
Deity Induced Global Cooling
Anthropogenic CO2 is small
Logarithmic Effect of CO2
neo-Nazi apologists
So to respond I think some sort extreme summary on my part would be required; although I’m not clear on what your definition of AGW is (as compared to CAGW).
Perhaps you can help me out on that later.
So here is my best go at trying to respond – somehow-.
Strong evidence in favour of AGW suggests CAGW may be a problem. I don’t think you can have AGW without a smoke signal of potential CAGW to be on guard for.
My feeling, AGW: mounds and mounds of evidence to support it -CAGW: have to wait and see – need more time to assess.
My other observation about your question, CO2 and greenhouse atmospheric physics is not a one-off, but a consistent explanation, not only for the recent warming, but the changes in the earth’s climate over geologic time. It also is applied to other planets, both in our solar system and the new ones that are being discovered.
10
Manwichstick @111,
I’m still looking for that strong evidence in favor of AGW. Where is it? You can argue the fine points of this or that opinion. But that’s all they boil down to, an opinion. Actual evidence isn’t there.
Let’s start with evidence that CO2 is causing or even can cause warming. CO2 concentration has been steadily rising, yet temperatures have not. So thus far it’s all theory — good theory perhaps but still just theory that hasn’t been borne out in reality. Yet from that I’m supposed to believe catastrophe is just around the corner. Sorry, but no it’s not. It’s in someone’s imagination.
10
Thanks for your honest reply, Manwhich.
You make no sly attempt to misrepresent data like John did with his “billions of tons” of man-made CO2 remark.
You honestly admit that you simply have a “feeling” that “mounds and mounds of evidence” support AGW. I’m curious to know what particular bit of evidence you find so compelling? Or is it the overarching “consensus cloud” that makes you feel AGW must be true?
Then you say that at least the basic physics of atmospheric CO2 can be universally applied to past climate, even the climates of other planets. But no one is challenging basic atmospheric physics. One can question the AGW hypothesis without doubting chemistry or physics 101. I said AGW has nothing USEFUL to say about past climates, not physics.
Nevertheless, as a hypothesis, AGW does have IMPLICATIONS for past climate history. This is very interesting, because Karl Popper and other philosophers of the scientific method would have us TEST hypotheses not only on their direct PREDICTIONS, but also on their IMPLICATIONS for observations often gathered long before the hypothesis was made.
In this case, the AGW hypothesis implies that modern temperatures MUST be warmer than recent past temperatures because CO2 is much higher. Yet we can show that temperatures were as high or higher than today as recently as the MWP, about 1,000 years ago, with CO2 levels much, much lower than today. See my links @ comment 108.
Since the implications the AGW hypothesis has for past climate have been falsified—i.e. past climate has managed to produce temperatures as high as today without added anthropogenic CO2, then we must assume–in the normal course of applying the rules of the scientific method–that the AGW hypothesis as a whole is in error, because it has failed to explain fundamental observational evidence.
The above is merely my personal favourite way in which the AGW hypothesis fails as empirical science, because it is so easy to understand. Jo’s blog is filled with other important observationally confirmed falsifications of the AGW hypothesis.
So, Manwhich, you are welcome to your “feeling” about AGW, but be careful not to delude yourself that a feeling is remotely same quality of “knowledge” as evidence-based testing of a scientific hypothesis.
10
What’s most interesting about true believers is how they selectively jettison the common sense logic of inquiry only in their specific realm of faith. Otherwise, these people are perfectly capable of exercising rational decision making in every day life. After all if they made the same zombie calibrations of reality they do in the case of their chosen faith in other aspects of their lives, say on the job or while driving around town, their genes would have been eliminated from the pool long ago.
If I make a statement, say, “All automobiles are built by Ford Motors.” And then someone points out that Toyota builds cars too, it’s not rational to claim that the statement “All automobiles are built by Ford Motors” is still true because there is “mounds and mounds” of evidence supporting that statement.
The single fact that Toyota builds cars too, means that no matter how many cars Ford builds, the statement “All automobiles are built by Ford Motors” is totally false. All true believers can grasp that common sense calculation just like any other normal person.
But when we come to the AGW hypothesis, a psychological compartmentalize seems to shield natural reasoning abilities and curiosity from facts that are otherwise in plain view. No matter how much evidence supports the contention that anthropogenic CO2 is a primary forcing agent on the Earth’s climate, a single hard observation that it is not so invalidates the entire proposition. It’s the same logic as the Ford automobile analogy, yet in the realm of AGW rational methods of inquiry are suspended by the true believer.
Jo’s blog and dozen of others have documented dozens and dozens of serious empirical observations that the AGW hypothesis cannot account for. Yet, we daily encounter otherwise perfectly rational people who in effect claim “All automobiles are built by Ford,” even after we pointed out that Holden, GM, Toyota, BMW, Mercedes, Volvo, Ascari, Aston Martin, Bentley, Daimler, Chrysler, Lotus, Vauxhall, Triumph, Daihatsu, Honda and many others also manufacture automobiles.
The evidence is that for AGW true believers the bottom line in the climate debate is not about the evidence at all, but something else, something meta-political, much more deeply rooted in evolutionary psychological, the nature of decision making, game theory, tribal loyalties and cultural adaptation then in rational curiosity about how nature really works.
10
Wes, Wes, Wes. There is no doubt that you are much better at being insulting than I am. Have a gold star!
This would be a good argument, if everything else was constant. Solar output, orbital eccentricity and orientation, sulphate aerosols, regular climate cycles, ice cover, etc etc would all have to be held constant before we could draw your conclusion above. Nice try though.
What would be a good argument by your side is to explain convincingly why we are warming, given that the main natural factor, the sun, is not very active.
Anyhow, as I’ve said before, I’m convinced enough about AGW to want action, but believe strongly that better understanding is needed. Back in 1989 or so, the much derided James Hansen made a few predictions of future temperature based on AGW. So far these predictions are surprisingly good. If his predictions keep being on track for another 20 years, then it will be beyond doubt in my mind.
10
Wes:
It will come as no surprise to you that, as usual, when I said “billions of tonnes”, I was simply guessing. So now, sigh, I have to check and defend myself. Wikipedia says annual emissions of carbon from the burning of fossil fuels are 6 x 10^12kg, which is 6 billion tonnes. So how was my original guess a “sly attempt to misrepresent data”? Or is Wikipedia in on the scam as well?
10
Let me see if I can follow this line of “reasoning”:
1) You aren’t worried about climate science’s inability to explain past climate changes, because many other things might have been acting — you don’t know what.
2) Human emissions are responsible for current climate change (either way, apparently) because you can’t think of anything else that would cause it. (Argument from Ignorance.)
3) Anyone who disagrees with you (and doesn’t want to disrupt the World’s economy) must have an alternate explanation that you agree with. (A tough task, given your fast and loose use of logic — you will only believe what you want.)
How about this argument:
1) The climate has been always changing; We can guess at some of the reasons, but others are unknown.
2) Anyone who claims to have a correct theory, needs to prove it. A good start would be to demonstrate that the theory has predictive skill. So far, AGW has no demonstrated predictive skill. Warmists have brushed off the spectacular failures of AGW models to predict climate a year ahead as unimportant, and not indicative of their skill at predicting decades ahead — this also needs to be proven. (The claim that failure should be taken as proof of ability is bizarre, to say the least.)
3) The proponents of the AGW hypothesis have been caught manipulating data, conspiring to destroy raw data and illegally keep it from critics, attempting to suppress debate, etc. This does not give one a warm feeling about their honesty, motives, or objectivity. Certainly, they don’t seem like people you should trust to make important decisions without oversight.
It is not up to the critics of AGW to prove it wrong. (They, after all, are not advocating for global tyranny and surrender of liberty to unelected authorities.) It is, instead, up to the proponents of CAGW to prove their case. So far, they have only proven their dishonesty.
For an interesting look at what is done to the data to mold it to the pre-determined result required by AGW, take a look at this graph and site (courtesy of Cohenite). I already knew the data “adjustments” were bogus, since there is no other way to explain why a perfectly-sited station would have its raw data adjusted upwards to match a site which has many spurious heat sources corrupting its data, but Data Analytics’ site shows just how bad the manipulation really is.
10
OK, BobC, if the temperature record is being fudged, lets use the satellite record, I’m pretty sure that isn’t being fudged.
And lastly, 2010 wasn’t the hottest year in the last 300 years. Within the error bounds of the various schemes of measuring the world’s temperature, it can’t be separated from some other years. So lets just say equal hottest. And now that La Nina has taken hold, you can rest assured that its unlikely that 2011 will be hotter.
10
I haven’t heard any accusations of misbehavior, so you are probably right. Unfortunately, the satellite record is short, and doesn’t measure the same thing as ground thermometers, so it’s hard to draw any conclusions from the data yet. From my experience with remote sensing, there is always a calibration issue. If, in the future, we start seeing multiple “recalibrations” of the satellite data, it should arouse our suspicions and scrutiny.
(BTY: Here’s another graph and site analyzing what NASA-GISS did to get a warming trend in Kathmandu — They “adjusted” a 5 deg/century ramp into the data — during a population increase that should have required an adjustment in the opposite direction due to UHI.)
Actually understanding the climate is an incredibly difficult problem. Just knowing what the temperatures were historically is a basic need (which is why the data manipulation strikes at the heart of this science). Knowing what the hottest year is doesn’t tell you what theories are right — they also have to explain the past and demonstrate predictive skill about the future. I have friends who have spent their careers on small parts of this problem. This extremely important work has currently been hijacked by some in politics as an excuse to vastly expand their power, without the inconvenience of actually getting the public’s approval. (Perhaps this explains why dictatorships like China aren’t so interested — they already have absolute power.) Amazingly, President Dwight Eisenhower warned about this in his farewell speech almost exactly 50 years ago (Jan 17, 1961):
If this were actually about science, and not a political power grab, then evidence and competition between alternate theories would dominate the conversation. Instead, we have the claim that the AGW theory is complete and unassailable. People who question it are vilified and threatened — scientists’ careers are ruined. Promising lines of research; such as Svensmark’s investigation of the relationship between the Solar magnetic field, cosmic ray flux in the lower atmosphere, clouds and climate (link); the related work linking Earth’s albedo and surface temperature (link); and the discovery of predictive (but still poorly explained) links between easily observed phenomena (the Southern Oscillation Index) and future climate (this site) are ignored, derided, and (attempted to be) suppressed — all because they don’t agree that Anthropogenic CO2 is the all-important element.
Instead of science, we have a collection of “holy” models (“Play Station Science”), blaming everything on Human-produced CO2. None of these models have demonstrated predictive skill (they predicted the last three winters in the UK were going to be very mild, and snow would be rare to nonexistent), nor do they have any explanatory power about past climate (> 100ya).
Additionally, most of these models are falsified by simple, direct measurements (comments 76, 84 & 90) of CO2’s behavior in the atmosphere. This is uniformly ignored (or, occasionally, hand-waved away).
One had to pretend to believe Lysenkoism (in the Soviet Union under Stalin) — AGW is just as bogus and will be looked upon as a bad joke in the future. Because it is created by politics, it will also have to die by politics. This is part of the explanation for the electoral revolution in the US last November (which, I predict, has just begun).
10
http://thetruthpeddler.wordpress.com/2011/01/25/latest-data-confirms-a-global-cooling-trend/
10
#120
I’m sorry, but that’s a misrepresentation of the data. The dataset they have used is the rate of change of temperature, not the absolute temperature.
All that graph demonstrates is that the rate of increase of temperature has marginally slowed over the last 10 years. We won’t know if this is significant until the next few years pass. Whilst it does go against the IPCC picture of temperature increasing quickly, that doesn’t mean the over temperature rise won’t continue.
See http://www.cru.uea.ac.uk/cru/data/temperature/ and http://www.metoffice.gov.uk/climate-change/guide/science/monitoring/global
10
Pete @ 121
It also means that the predictions of what rising Co2 will cause are flat wrong.
Thanks for the CRU link. That is precious. By the way, arent the graphs in that CRU link anomalies? What is the basis for “normal”?
10
#122
No, it simply means that CO2 volume definitely isn’t the sole factor. It doesn’t rule it out altogether. As many have pointed out, the question of abnormal temperature rise is less in doubt than CO2 being the sole cause.
As for the baseline, I have no idea. I searched the page (and then the Internet) for an explanation, but failed to find one… Who knows? Maybe I’ll email the MET office.
10
Pete,
I didn’t say “rule out all together” I said the predictions are flat wrong. The modeling results that people use to make those predictions are wrong, the models are wrong. This means that the “consensus” is wrong, that the “well understood” science has not so well understood flaws.
As for the baseline, I think you’ll find it is derived from an “average” global temperature through a period circa 1960 to 199X ostensibly a period long enough to be called “climate” and prior to a period that Co2 would be a significant influence. The obvious question is who says that was “normal”. If you do e-mail the MET, ask them that question too. I’d like to hear what they say.
10
Hi Mark D #124
Your first instinct when you find yourself making absolute statements such as the one above should be to stop and ask yourself, “why am I using absolutist language?”
On of the many lessons one can take away from marriage counciling is to avoid “absolute” language because it is by default inflammatory, and secondly, most certainly wrong.
“Why do you never empty the dishwasher?”, for example.
It upsets others because it is emotionally charged, and it is very likely false. I empty the dishwasher a lot.
Many climate models have done a great job of of predicting various aspects of the 20th century climate up until today.
10
Actually, current climate models are not quite as good as just assuming that whatever the average behavior of the past is, it will continue. (See here for a quantitative analysis.)
It is not too strong a characterization of current climate models to say that they have no demonstrated predictive skill that is better than chance. Hence, any future crisis predicted by these models is simply a guess.
I could guess that an Extinction Level Event asteroid strike will occur within 25 years, and therefore all of Mankind’s resources should be diverted to space colonization and space defense. Before turning the world’s economy and societies upside down to accommodate this, however, many people would like to see some evidence beyond my guess. I could reply that no one can prove my guess is wrong, and therefore everyone has to do what I say — but, while true, that probably wouldn’t get much support.
There are, in fact, an infinite number of possible crises that could be guessed at — which should we respond to? By choosing a randomly guessed crisis to address, we have a nearly 100% chance of responding to a crisis that doesn’t happen. Why not respond to events that occur or can be reliably predicted? That way we minimize the chance of wasting our resources on false alarms, and being unable to adequately respond when a real crisis occurs.
There is another level here: Even if we had climate models that were 100% correct, that is, models without any arbitrary parameters, that modeled everything from first principles (certainly not the current situation), they still might be unable to predict the future climate. There is much evidence that weather phenomena has a significant chaotic component (and, by extension, climate — since climate is simply a sequence of weather events).
One characteristic of chaotic systems is that they are extremely sensitive to initial conditions — a trivial change in initial conditions eventually results in a completely different outcome. Examples of chaotic systems are weakly coupled pendulums and all but a handful of multi-body gravitational problems. This is why you can’t show that the Solar system is stable (a problem that bothered Newton enormously) — there is a non-zero chance that the Earth will sometime be ejected from the solar system, for example.
The first scientist to numerically model climate, Edward Lorenz, coined the term “Butterfly Effect” to illustrate the problem: If you have a perfect model of the climate, and your knowledge of the initial conditions to start it are exact except for the flap of a single butterfly’s wing, then the model will eventually diverge completely from reality.
Of course, our knowledge of the climate at any one time is very approximate, and hence the best models diverge rapidly from reality. Currently, climate models are unable to model climate even one year in advance — see the wildly inaccurate predictions of the UK’s MET about the last 3 winters.
If there is no evidence to believe that climate models will ever be able to predict the weather or climate beyond a short time horizon, what use are they? The original purpose of Global Circulation Models (GCMs) is to help us understand the climate. For example, if a GCM run shows the same kind of kinks in the jet stream that result in arctic cold fronts at moderate latitudes, then that is evidence that the model is working like the climate, even if it can’t predict it long term. The model can be examined for measurable precursors to the kinking that, if verified, could help forecasters extent their prediction horizons.
It is, however, unequivocally wrong to claim that GCMs can predict the climate for years ahead, when there is literally no evidence that they can do so.
10
Manwhichstick says at 125:
The 20th century up until today is a prediction?
.
.
.
My “first instinct” would be to wonder why you have not added any cogent argument to what I said.
I’ve been married for over a quarter century and have, so far, no need for lessons or counciling. Perhaps you need a lesson in how truths support absolutism. However, besides that, I am old enough to realize that I don’t have to play in the world of political correctness and therefor I am not bothered in the least that you think my absolutism is inflammatory.
10
Manwichstick,
OK then, you should be able to tell me:
1. What aspect of the 20th Century climate was predicted up to the level of “great” (which you do not define)?
2. What model predicted it?
3. When it was predicted vs. when it happened?
From what you said those seem like things you should be able to answer so I thought I’d ask.
10
I wonder if people are aware of how Hansen makes the world look warmer in his graphs:
Go to Nasa’s GISS global surface temperature page:
http://data.giss.nasa.gov/gistemp/maps/
Change the smoothing radius to 250km and click make map. It takes a little while for the map to appear. Note how much of the map is missing data (grey areas) and how little warming there is.
Now go back and do it again except change the smoothing radius to 1200km this time. The red parts (warming) are a result of Hansen’s assumptions & resulting adjustments.
Conclusion: Hansen and the GISS’s surface temperature records are a joke. The GISS satellite record in this article isn’t too far off ridiculous when compared to the other satellite records, even though it’s apparent that the boys at GISS have tried their hardest to make 2010 the hottest year. The main problem with the GISS surface record though, is that their own satellite record disagrees – no wonder they don’t like trumpeting that one around, although it does drive the AGW crowd almost as nuts as the missing hot spot when mentioned in a debate.
10
[…] warming started before our emissions became significant, and at least since measurements began, the trend hasn’t changed and the models don’t know why. We also discussed this point in the here too, with other […]
10
[…] warming started before our emissions became significant, and at least since measurements began, thetrend hasn’t changed and the models don’t know why. We also discussed this point in the here too, with other […]
10
[…] […]
10