By Jo Nova
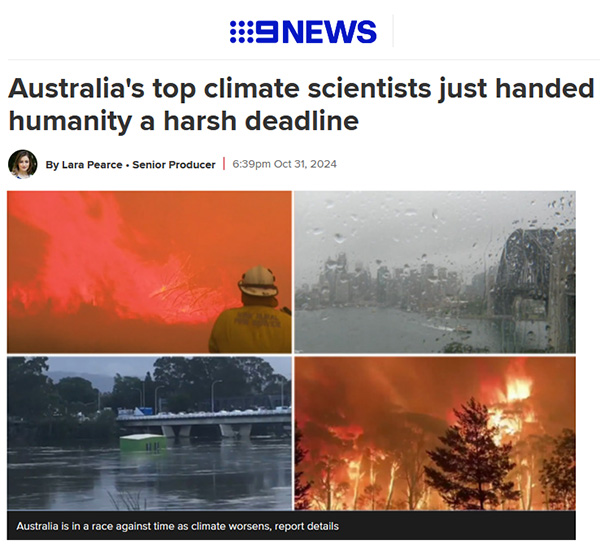
Brave scientists at the CSIRO and BoM have dug hard through the sacred Arc of the Climate Covenant, CMIP-6, to discover the horrible truth that we only have seven years (just seven!) until we pass through the sanctified Target-of-Paris on Halloween of 2031.
Channel Nine shares this “harsh deadline for humanity” and tells us the chance to limit global warming to the Paris Agreement goal of 1.5 degrees “will expire” then, like 2 for 1 sale coupon. They don’t quite explain what happens on November 1st, 2031 — but most people will assume it’s just like what happened after Prince Charles and Al Gore and the UN said we only had ten years to go (which was nothing).
But the horror show continues, not in our climate, but in our science: where the work of past scientists is deleted, and dubious datasets get adjusted with secret algorithms and thermometers near incinerators and over hot bitumen carparks that may be 1,000 kilometers away. The CSIRO-BOM Blob have massaged Australia’s temperature record so it can fit their favourite climate model. Dishonestly, both institutions hide the heat of the Federation Drought, where places all across Australia recorded temperatures over 50 degrees in 1896. BoM and CSIRO delete the cooling trend their own experts recorded from 1900 to 1950 in Australia. (Deacon et al).
A carefully curated curve. BOM CSIRO State of the Climate 2024.
The BOM and CSIRO pretend the temperatures are accurate in the graph above. They don’t tell Australians that they keep adjusting the data, even a hundred years after it happened. Some poor towns didn’t know they were two degrees colder in World War I until the BoM “discovered” that in 2014. The people of Marble Bar thought they had the hottest heatwave in world history in 1923 until the BOM traveled back in time to delete it, I mean “correct it”. Temperatures in 1910 have fallen 22 degrees Fahrenheit in the last 10 years.
At the current rate of decline, the 1920 miners of Marble Bar will be in an ice age by the end of the century.
marble bar very hot day trends
The irony is that the BOM ignore the hot temperatures of the 1800’s because they were not in standardized modern Stevenson screens, yet the BOM is happy to take those lauded Stevenson screen measurements from 1920 and drop them in a high speed homogenization-blender to adjust them by as much as 2 degrees.
So the BOM can “adjust” the data to get any trend they want. Then there’s the added heat of a million tons of concrete and brick keeping our cities warm. And on top of that scientific hamburger, thermometers boxes shrank from 230 litres to 60 litres, and glass instruments became electronic ones. They don’t mention that their super accurate new gizmos can pick up brief changes in temperature that the old glass ones can’t. And possibly they can pick up the airport radars too.
Maximum record temperatures may be a one-second-record, literally there and gone in a moment, and if it was radar interference, not even there at all.
When asked, the BOM say they have calibrated and tested the different thermometers side by side, to show they are comparable, but they won’t release the data. As if the thermometer readings at Canberra airport are a national security issue.
They also don’t mention that scientists in Australia were reporting that Australia was cooling from the 1890s to 1952. (Deacon et al) The ghastly heat of 1896, the Federation Drought, and the 50C record temperatures all over Australia all go down the memory hole.
Lest we forget, those historic heatwaves.
Historic heatwaves. 50 degree temperatures were everywhere, right across Australia in the 1800s and 1900s.|
Not surprisingly, after we adjust all the records, we find extreme heat events are increasing
And this is the shocking graph the BOM-CSIRO blob gave us in 2024:
But ten years ago the BOM showed Australians a different graph, one which looked like this, til they took it off their own website. And there is bound to be some excuse to justify it. A different permutation or combination of variables, an older dataset, some plausible deniability.
But the fact remains, that the BOM-CSIRO-blob are not trying to give Australians the whole truth and nothing but the truth:
Number of very hot days in Australia up to 2016. It was on the BOM site…
Reading the tea-leaves on rain in Australia
By selecting some contrived permutation the BOM-CSIRO-Blob can create the illusion that something unusual is happening. Here, they show the April to October rainfall in one particular part of the country as if this has some special meaning. (Their climate models fail on rainfall trends nearly universally). The Blob can cherry pick permutations until they find something. But here, even the best trend they can get doesn’t resemble our CO2 emissions. Why was the winter rain almost as low in 1940? The BOM don’t know. They could make up some reason post hoc, but they can’t predict it.
Rainfall decline in SE Australia. BOM CSIRO State of the Climate 2024.
If the BOM-CSIRO-blob wanted, they could show Sydney-siders the total rainfall record for the last 130 years. But they can’t because it would be obvious to everyone that it has nothing to do with CO2. It could just be noise in the system, oceanic oscillation, or cycles controlled by the sun.
This (below) was the total rainfall in Sydney from 1840 to 2019, and the total number of rainy days, the peak amount of rain that falls in a single day and the intensity of the downpours. Why isn’t it in the State of the Climate? Why haven’t the BOM updated this graph? (From the Ashcroft paper of 2019).
Rainfall trends, cycles, Australia, Sydney, Graph, 2019, 1840 – 2020..| Abbreviations: Rainday counts (RD), monthly rainfall totals (Rtot), and highest daily rainfall (Rx1day). The Simple Daily Intensity Index (SDII): the amount of rainfall received divided by the number of raindays recorded over a month and year.
The exact same pattern is visible, by the way, in rainfall records from Melbourne and Adelaide too. But almost no one in Australia would know that. The ignorance isn’t an accident.
Thank the BOM. Thank the CSIRO. Thank the ABC.
REFERENCES
LindenAshcroftabDavid J.KarolyacAndrew J.Dowdyb(2019) Historical extreme rainfall events in southeastern Australia, Weather and Climate Extremes Available online 10 May 2019, 100210
Deacon, E.L. (1952) Climatic Change in Australia since 1880, Australian Journal of Physics, Volume 6, Pages 209-218. [PDF]
State of The Climate 2024 can be found on the CSIRO and Bureau of Meteorology websites.
State of the Climate 2022, Bureau of Meteorology
State of the Climate 2022, CSIRO
State of the Climate Report CSIRO 2014. CSIRO
Previous State of the Climate Reports, CSIRO
And even more droughts and trends graphs here.