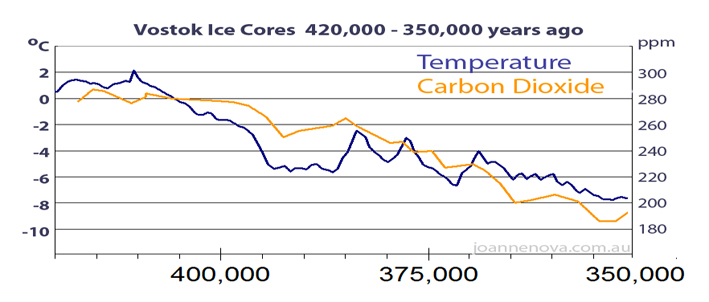
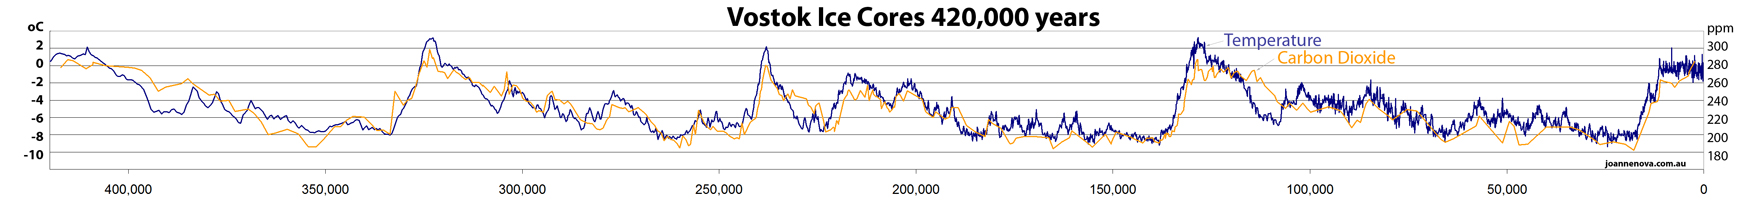
Carbon dioxide follows temperature in the Vostok Ice Cores
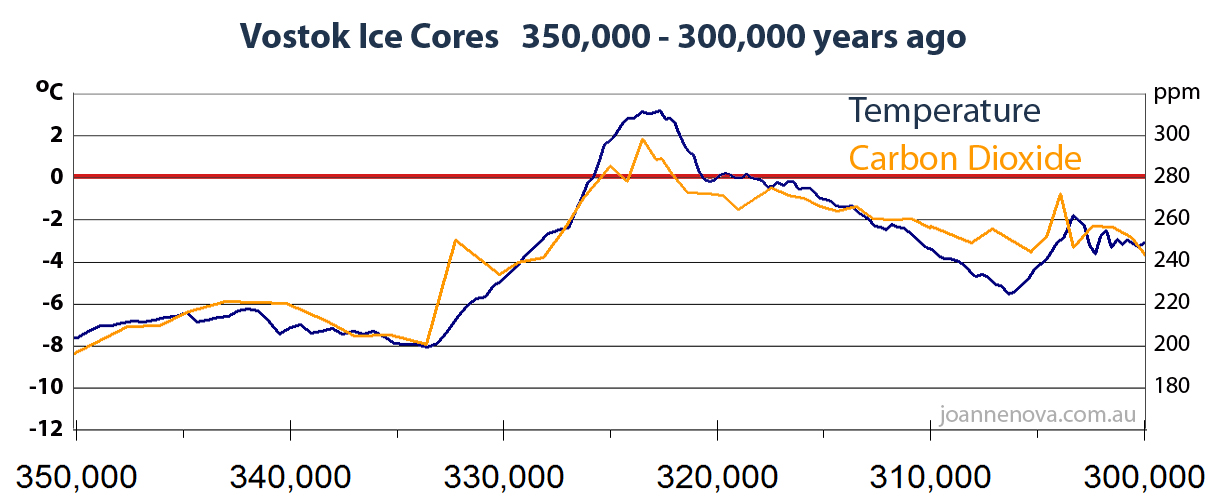
In the 1990’s the classic Vostok ice core graph showed temperature and carbon in lock step moving at the same time. It made sense to worry that carbon dioxide did influence temperature. But by 2003 new data came in and it was clear that carbon lagged behind temperature. The link was back to front. Temperatures appear to control carbon, and while it’s possible that carbon also influences temperature these ice cores don’t show much evidence of that. After temperatures rise, on average it takes 800 years before carbon starts to move. The extraordinary thing is that the lag is well accepted by climatologists, yet virtually unknown outside these circles. The fact that temperature leads is not controversial. It’s relevance is debated.
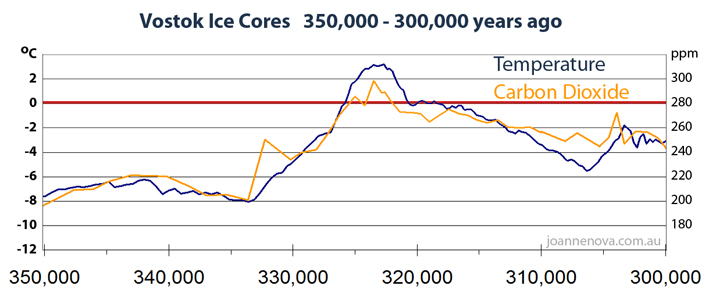
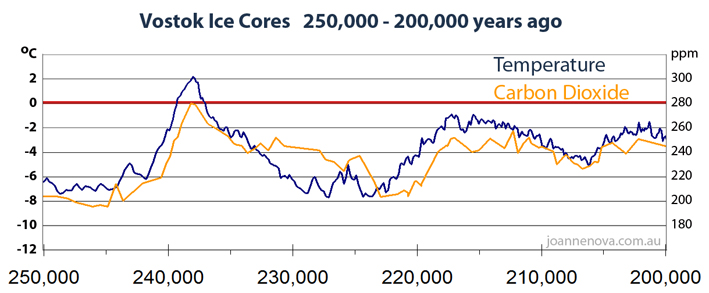
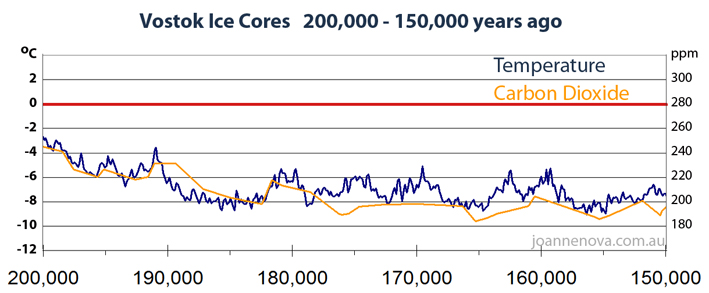
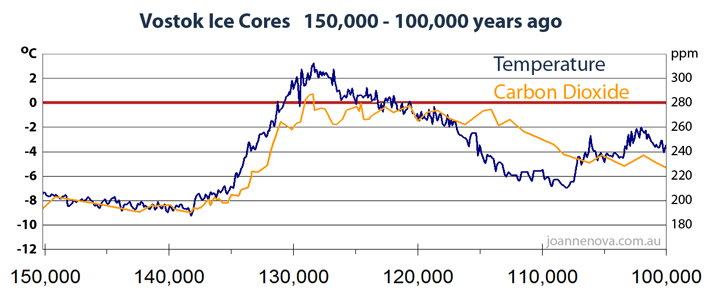
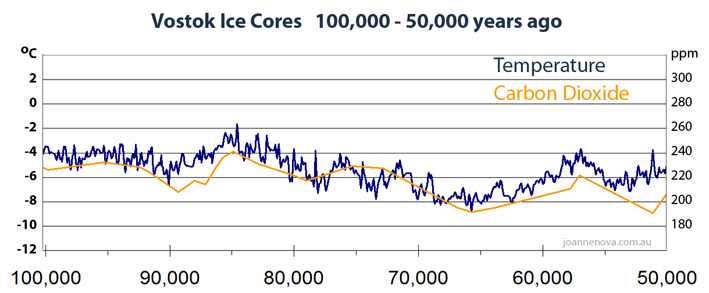
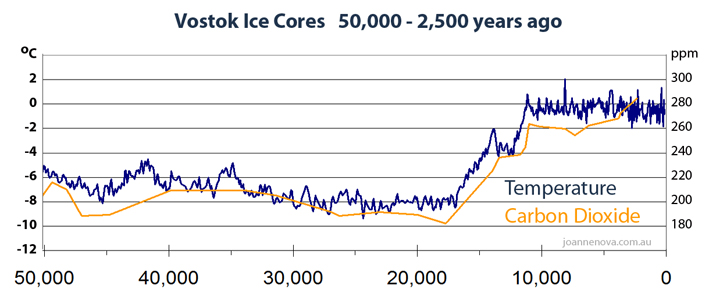
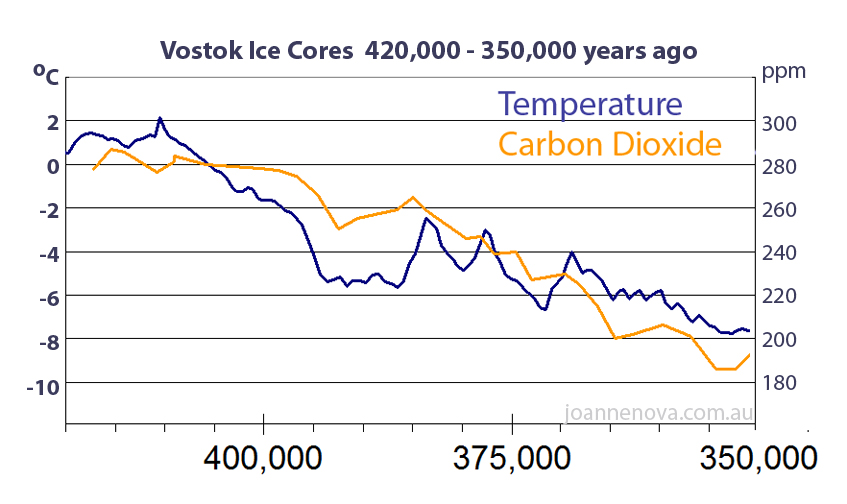
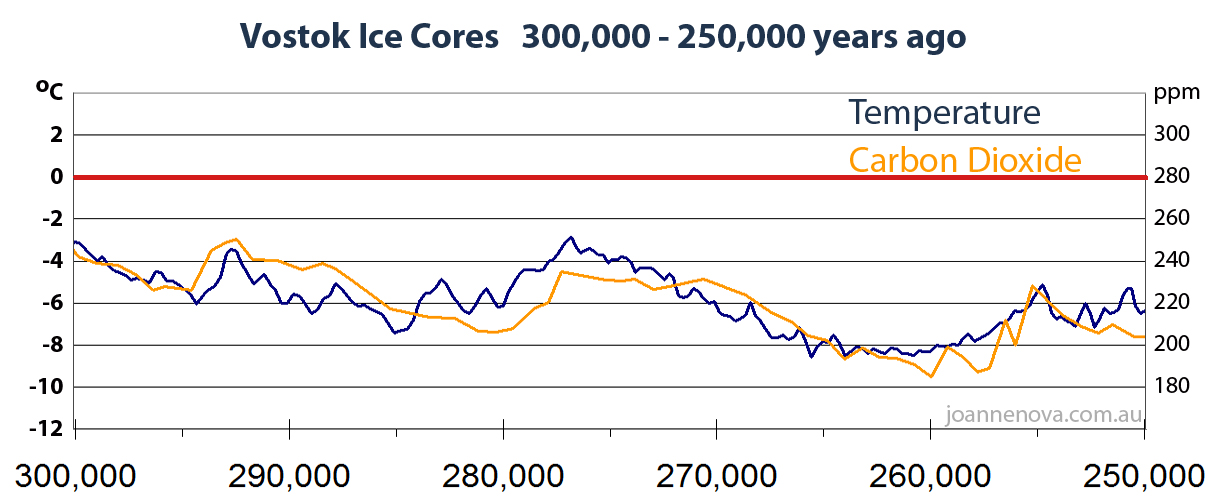
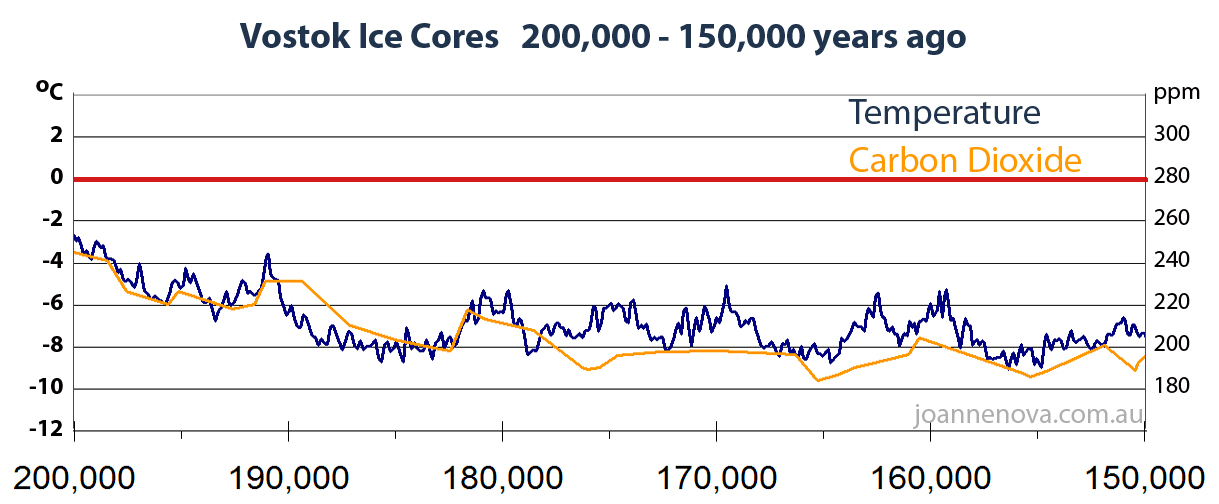
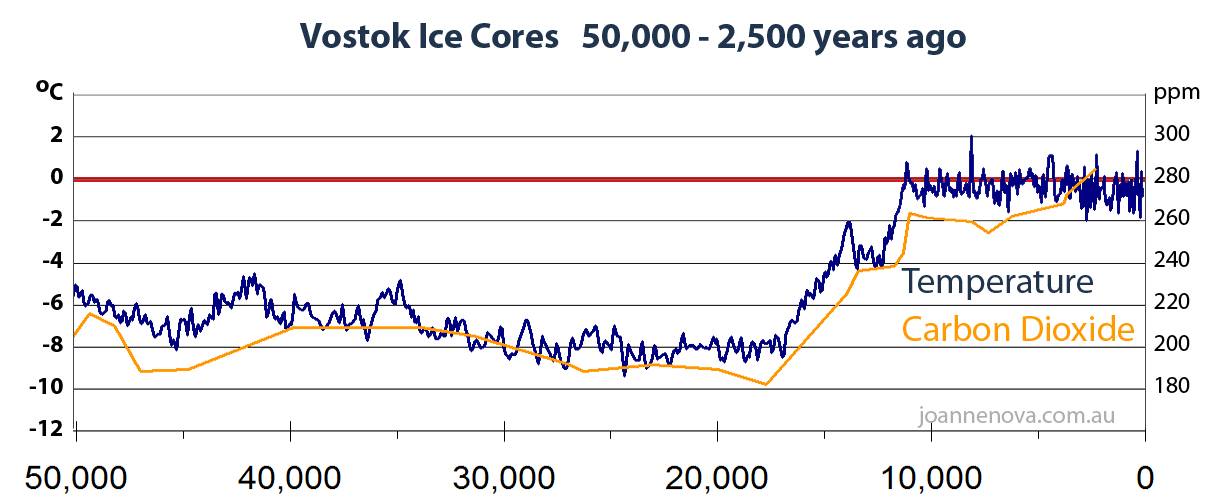
It’s impossible to see a lag of centuries on a graph that covers half a million years so I have regraphed the data from the original sources, CO2 Data here and Temperature data here (Petit 1999), and scaled the graphs out so that the lag is visible to the naked eye. What follows is the complete set from 420,000 years to 5,000 years before the present.
- NOTE 1: What really matters here are the turning points, not the absolute levels.
- NOTE 2: The carbon data is unfortunately far less detailed than the temperature data.
Beware of making conclusions about turning points
or lags when only one single point may be involved. - NOTE 3: The graph which illustrates the lag the best, and also has the most carbon data
is 150,000-100,000 years ago.
The bottom line is that rising temperatures cause carbon levels to rise. Carbon may still influence temperatures, but these ice cores are neutral on that. If both factors caused each other to rise significantly, positive feedback would become exponential. We’d see a runaway greenhouse effect. It hasn’t happened. Some other factor is more important than carbon dioxide, or carbon’s role is minor.
Permission for use: These images are available for media and non-profit use. As a courtesy please email me “joanne AT joannenova.com.au” (replace the ‘AT’ with ‘@’). Thank you. There are also larger files available in tif format for printing. Click on the link to the right hand side of each graph.
Note: The temperatures here are measured in relation to the present temperature. In other words, most of the time for the last million years it’s been much colder.
MORE INFO
Other posts on Vostok Ice Cores.
- Carbon rises 800 years after temperatures
- The big picture: 65 million years of temperature swings
- Ice Core evidence — where is carbon’s “major effect”?
- Where is the evidence for the dangerous positive feedback in the Vostok Ice Cores?
- See Palisad for the most informative detailed graphics on what the Vostok and Dome Ice cores mean and why they strongly mathematically suggest CO2 follows temperatures and has little effect on them.This is what you need to see to understand “feedback” or the postulated “amplification”.
- A colorful but informative and link-filled presentation is here.
- Excellent summary of the papers on the lag… at CO2 science.
REFERENCES
- Petit et all 1999 — analysed 420,000 years of Vostok, and found that as the world cools into an ice age, the delay before carbon falls is several thousand years.
- Fischer et al 1999 — described a lag of 600 plus or minus 400 years as the world warms up from an ice age.
- Monnin et al 2001 – looked at Dome Concordia (also in Antarctica) – and found a delay on the recent rise out of the last major ice age to be 800 ± 600
- Mudelsee (2001) – Over the full 420,000 year Vostok history Co2 variations lag temperature by 1,300 years ± 1000.
- Caillon et al 2003 analysed the Vostok data and found a lag (where CO2 rises after temperature) of 800 ± 200 years.
- NOAA data on Antarctic Ice Cores: https://www.ncdc.noaa.gov/paleo-search/reports/location?dataTypeId=7&search=true
 |
||
| Click here for a larger TIFF image…or.. JPG image | ||
 |
||
| Click here for a larger TIFF image…or.. JPG image | ||
 |
||
| Click here for a larger TIFF image…or.. JPG image | ||
 |
||
| Click here for a larger TIFF image…or.. JPG image | ||
 |
||
| Click here for a larger TIFF image…or.. JPG image | ||
 |
||
| Click here for a larger TIFF image…or.. JPG image | ||
 |
||
| Click here for a larger TIFF image…or.. JPG image | ||
 |
||
| Click here for a larger TIFF image…or.. JPG image | ||
Update: Aug 18 2013 adding page links.
_____________________________________
Last Update: Oct 18 2020: The original data was stored at CDIAC: here http://cdiac.ornl.gov/ftp/trends/temp/vostok/vostok.1999.temp.dat and http://cdiac.ornl.gov/ftp/trends/co2/vostok.icecore.co2. But both these links are now defunct.