By Jo Nova
It’s just another scientific study doomed to disappear
A Norwegian whaler paid for 2,200 aerial photos of East Antarctica in 1937. Since then humankind has emitted 91% of all the emissions we’ve ever produced and the world is facing an extinction level catastrophe and yet satellite photos show this 2,000 kilometer long section of East Antarctica hasn’t changed — or at least, not in any way related to our uptake of coal power or planes, trains, airconditioners and cars. Basically the human race emitted 1,600 billion tons of carbon dioxide which was supposed to warm the poles twice as fast as anywhere else, but there is still nothing to see here.
Belated Thanks to Tallbloke for the first article I saw on this.
2,000 km of Antarctic ice-covered coastline has been stable for 85 years
Using hundreds of old aerial photographs dating back to 1937, combined with modern computer technology, the researchers have tracked the evolution of glaciers in East Antarctica. The area covers approximately 2,000 kilometers of coastline and contains as much ice as the entire Greenland Ice Sheet.
Compared to modern data, the ice flow speeds are unchanged. While some glaciers have thinned over shorter intermediate periods of 10–20 years, they have remained stable or grown slightly in the long term, indicating a system in balance.
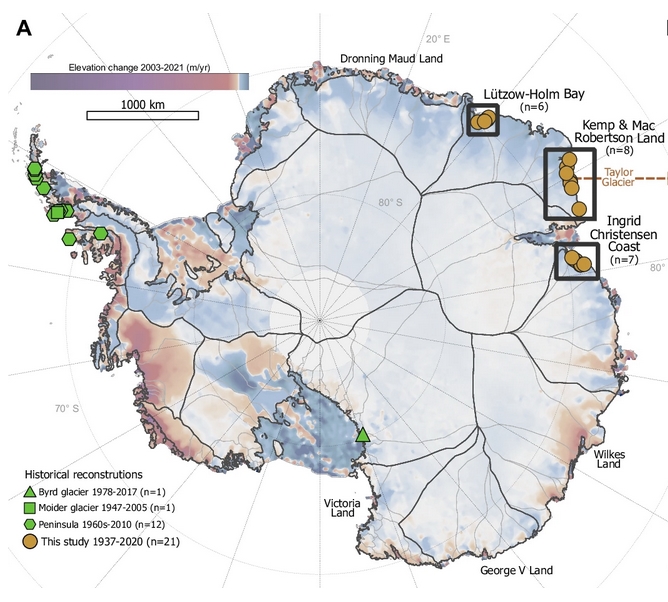
A Existing historical glacier reconstructions (Byrd11, Moider32 and Peninsula31) and glaciers included in this study (frontal reconstructions n = 21, elevation reconstructions n = 12, velocity reconstructions n = 4), overlaid on 2003–2021 Antarctic annual elevation change from Smith et al5., with MEaSUREs basin72
Imagine the fuss if these old photos showed a glacier melting?
Most of the images used in the study were captured during a 1937 expedition organized and paid for by Norwegian whaler Lars Christensen. The mission aimed to produce the first maps of this part of East Antarctica, but the maps were never published due to the German invasion of Norway. Since then, the images have been stored at the Norwegian Polar Institute in Tromsø and forgotten.
When the researchers from the University of Copenhagen read about the expedition, they realized that valuable images were likely hidden in an archive in Norway. They traveled to Tromsø and reviewed all 2,200 images taken during the expedition. They supplemented the Norwegian aerial images with images of the same glaciers from Australian surveys conducted between 1950 and 1974.
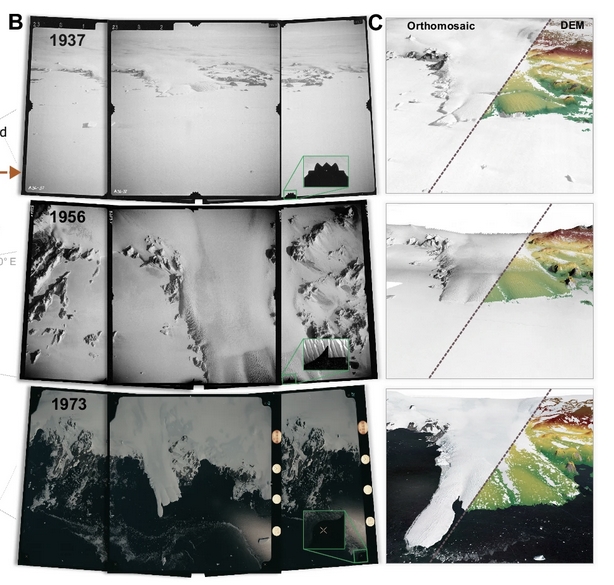
B Taylor glacier in 1937, 1956, and 1973 as captured in the aerial images. Close up shows the different types of fiducial marks used for standardizing the internal image geometry. C Produced digital elevation models (DEM) overlain on orthomosaics generated from interpolated DEMs. For the productions of the 1956 DEM and orthomosaic we included additional oblique images (not included here) as the glacier was photographed with a trimetrogon camera setup.
During the last few decades, several sectors in Antarctica have transitioned from glacial mass balance equilibrium to mass loss. In order to determine if recent trends exceed the scale of natural variability, long-term observations are vital. Here we explore the earliest, large-scale, aerial image archive of Antarctica to provide a unique record of 21 outlet glaciers along the coastline of East Antarctica since the 1930s. In Lützow-Holm Bay, our results reveal constant ice surface elevations since the 1930s, and indications of a weakening of local land-fast sea-ice conditions. Along the coastline of Kemp and Mac Robertson, and Ingrid Christensen Coast, we observe a long-term moderate thickening of the glaciers since 1937 and 1960 with periodic thinning and decadal variability. In all regions, the long-term changes in ice thickness correspond with the trends in snowfall since 1940. Our results demonstrate that the stability and growth in ice elevations observed in terrestrial basins over the past few decades are part of a trend spanning at least a century, and highlight the importance of understanding long-term changes when interpreting current dynamics.
And for those who want to see the ebb and flow here are the detailed graphs of those 21 glaciers. Click to enlarge. It’s obvious that without long term data and climate models that work (which can predict precipitation) we have no chance of predicting glacier growth or loss, and nor should we infer long term prophesies from 20 or 30 year short cycles. Even 85 years of somewhat minimal data shows there is a lot of variation, and none of it apparently related in any obvious way to man made CO2 emissions.
https://www.nature.com/articles/s41467-024-48886-x
Thirty years of propaganda won’t die easily:
REFERENCE
Mads Dømgaard et al, Early aerial expedition photos reveal 85 years of glacier growth and stability in East Antarctica, Nature Communications (2024). DOI: 10.1038/s41467-024-48886-x