In the Bermuda Triangle of electricity bills, the more cheap generators you add, the higher your electricity bills grow
The experts at the CSIRO tell us that renewables are the cheapest sources of electricity, with all their Capex calculations and their levelised maths, and yet the electricity bills set the house on fire. (It’s Russia’s fault!) Could it be that the experts accidentally forgot to analyze the system cost and that all the hourly megawatt dollars per machine don’t mean a thing?
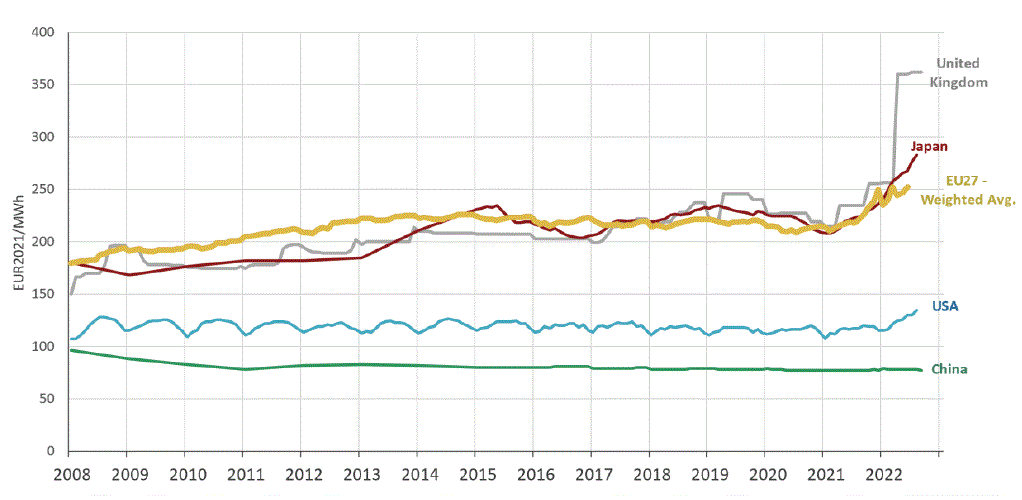
In the race to the most expensive electricity in the world, this week the UK is the winner. Germany is handicapped by being bundled into the EU27, lumbered with all the French nukes and is therefore not in the running. Australia is missing in action, but possibly only because the price rises were too fast and too much for the Eurostat, the US DoE, and IEA to keep up with, so they gave up.
And people wonder why China is the world’s manufacturing base.
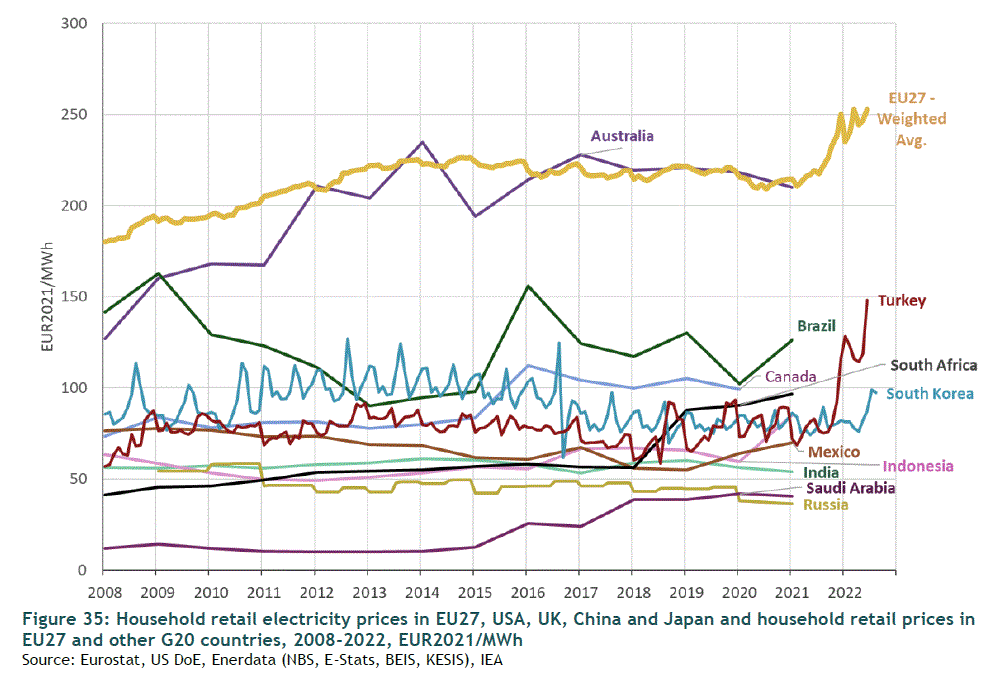
In the next graph is the “rest of the world”. After 2021 Australian electricity prices are unmarked for some reason, but officially they rose 20% two years in a row. So that cost of €210 per MWh in 2021 could easily have become €300 by 2023, putting Australians second highest in the world after the UK.*
The bottom line is that from 2008 the price of electricity in China fell from €100 down to €80 per megawatt hour. While in Australia it rose from €125 to €300 and in the UK prices rose from €150 to €360. Effectively, the price of electricity fell 20% in China at the same time as it rose 240% in Australia and the UK.
If President Xi had wanted to run a campaign to sabotage our grids, he couldn’t have done it better.
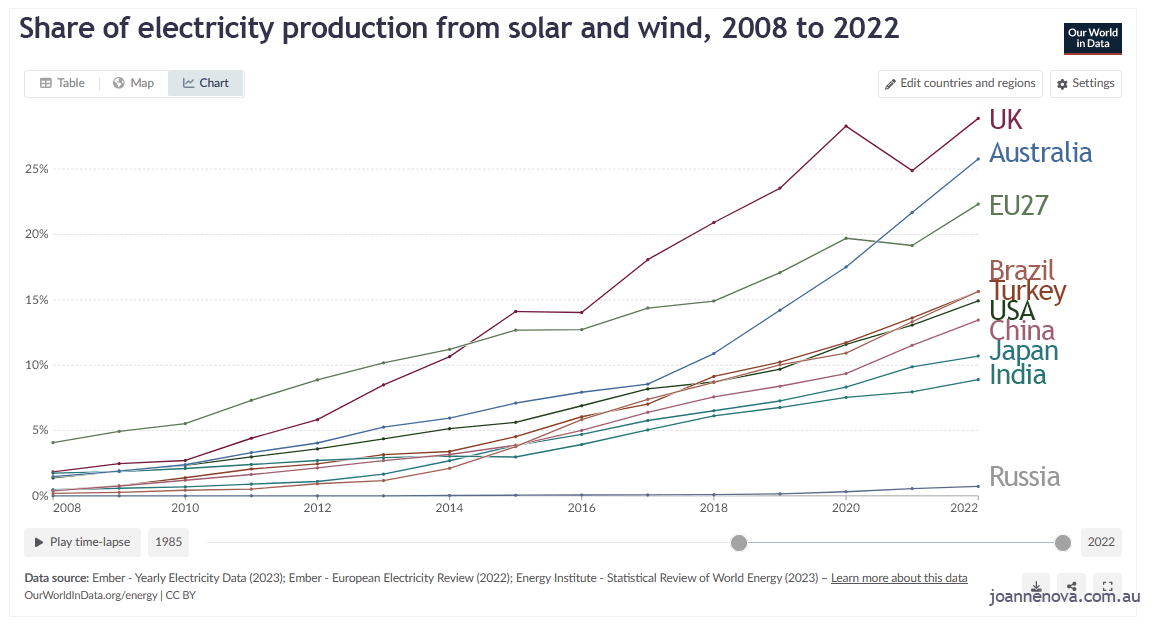
By uncanny coincidence the percentage of wind and solar power penetration on each national grid pretty much predicts the order of the price graphs the EU collated. Among this pool, the nation with the highest penetration of wind and solar power is the UK which gets 29% of its electricity from wind and solar power. Australia is second at 26%, and the EU collective third at 22%. Turkey and Brazil get 16% of their power from the unreliable generators, the USA got 15%, China 14%, Japan 11%, India 9% and Russia 1%.
Japan’s electricity is more expensive than its modest unreliable-generator-percentage would suggest, but then they have virtually no oil, gas or coal to call their own, and no interconnectors to rescue them either.
Is 20% renewables the tipping point?
The three winners of the Highest Price Electricity race are all states with renewable penetration above 20%.
The whole grid can absorb the penetration of unreliable energy up to a point, but there comes a time when adding more random energy generators is a burden too far. The system costs start to breed like Ebola, as the good generators get euthanized, storage costs get out of hand, frequency stability becomes an issue, and everyone wants their own personal interconnector. Then word spreads that the bird killing, bat destroying and whale shredding equipment is noisy, ugly and a fire risk, and before you know it, farmers need 100 times the money to make the high voltage towers bearable. It all just adds to the cost. And finally everyone realizes that the environment you were supposed to be protecting is being clubbed by a windmill, and Florence the borer is stuck in tunnel.
Smaller grids or countries without interconnectors will hit that tipping point faster. Watch this space, world. There is no nation over the border to rescue the Australian grid.
* Estimating the unlisted Australian price leap: the ACCC here found domestic retail bills jumped from $1400 annually to $2000 in NSW, and $1200 to $1600 in Victoria. (p66). In Australia the retail electricity rates now roughly average 33c per kilowatt hour, with a range of 26-45c/KWh (AUD). But that useage cost doesn’t include all the charges. As Craig Kelly points out the €250/MWh European rate is effectively 25 euro-¢/kWh. But the official “Default offer” in South Australia is $0.68 kWh (or 41 euro-¢/KWh). In NSW it is $0.53 – $0.56 kWH (32-34 euro-¢) and in Queensland it is $0.50 kWH (30 euro-¢). So Australia really is more expensive than the crazy-land EU. And while traditionally few customers paid the “default offer”, in 2023 as many as 40% of customers on flat rate plans were paying that rate, according to the ACCC (p47).
h/t to Schroder, thank you, and @CraigKellyPHON.
REFERENCES
European Commission, Directorate-General for Energy, Smith, M., Jagtenberg, H., Lam, L. et al., Study on energy prices and costs – Evaluating impacts on households and industry – 2023 edition, Publications Office of the European Union, 2024, https://data.europa.eu/doi/10.2833/782494
Or https://op.europa.eu/en/publication-detail/-/publication/3b43f47c-e1c5-11ee-8b2b-01aa75ed71a1/language-en/format-PDF/source-316287713
Inquiry into the National Electricity Market: December 2023 Report, ACCC, Australia, December 2023.


