The Roman Climate Optimum lives
Quietly hidden in a paper about ancient pandemics is the most detailed estimate of Roman temperatures I’ve ever seen. For 800 years temperatures gyrated over a three degree range. The Climate Alarmists of Rome could have run the whole warming-cooling-warming-scare back to back for 400 years. But make no mistake, the good times, Pax Romana — were the warmest and wettest ones. The colder times are associated with aridity, plagues and collapse.
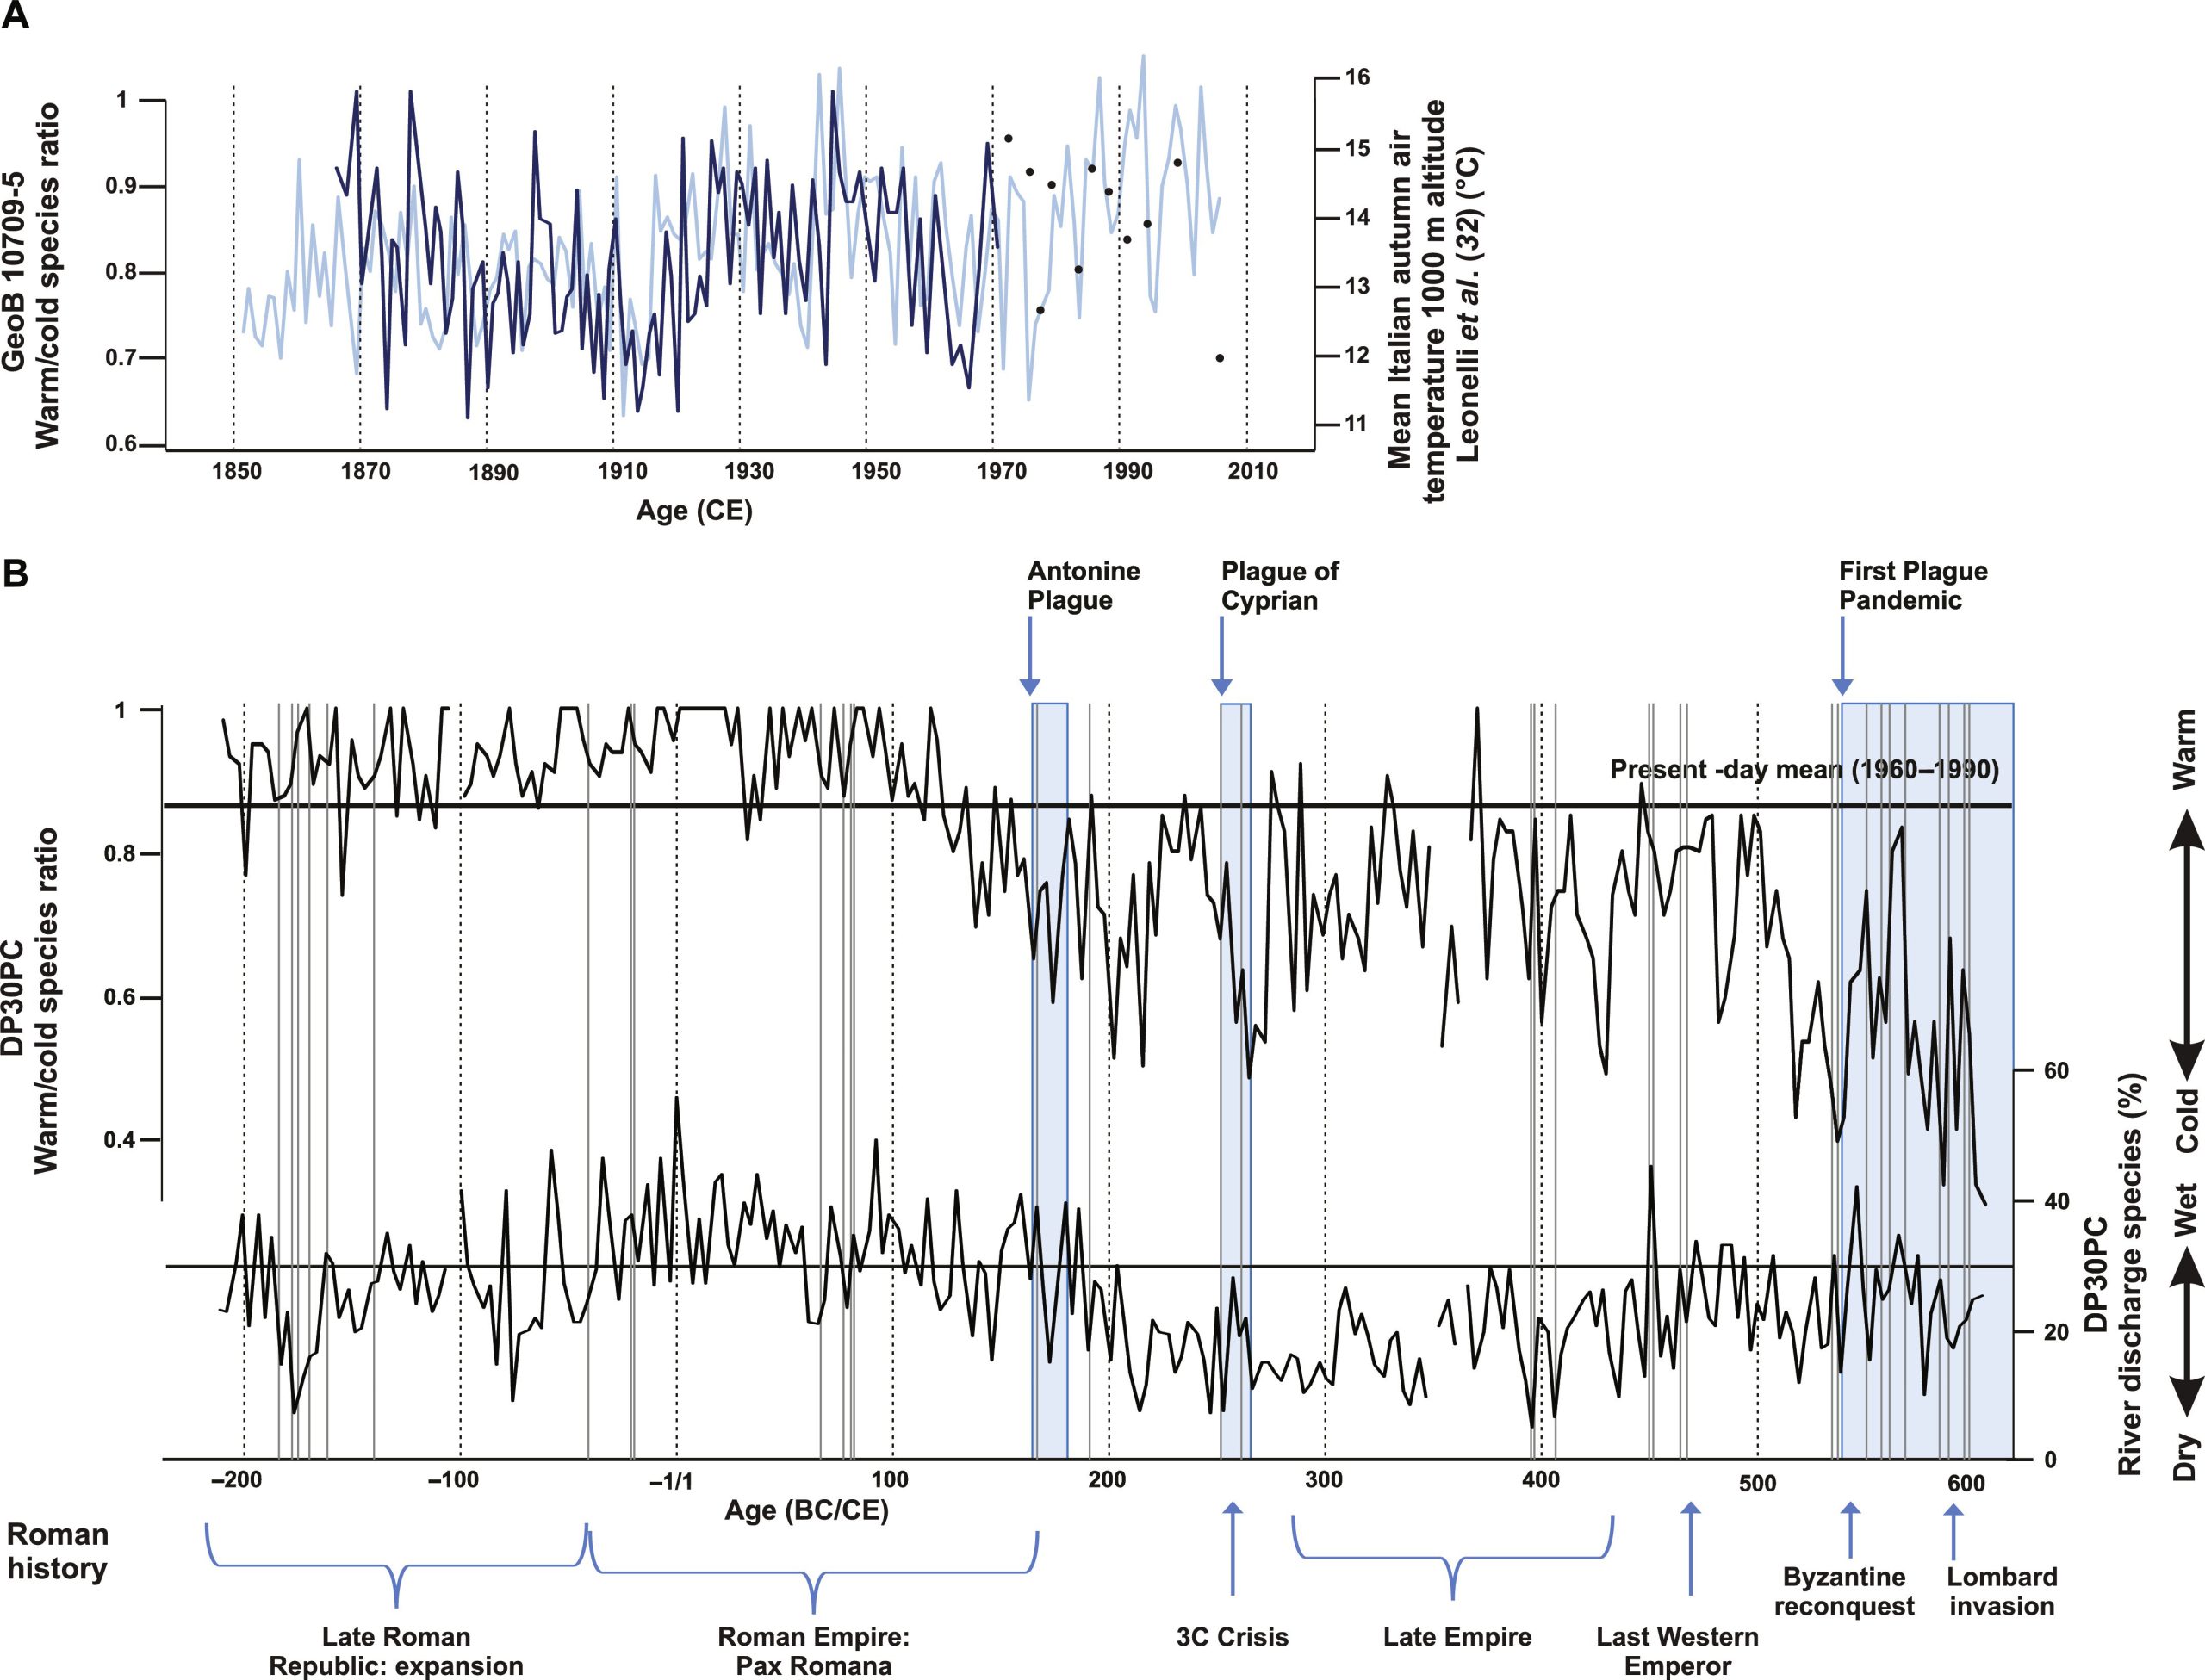
Two thousand years ago plankton bloomed and died, and the different ratios of warm and cool species left thick layers on the ocean floor just off the heel of the boot of Italy. Every ten years another centimeter thick layer of dead dinocysts collected on the sea floor, which makes for a remarkably detailed record. They report a jaw dropping “three year resolution”. The record was so rich they could pick out the seasons, and wow, by golly, they could compare it with modern air temperatures. (See graph A below) Though, for some reason they don’t make that easy, or say much about how those ancient temperatures compare to today. (Presumably, if they found things were hotter today, they’d have got a Nobel Prize.)
Cold times don’t guarantee a pandemic, but warm times do seem to discourage them:
Despite the expert predictions of doom in hot weather, the ancient Roman records don’t suggest mass outbreaks of malaria, flesh eating bugs, or viral pandemics.
Note the words “Present Day mean (1960-1990)” on the horizontal line on Graph B… it was hotter for 200 years in a row.

Fig 2A: (Click to enlarge) (A) Comparison between late-summer/autumn dinoflagellate cyst–based W/C ratio (black line + black points) of core GeoB 10709-5 and mean autumn Italian temperatures at 1000-m altitude (blue line). (B) Late-summer/autumn dinoflagellate cyst–based W/C ratio and relative abundance of discharge species (nutrient sensitive) reconstructions (black lines) and the occurrence of epidemics and pandemics in the Roman empire (blue blocks) as well as disease outbreaks in Roman Italy (gray lines) and major historical periods/events.
In the paper Graph B is strangely truncated at the hottest points as if their printer jets got clogged. Perhaps the heat broke some climate models? Just how hot was that spike in the era of Jesus? I’d like to get that data…
The plagues
The Antonine Plague, from about 165 to 180 AD was probably smallpox, no one is sure what the Plague of Cyprian was, from about 215 to 266 AD; it might have been measles, smallpox, or some relative of Ebola. At it’s worst 5,000 people a day were said to be dying in Rome. In Alexandria one historian estimates the population fell from half a million people to just 200,000. The Plague of Justinian was a form of Black Plague. It started from about 541 to 549AD, and they say rather somberly, lasted on and off until C.E. 766. Long live hygiene and antibiotics, eh?
The researchers can only speculate about why the pandemics spread more often in the cold. They don’t mention the word vitamin. But the first thing I would suggest is vitamin D3 — levels of which probably fall the minute people get out of their Toga’s and pull on their jackets.
The Antonine Plague of 165 A.D. — Smallpox
If you want to feel lucky, read Edward Watts description in The Smithsonian of what life was like in 165 AD:
Victims were known to endure fever, chills, upset stomach and diarrhea that turned from red to black over the course of a week. They also developed horrible black pocks over their bodies, both inside and out, that scabbed over and left disfiguring scars.
For the worst afflicted, it was not uncommon that they would cough up or excrete scabs that had formed inside their body. Victims suffered in this way for two or even three weeks before the illness finally abated. Perhaps 10 percent of 75 million people living in the Roman Empire never recovered.
The plague waxed and waned for a generation, peaking in the year 189 when a witness recalled that 2,000 people died per day in the crowded city of Rome. Smallpox devastated much of Roman society. The plague so ravaged the empire’s professional armies that offensives were called off.
And when communities began to buckle, Romans reinforced them. Emperor Marcus Aurelius responded to the deaths of so many soldiers by recruiting slaves and gladiators to the legions. He filled the abandoned farmsteads and depopulated cities by inviting migrants from outside the empire to settle within its boundaries.
Apparently things were so bad that in some cities so many aristocrats died they even filled the councils with “the sons of freed slaves”.
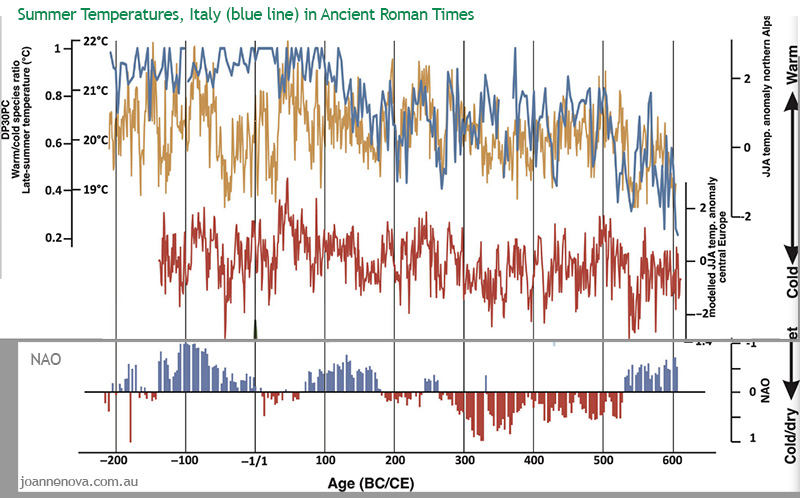
The temperatures from graph B above are marked in the figure below (just in case you don’t relate to phytoplankton ratios).

Core DP30PC and paleoclimatic records. Dark blue: Gulf of Taranto, late-summer temperature reconstruction based on dinoflagellate cyst composition (this study); orange: Northern Alps, June to August dendrochronological-based temperature reconstruction (3); red: proxy-based central European, June to August (JJA) temperature reconstruction (33)
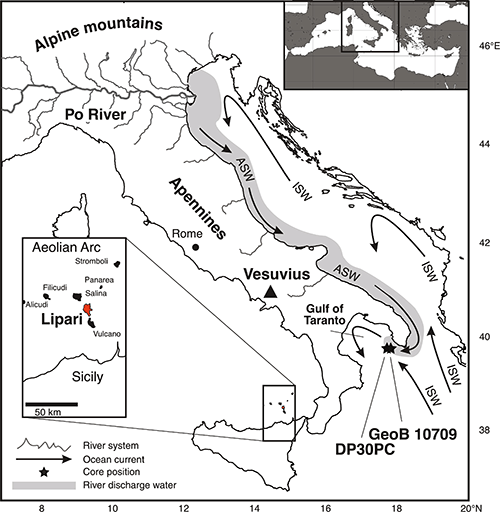
The currents flow right down the side of Italy before depositing some phytoplankton in the Gulf of Taranto where the samples were collected..
For the record, here’s how they describe the calibration:
The calibration of our dinoflagellate cyst–based temperature proxy is based on the comparison of the cyst association of a reference dataset from multicore core GeoB 10709-5 (29) to mean Italian late-summer/autumn air temperatures (32).
For some reason the researchers have this magnificent temperature record, and they calibrate it with modern temperatures but said nothing at all about how the Roman Optimum compared to the 21st Century. Luckily, we already know from other studies it was hotter back then. Must have been all those Roman coal plants?
- 2,500 years of wild climate change in southern Europe: It was warmer in Roman Times than now
- Hottest summers in the last 2000 years were during Roman times
- Roman Warming (was it global?)
h/t Judith Curry and Tom Nelson
REFERENCE
K. A. F.Zonneveld et al (2024). Climate change, society, and pandemic disease in Roman Italy between 200 BCE and 600 CE Physics Today 77 (4), 17–18 (2024); https://doi.org/10.1126/sciadv.adk1033
Margaritelli, G., Cacho, I., Català, A. et al. (2020) Persistent warm Mediterranean surface waters during the Roman period. Sci Rep 10, 10431. https://doi.org/10.1038/s41598-020-67281-2
Garcia-Solsona, E.; Pena, L. D.; Paredes, E. ; Perez-Asensio, J.N.; Quirós-Collazos, L. ; Lirer, F.; Cacho. I. (2020) “Rare Earth Elements and Nd isotopes as tracers of modern ocean circulation in the central Mediterranean Sea”. Progress in Oceanography, June. Doi:/10.1016/j.pocean.2020.102340
See also the write up in Physics Today.
*Figure 2 headline altered to clarify the role of the blue line. 19/04/2024.
