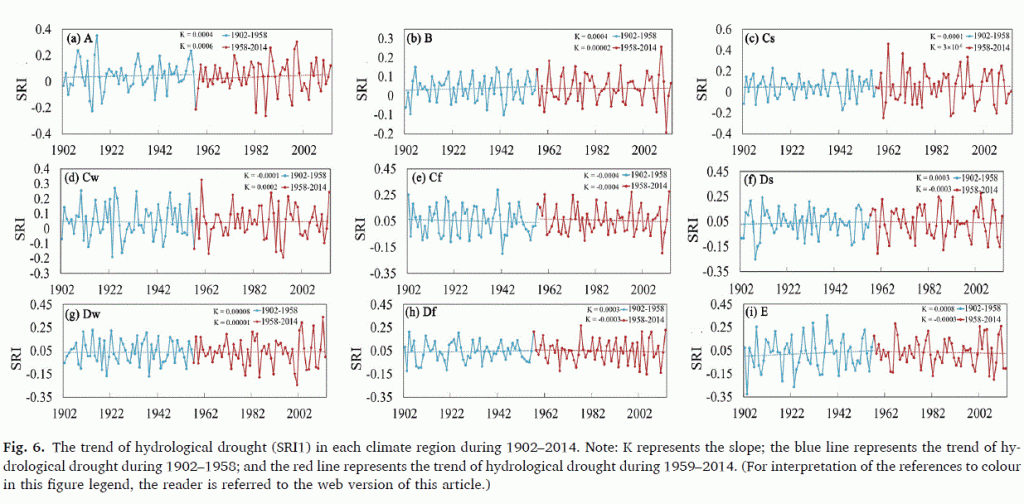
Any which way you look at global drought measures in the last 120 years this is not the CO2 doom scenario of the IPCC prophesies either in rainfall patterns or in water supplies. The graphs below show rainfall trends shifting slightly due to unknown forces and looking for all the world, like CO2 is irrelevant. Despite the scare campaigns about floods and droughts, and the threats of climate wars over dwindling rivers, there has been no trend in hydrological droughts since the Wright Brothers first flew a plane.
Kenneth Richards at NoTricksZone reported on Shi et al, a paper which looked at trends from 1902 to 2014 in all nine climate zones of the world.
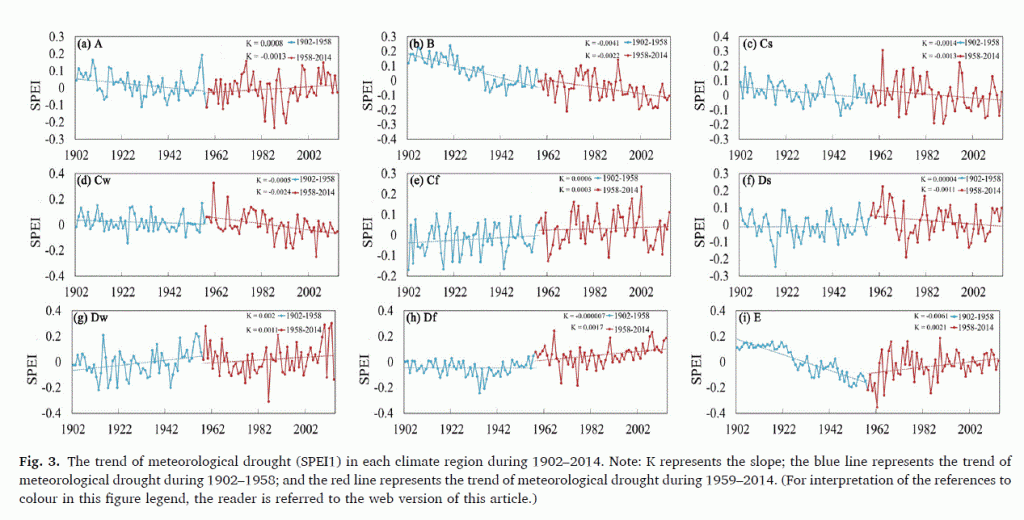
The first graph shows a mixed bag of trends in Meteorological Droughts, none of which are obviously linked to human emissions of CO2. Remember, half of all human emissions since we crawled out of caves has been emitted after 1995. According to CDIAC fully 250,000 Mt of CO2 was emitted up to that year, then we have doubled that in the years since then. If CO2 was a planet transforming molecule, surely we’d see something in the last 25 years?
The bottom line is that if we had climate models with any understanding of rainfall they would be able to predict wet and dry seasons, and trends in droughts, floods, streamflow, and rivers. Instead, like stone-age heathen victims, we wail and lament any time a flood or a drought happens anywhere. We blame camels or cows, trucks and planes. We change our light globes and hope our houses don’t get washed away on the same floodplains that were inundated 100 years ago.
The first graphs show Meteorological Droughts trends in the nine climate regions (a lack of rain):
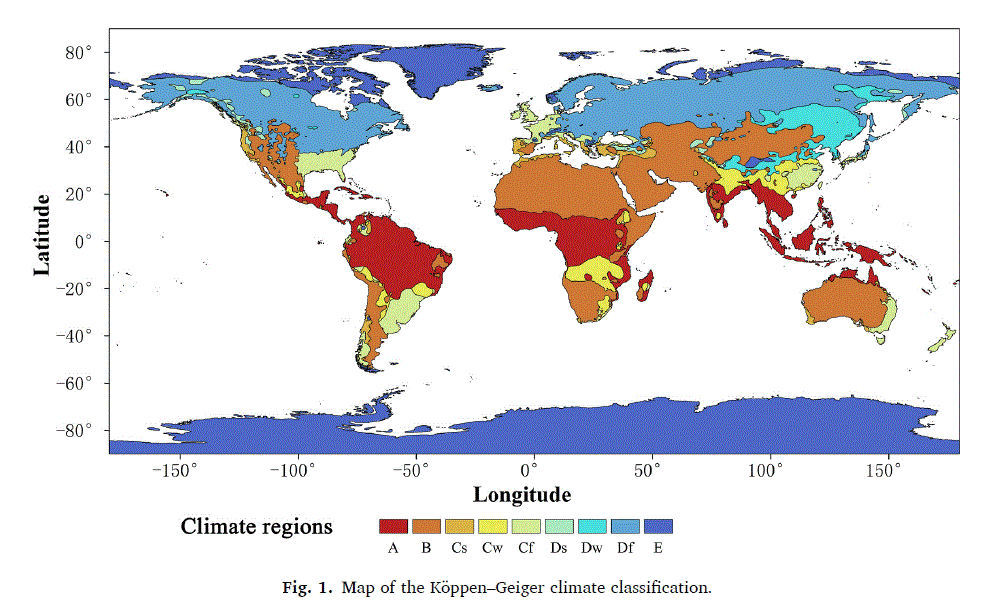
The regions codes are on the map below. (Click to enlarge).

Meteorological Drought trends. (Click to Enlarge) Shi et al 2023
The second set of graphs are the hydrological drought trends (a lack of water supply):

Hydrological Drought trends. (Click to Enlarge) Shi et al 2023
These are the climate zones the study used:

Classification of different drought regions of the world. Shi et al 2023
(Essentially Australia is B, Cf and A, The USA is B, Cf and Df. The UK, France, Germany and NZ are Cf).
Even longer studies show that droughts and floods have always happened
Fully 178 years of Australian rainfall showing no trend at all in relation to CO2. A study on one thousand years of rainfall in Antarctica suggests droughts and floods used to be longer, worse. Indeed, old world megadroughts in past 2000 years worse, longer, than current droughts. The deadliest droughts in India were before 1924…. etc.
For more posts on these see the tags: Rain , Drought, Floods, Australian rainfall
DEFINITIONS
According to NOAA, a Meteorological Drought is a lack of rain suffered for an extended time, whereas a Hydrological Drought is a lack of water supply such as stream flow, reservoir and lake levels, and ground water.
REFERENCE
Haiyun Shi et al (2023) A global perspective on propagation from meteorological drought to hydrological drought during 1902–2014, Atmospheric Research
Volume 280, 15 December 2022, 106441, https://doi.org/10.1016/j.atmosres.2022.106441
