By Jo Nova h/t Cohenite
New NOAA STAR Satellite system gets a major correction and suddenly agrees with UAH satellites, not RSS
 An all new reanalysis of the STAR satellite data finds markedly lower temperature trends for the last 40 years. The big deal about this is that this third dataset suddenly supports the original UAH satellite data, not the other RSS system, and not the “surface thermometers” sitting near hot tarmacs and absolutely not the climate models.
The warming trend in the troposphere was only half of what the expert models predicted. From the paper:
Santer et al. (2021) reported that the multi-model averages for the TTT trends from CMIP5 and CMIP6 were 0.28–0.29 K/decade during 1979–2019. The total TTT trend found in this study was only one-half of the climate model simulations during the same period.
The authors admit that this has strong implications for the models, and supports a paper by skeptics Ross McKitrick and John Christy: Ross McKitrick replied in the Financial Post:
An important new study on climate change came out recently…
Zou’s team notes that their findings “have strong implications for trends in climate model simulations and other observations” because the atmosphere has warmed at half the average rate predicted by climate models over the same period. They also note that their findings are “consistent with conclusions in McKitrick and Christy (2020),” namely that climate models have a pervasive global warming bias.
Zou et al from NOAA is a bit of a blockbuster. Certainly a surprise. Skeptics have long favoured the original UAH satellite data set that consistently showed far less warming than climate models and for good reasons (see below) — especially because UAH agreed with 28 million weather balloons. A second satellite set called RSS gradually showed warmer trends than UAH did. A third satellite set was collected by NOAA and called STAR and it agreed with RSS — at least until a few weeks ago. Now suddenly it’s been re-worked thoroughly and the trend is almost identical to the UAH one.
As Roger Pielke Jnr says “if true — this is very scientifically important”:
He quotes Zou et al who are agreeing that their results support the skeptics
This is consistent with conclusions in McKitrick and Christy (2020) for a slightly shorter period (1979–2014). Possible reasons for the observation-model differences in trends may include climate model biases in responding to external forcings (McKitrick & Christy, 2020), deficiencies in the post-millennium external forcings used in model simulations (Santer, Fyfe, et al., 2017), phase mismatch in natural internal climate variability (Po-Chedley et al., 2021; Suárez-Gutiérrez et al., 2017), and possible residual errors in satellite data sets.
Pielke Jnr: Read that again, especially the last sentence. [They] are suggesting the possibility that either observations of global warming are flawed, that climate models are flawed, or maybe both. These possibilities would — if true — be very scientifically important.
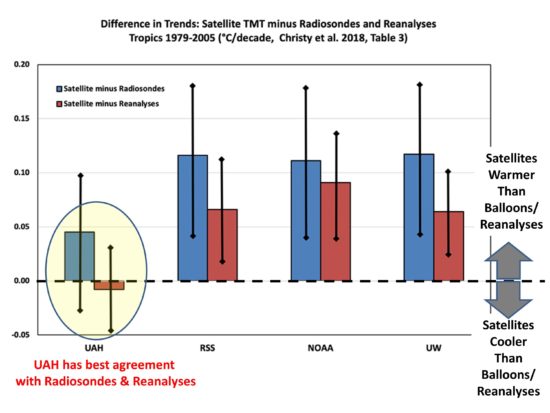
Here’s now different the satellite datasets were in 2018
UAH was called the outlier, but all the other datasets used similar methods to RSS. They all continued to use a satellite called NOAA-14 even though its calibration was drifting. They also used similar strategies for diurnal drift adjustments. In Roy Spencer’s words “ Thus, NOAA and UW are, to a first approximation, slightly altered versions of the RSS dataset.”

Figure 2. A comparison of warming trends from 1979 to 2015 for the radiosonde data and the three global satellites. from Roy Spencer (Christy et al 2018)
Ross McKitrick explains the history of these differing satellite temperature sets. This is a battle that’s been waging for thirty years.
Ross McKitrick:The important climate study you won’t hear about
Special to Financial Post
[John] Christy and his co-author, Roy Spencer, invented the original method of deriving temperatures from microwave radiation measurements collected by NOAA satellites in orbit since 1979. Their achievement earned them numerous accolades, but also attracted controversy because their satellite record didn’t show any warming. About 20 years ago scientists at Remote Sensing Systems in California found a small error in their algorithm that, once corrected, did yield a warming trend.
Christy and Spencer incorporated the RSS correction, but the two teams subsequently differed on other questions, such as how to correct for the positional drift of the satellites, which changes the time of day when instruments take their readings over each location. The RSS team used a climate model to develop the correction while the UAH team used an empirical method, leading to slightly different results. Another question was how to merge records when one satellite is taken out of service and replaced by another. Incorrect splicing can introduce spurious warming or cooling.
The climate modelers have been seeking some kind of endorsement of their models from satellites for decades, but the gap has grown wider instead of narrowing. STAR was a lifeline for the modelers, now it’s not:
In the end the two series were similar but RSS has consistently exhibited more warming than UAH. Then a little more than a decade ago, the group at NOAA headed by Zou produced a new data product called STAR (Satellite Applications and Research). They used the same underlying microwave retrievals but produced a temperature record showing much more warming than either UAH or RSS, as well as all the weather balloon records. It came close to validating the climate models, although in my paper with Christy we included the STAR data in the satellite average and the models still ran too hot. Nonetheless it was possible to point to the coolest of the models and compare them to the STAR data and find a match, which was a lifeline for those arguing that climate models are within the uncertainty range of the data.
Satellite show the models are wrong:
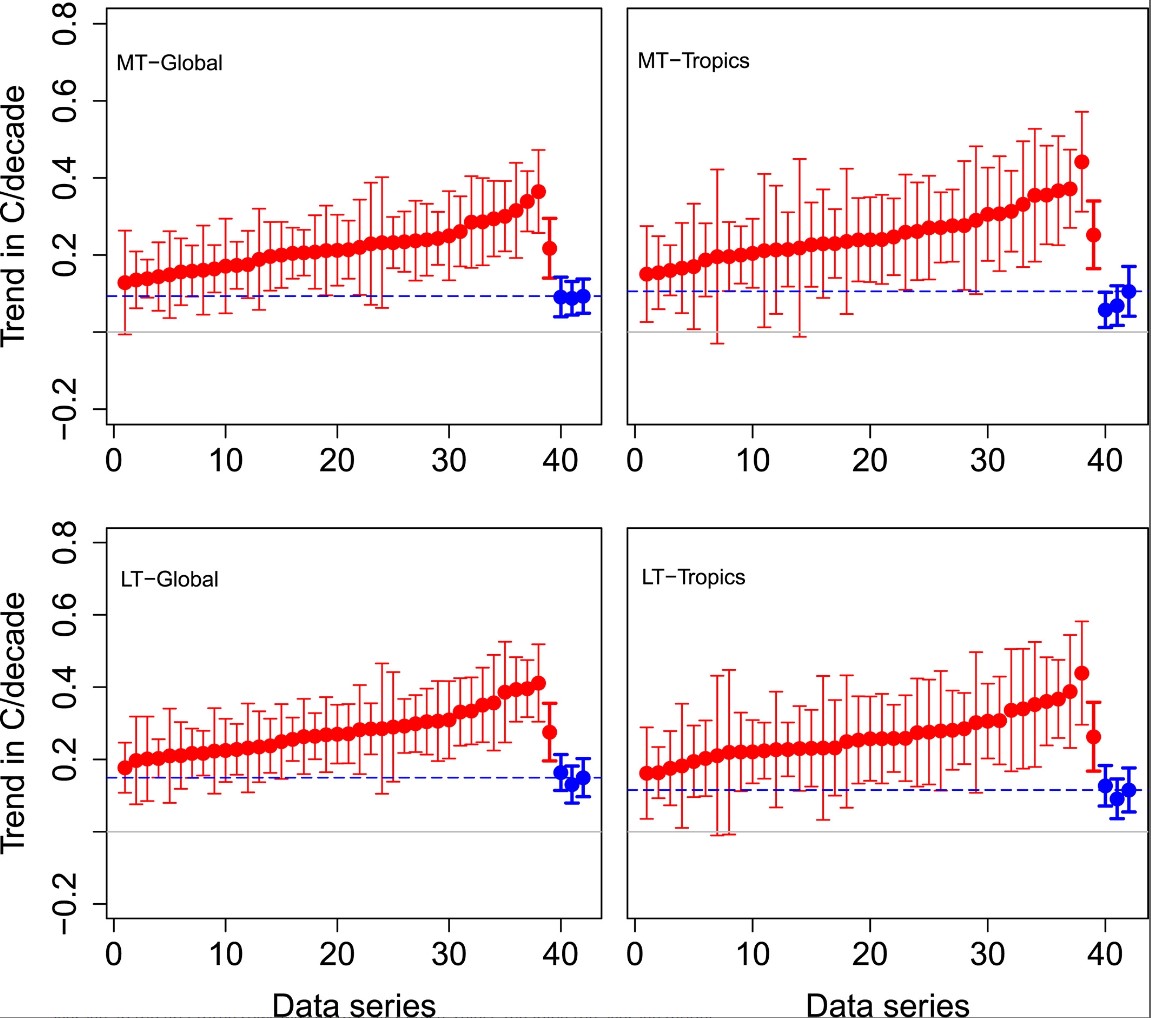
This below is the graph in McKitrick and Christy (2020) that the new STAR analysis essentially supports. The best climate models in the world are running too hot, predicting a lot of warming that isn’t happening.
They overdo the warming in the lower troposphere and in the mid-troposphere in the tropics and all over the globe. After 40 years and massive emissions of CO2 the models are wrong. The modelers don’t know what drives the climate.
From 2017: Five reasons UAH is different (better) to the RSS global temperature estimates
I explained why UAH was scientifically much more respectable than RSS
Five reasons UAH is different to RSS
- UAH agrees with millions of calibrated weather balloons released around the world. RSS now agrees more with surface data from equipment placed near airports, concrete, airconditioners and which is itself wildly adjusted.
- In the latest adjustments UAH uses empirical comparisons from satellites that aren’t affected by diurnal drift to estimate the errors of those that are. RSS starts with model estimates instead.
- Two particular satellites disagree with each other (NOAA-14 and 15). The UAH team remove the one they think is incorrect. RSS keeps both inconsistent measurements.
- Diurnal drift probably created artificial warming in the RSS set prior to 2002, but created artificial cooling after that. The new version of RSS keeps the warming error before 2002, but fixes the error after then. The upshot is a warmer overall trend.
- UAH uses a more advanced method with three channels. RSS is still using the original method Roy Spencer and JohnChristy developed with only one channel (which is viewed from three angles).
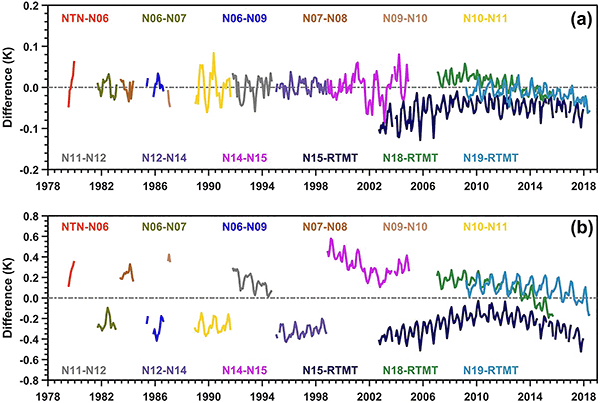
The latest corrections by Zou 2023 were intricate and involved. This is just one eye candy graph of many (below). But we get some idea of how many satellites were involved in the last 40 years. In this case the adjustments were different over land and ocean for each satellite.

Figure 5: Inter-satellite difference time series for satellite pairs between those from TIROS-N to RTMT after the frequency adjustment for (a) over the global ocean and (b) over the global land. Zou et al
It’s a testament to the work of John Christy and Roy Spencer that the new detailed corrections suggest they were probably mostly right all along — despite the immense pressure on them to “find” results and adjustments like the other teams.
It’s a credit to Zou et al and the team at NOAA for publishing what appears to be conclusion that they might have preferred to ignore. Though they do suggest that the warming has accellerated lately:
Remarkably, the total tropospheric trends during the latest half period were nearly doubled the earlier half period over the global ocean.
But there is more discussion from Ross McKitrick at Judith Curry’s site on why the claimed “recent acceleration” in this paper is short term, not significant and dependent on picking the right break point.
In sum, based on a preliminary analysis the new NOAA data do not support a claim that warming in the troposphere has undergone a statistically-significant change in trend. The Global and Tropical TTT series show no support for the claim. The Global MT series appears to show support but only if the break data is placed in a specific interval in the early part of the last decade, and more recently the tests do not support acceleration. Finally, all of these results are biased towards finding evidence of a trend break due to the treatment of g. Robust critical values could be generated, which I might get to someday if no one else does it first.
REFERENCES
, & (2020). Pervasive warming bias in CMIP6 tropospheric layers. Earth and Space Science, 7(9), e2020EA001281. https://doi.org/10.1029/2020ea001281
Zou, C. Z., Xu, H., Hao, X., & Liu, Q. (2023). Mid‐Tropospheric Layer Temperature Record Derived from Satellite Microwave Sounder Observations with Backward Merging Approach. Journal of Geophysical Research: Atmospheres, e2022JD037472.
Satellite image: By NASA
