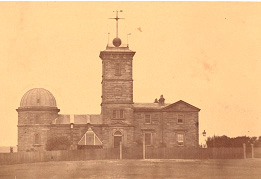
Sydney Observatory in the centre of the city in 1864. (Courtesy of the State Library of NSW.)
For the first time in 163 years of records at Sydney Observatory the temperature didn’t even crack 32 degrees C (or 90F) for the whole year of 2022. Despite CO2 being at higher levels than ever, Sydney has never had temperatures that were so un-extreme.
The hottest day all year at this historic site was just 31.9 C. When researcher Chris Gillham first mentioned this, I assumed he must have meant “for the month of December”. I could not believe Sydney would go a whole year without a single hot day, but here it is. Gillham graphed the hottest day of the year at Sydney Observatory every year since 1859 and it really is unprecedented.
So far the total media attention on this point is one tweet by a weatherzone meteorologist and a paragraph in The Sydney Morning Herald. (h/t b.nice and RealClimateScience). Has the BoM even said a word? If it was the hottest year in 163 years, we’d know all about it. The BoM is an advertising agency for government policies.
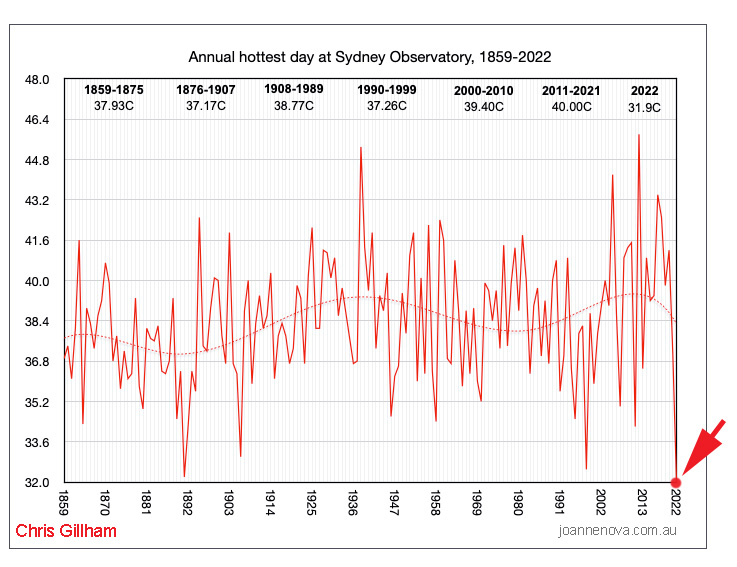 And this is despite many site changes which make the site warmer, including all the concrete, bitumen and 6-lane freeways added in the area. During the time shown in the graph, Sydney grew from 95,000 to 5 million people.
Sydney Observatory is right in the heart of city, surrounded by cars and yet it would have felt hotter there in 1859.
Sydney Observatory is right next to the busiest roads and tallest buildings in Sydney.
Soon children won’t know what summer is… 🙂
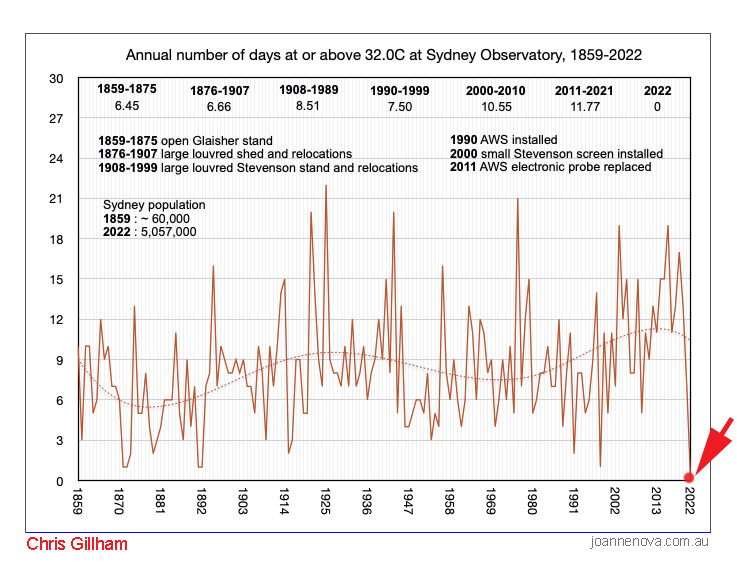
Most years in Sydney there are 6 to 20 days of temperatures above 32C. Many thanks to Chris Gillham for doing all the work to make these graphs.
 What happened to that extreme heat?
The reason for the lack of hot days is due to the record amount of rain. In 2022 2,530 mm of water fell on Sydney, breaking the previous rainfall record of 2,194mm set in 1950. When soils are wet, sunlight must evaporate the moisture before the soil and air above it, can start to heat up. So more rain means cooler maximums.
To get hotter maximum temperatures takes bone dry sand. If only the Bureau of Meteorology could predict rainfall, droughts and La Nina’s, they might also be able to predict which years would have extreme heat? Wouldn’t that be handy?
Instead, the models are so bad, even the expert climate modelers don’t want to use their own models to help invest their own retirement funds.
For most people under 70 in Sydney this has been one the three coolest years they’ve ever known
Background information:
BoM Sydney Observatory site (closed) with the new BoM site
In 2017 and 2018 Bill Johnston documented the many site changes and the full history of this iconic site. If only the BoM were as interested in the history as the volunteers are?
*Edit: BoM auditor changed to “researcher”. Chris Gillham has been a volunteer critic and auditor of the BoM for years but prefers to be described as a researcher.


Remember that as far as the BoM is concerned, any weather data recorded before 1910 doesn’t exist. It doesn’t fit the narrative.
560
A relevant question is how accurate mercury-in-glass thermometers were in the 1800’s. I found this Q+A from the US.
How accurate were thermometers in the 19th century compared to today’s readings? Specifically, when you say there was a record temperature in 1890, do you really trust this as being accurate?
540
I have no idea about the size of these thermometers, but the fever thermometers in my childhood where also mercury thermometers and not beeing complete blind, they where good readable.
https://www.seilnacht.com/Lexikon/tnqueckt.JPG
120
The question of thermometer accuracy is a red herring. Thermometers have been around for 400 years. It’s an old tech. The ones in the 1800’s were accurate. The problem is everything else about the way we measure temperature not the glass thermometers. The screens around them were not standardized until the BOM was formed around 1910. But don’t get too excited — even after they were standardized, the BOM are still adjusting what the experts measured in WWI etc. Fully 100 years later we “correct” those temperatures with mysterious, undocumented methods of homogenisation, using other thermometers up to 1,500km away, or even across the Bass Strait or the snowy mountains. Since 1910 we have swapped F for C thermometers with potentially different human errors of rounding, and shrunk the size of the Stevenson screens and changed our glass thermometers for electronic sensors around 1996 — these can register a one second record of heat as a car drives past and call it a new extreme “record”. And we moved thermometers from grassy patches to the edge of airport tarmacs, or carparks, or put them near incinerators. We have documented all of this with photos. Even the BOM knows, but they don’t fix site problems. If they did, they wouldn’t have the excuse of using mystery adjustments.
Furthermore, we know what the historical screens were made of in places like Sydney Observatory. If the BOM actually cared about “the climate” they could rebuild the original screens, put them next to our modern screens and compare the temps. The urban heat effect would still dominate, but at least we’d have side by side consistent measurements.
The BOM used to have side by side measurements of glass thermometers and electronic thermometers. They know how the sensors change and probably exaggerate the highest temperatures, but they won’t provide that data. They told us they threw it away.
The BOM is a scandal of unscientific, unpublished, sacred guild type “expertise”. No one can replicate their adjustments. It isn’t science.
402
“ If the BOM actually cared about ‘the climate’ they could rebuild the original screens, put them next to our modern screens and compare the temps.”
You mean, do actual science?! Perish the thought! How dare we expect them to even consider the possibility that they might be wrong?! Why, they have participation trophies, pats on the head and are invited to the best parties by all the best people, and substantial cash grants in support of, uh, …whatever tricks they’ve been trained to perform. No, they couldn’t possibly be wrong.
Mendacious meteorological madness is the rule of the day. It’s deeply ingrained, and so will likely be with us for a while.
80
Brilliantly put, the side by side argument applies to all ‘new science’ that the WEF Fourth Reich and their useful idiots purport to be the basis for their Marxist utopia.
Their propaganda machine will dismiss all opposition as heretics or sanctimoniously claim the facts of thousands of years of samples and hundreds of years of human recording has been debunked, but the simple test remains and should be demanded of those who want change.
No attempt at reasoning works with cults.
Show them both options side by side and ask for them to explain and we then know who we’re dealing with.
The future for the majority is to reduce the useful idiot population on the periphery by asking them questions. They then have to confront their own lack of critical thinking, in the face of two alternatives; one which has proven bonefides and the other which dismisses all history, yet can’t explain how their ‘science’ has magically replaced fact!
30
“No attempt at reasoning works with cults.”
So true!
20
And the bservatory site is surrounded by traffic. Makes the temperatures recorded higher than any taken even a few hundred metres away.
330
Exactly – during this time span the Urban Heat Island effect will definitely have raised the average temp. But care here. Normally what it does is raise night time temps as less heat loss is occurring due to retention in buildings, roads etc. The maxs are usually not greatly changed.
The BOM know all about UHI and misuse homogenisation methods to transfer the raised averages in urban areas to static rural ones. Hey presto – its all warming…. Although this past year may put a dent in that!
The BOM needs to be shutdown and Dr Johnson and his management team sacked as they are permitting ideology instead of science to be practiced.
290
I read in the newspaper this morning that the BOM has predicted an end to La Nina and we are headed for El Nino and bushfires (bad news for me as a volunteer firefighter). I have been keeping an eye on the SOI index on https://www.longpaddock.qld.gov.au/soi/ and the 90 day average has remained fairly steady at 14 and the 30 day average has risen significantly to 19 anything above positive 8 is considered La Nina. I know where I live in Central Victoria it is drying out as we have missed out on recent storms, but thunderstorms in summer are always hit and miss. Am I missing something with the SOI or is the bureau is ignoring the SOI in their predictions for El Nino?
320
The BOM has been predicting an end to the La Nina for each of the last three years. Eventually, they’ll get it right, but I’m not betting on it.
210
Cynically even a broken clock reads correctly twice a day.
I have no faith at all in the BOM being able to predict anything, such is the scale of the fraud they continue to perpetuate.
160
You can keep a check on SST using this graph.
https://www.ospo.noaa.gov/Products/ocean/sst/anomaly/
Since November there has been a rapid cooling in SST off NW Australia and now spreading to northern areas as the IOD reverses. The warm pool over the Coral Sea is also cooling rapidly. But, the big question is will El Nino replace La Nina. Currently the models are 60% against El Nina and favour neutral conditions. Looking at the SST anomolies over the past few months a neutral phase for the next 6 months seems to be the more likely outcome.
60
The Humboldt Current has been cutoff by a warm blob, so the cold Southern Ocean is taking a short cut to the equator.
https://earth.nullschool.net/#current/ocean/surface/currents/overlay=sea_surface_temp_anomaly/orthographic=-146.87,-4.21,265
31
Most of the models are in agreement, ENSO will become neutral and the rain should ease off over the coming months.
BoM has been slow in forecasting ENSO behaviour, so they can’t imagine a la Nina Modoki evolving later this year.
40
This data will be run through the Magic Machine to produce the following conclusion: 2022 was the Hottest Year Ever!
310
Gawd! If the observatory is cold, it must be waterlogged by the sea-level rise we were warned about!
300
The heat pumped out by high rise airconditioners, idling cars and buses and absorption and reradiation from buildings & sidewalks would be enormous.
180
Call me a sceptic but if the BOM is publishing such ‘cooling’ data openly then they must be hiding something else that they don’t want known. Look over here!
260
Exactly, La Nina cools because of extra cloud cover, but they won’t talk about the Southern Annular Mode (SAM) being so positive.
https://weather.plus/aao-index.php
The Subtropical Ridge (high pressure belt) is stuck too far south and a wayward jetstream is creating blocking, bringing cool air to Southern Australia.
Its a global cooling signal.
230
The BOM are not really “publishing” anything if they just allow raw data to be displayed in online datasets that 0.00001% of Australians use. Where is their press release? Where is the mention on the nightly weather report? If this was a hottest ever record it would be everywhere.
231
I blame the MSM for everything, their failure to investigate and communicate both sides of the debate.
BoM needs to be audited and its association with the CSIRO is unseemly, they should divorce.
130
Here is an example of the phenomenon.
http://www.bom.gov.au/fwo/IDY65100.pdf
80
Expanding a little further …
‘In this study we use station observations of temperature and rainfall to identify the influence of the SAM on land regions over the whole of the Southern Hemisphere. We demonstrate that the positive phase of the SAM is associated with a significant cooling over Antarctica and much of Australia, and a significant warming over the Antarctic Peninsula, Argentina, Tasmania and the south of New Zealand.’ (Gillet et al 2006)
80
Melbourne did not have a summer at all. And this year we have had two warm days. The first two weeks of February used to be hell, over 35C most days. It was terrible for school children. And I remember in the 1990s going to the beach in Melbourne every day in January as there were only two days UNDER 30C. Now we are lucky to get two days over.
The Global Warming farce goes on. Joe Biden is off to Mexico to talk Global Warming, after blaming the Republicans for the open borders and millions of illegal immigrants. There is just no connection between what the extreme left says and reality.
And the lack of snow in Switzerland for the ski resorts is used to push global warming, but in fact it is a drought caused like all droughts by lack of evaporation and rain or snow because the oceans are cooler. No one bothers to explain no snow means cold, not heat. It was what drove the French Revolution, starvation during a cold drought.
At some stage people will realise it is not the temperature of the thin air which matters, but the ocean surface temperature and that is dropping as expected. Cold oceans means no evaporation and without rain, we do not have weather, just cold. The patterns are changing too, as expected. And the water in the Fitzroy River in WA is over the bridge as the rain buckets in the Kimberlies. That is extraordinary.
But it is all caused by carbon dixoide. A 50% increase in 250 years has done this. For 250 years every drought, every flood, every hurricane, too much snow and not enough snow. All CO2.
And Climate Change (previously known as Global Warming) is treated by the press as a fact of life caused by CO2. There has never been any debate. You are not allowed disagree, as Professor Peter Ridd knows, even when the facts prove you right. Will someone please apologist to Peter Ridd and give him his superannuation back? Or apologise to that other Climate Denier Cardinal George Pell, not least for a year in solitary confinement for a conviction for crimes which could not have happened.
As long as the ABC pushes Global Warming and Climate Change and that Catholics are evil and Donald Bradman is a ‘Right Wing Nut Job’, we are paying $30Million a week for lies and lifestyle. In a country where journalists get awards for putting innocent people in jail or destroying their lives with unfounded allegations. And no one says sorry.
Sell the ABC. And the BOM and CSIRO. If they are valuable, we want our money back. If they are worthless, there is a reason. And you could close the Clean Enegy Regulator, the illegal operations which taxes carbon dioxide in all our electricity bills while Labor and the Greens blame everyone but themselves for the mess. Just like Joe Biden.
660
https://www.youtube.com/watch?v=7LVSrTZDopM&ab_channel=JordanBPeterson
The Greenhouse Effect. Jordan B Peterson recent interview with Professor Richard Lindzen.
70
In Melbourne, the weather news was warning of heat and danger in late December because the temperature was about to exceed 35C for one day.
The official BOM CDO files for Melbourne Regional office (then Olympic Park after the city station closed in 2014) show there had been 850 previous days on 35C or more, an average of 6.3 a year.
So the BOM doublespeaks about a hot danger from a cold event.
Look at the drop in air temperatures since 2016 from the UAH satellite data over Australia.Geoff S
http://www.geoffstuff.com/uahjan2023.jpg
300
Thanks for the Aussie UAH graph Geoff.
120
Nice graph, thanks. I have a real problem with people measuring temperatures to 0.001C and claiming records trying to find this ‘warming’. In terms of life on earth, a degree or two in air temperature makes no difference at all. Species will not vanish. Anywhere
Now if the entire ocean warmed 1 or 2 degrees that would be something else but air does not warm water. Air in ice cores has not changed in a hundred million years as they have found. Air temperature is a tiny surface effect and changes dramatically every day. A single quick 40C reading in England does not mean anything. Variables can be averaged but averages are not some sort of law. We will still have many very cold winters and hot summers and everything in between and wet and dry. But if the ocean surfaces cool as expected, air temperatures will drop.
Water controls our planet, not air. The only way the water cools is by evaporation and this becomes rain and snow and humidity. Humidity drops air pressure as steam takes up less room and that produces massive updrafts because unlike water, air density changes and the force created is vast. All of our weather comes from the Coriolis force from a spinning planet and the massive power of hot wet air at low pressure. Which is why we watch barometers. It’s all about water content.
So why does everyone claim water surface temperature wrecked their predictions (La Nina)? It means they are measuring the wrong things, effect not cause. Air has almost zero heat capacity and can radiate it all away in a few hours. The air temperature is driven by sun and oceans which is so obvious every single day when the sun goes down.
But we are told a tiny variation in an average air temperature of just 1 or 2 degrees will end life on earth? Does anyone really believe that? Until we had digital thermometers you had to look closely to notice such a change. The map of water surface temperatures is far more significant and if we could predict them, that would be the key to studying climates, not air temperature. And El Nino would not be the totally unpredictable massive climate upsetting phenomenon it is claimed to be. In a real science model we would predict El Nino and get the weather right.
Does CO2 control El Nino and La Nina and the Gulf Stream and the rest? Of course not! So why does CO2 matter at all? It doesn’t. CO2 climate science is pretend science, political science, climate scientology. And the money flows like the Gulf Stream.
390
‘In a real science model we would predict El Nino and get the weather right.’
We’ll have to do it without a supercomputer, which shouldn’t be too hard. ENSO behaviour appears chaotic, but I think it might be linked to the sun.
01
TdeF,
Also have problems with measuremnents of temperature and their uncertainty.
Wrote some detailed posts in Aug-October 2022 on WUWT exploring the problems. Three parts, the last with Tom Berger. Emphasis on BOM perocedures. Part 2 had over 800 comments, quite large for WUWT.
I personally invited BOM to read these posts and to comment, but not a peep.
Geoff S
https://wattsupwiththat.com/2022/08/24/uncertainty-estimates-for-routine-temperature-data-sets/
20
Thanks again Jo and I hope you’re able to wake up a few more very slow minds, but I’ll believe it when I see it.
BTW Ehrlich is still trying to spread his dud forecasts and he’s always wrong, but the MSM apparently enjoy his delusional nonsense.
How this delusional fool has the hide to keep yapping is a complete ongoing mystery.
https://wattsupwiththat.com/2023/01/05/serially-wrong-paul-ehrlich-is-wrong-again-we-are-not-on-the-brink-of-a-6th-mass-extinction-event/
150
The 2022 season was the lowest level for global hurricanes/ cyclones for 42 years.
Many graphs to check out and Dr Pielke jnr also graphs some of the data.
https://wattsupwiththat.com/2023/01/05/2022-global-wide-hurricane-season-ends-with-weakest-storm-levels-of-the-last-42-years/
140
No summer here on NSW Shoalhaven
Remember this example of “Confirmation bias” by 3 of the great & good
ABC sucked in by obvious rainfall errors at Muja Power Station a BoM site
http://www.warwickhughes.com/blog/?p=7061
I have been in touch with landowners v close to Muja and they recorded 500+ for last year in their gauge.
They say no way was last year at Muja an extreme dry year of 127mm like BoM says.
160
Almost half way through summer & not much summer here in South East Queensland either. Usually by this time of year we have had many nights where the air conditioning is on until 10.00PM or later, but not in this year. In fact it has run very little at all this year.
The same with cool nights. We would usually have had many nights sleeping on a bare bed, with not even a sheet covering us, but I am yet to have a night without a blanket this year.
The rainfall did struggle up to the second highest since records have been kept, so 1893 is still the wettest year. November & December were well under average, & it is drying out here too. I had to bury a pet this week, & I hit rock hard bone dry clay at 280mm after the second wettest year on record.
My bottom paddock by the river is finally dry after almost 3 years of virtually unpassable. It has huge ridges & trenches in what was the track down there, formed when we had to get down there to fix flood damaged fences.
This country of ours is certainly one of extremes. I have lived here 31 years, & have seen the second wettest, & the second driest years in 136 years of records. I have seen the river dry for 3 & 4 months in consecutive years, & flood 3 times in a single year. It is 75Ft deep when it reaches my back fence.
160
Very similar experience here in central west Qld – I think we might have reached 40 one day last month, but usually we get a fair few of those (= cricket watching time). Mild nights, not as much rain in our town as some but between Barcaldine and Townsville (via Torrens Creek) the scenery is green and lush. The BOM/media/pollies/public servants are lying, fearmongering scum so I don’t take any notice of them any more.
130
The Sydney observatory is now enclosed within a large heat island due to the absorbed and re-radiated heat from surrounding buildings, roads and other built environment. This effect probably boosted the recorded maximum temperatures of late. This result won’t be reported by the BOM and passed on to the media because it doesn’t support global warming mumbojumbo. On the other hand for the ususl hot summers the heat island effect works in favour of the BOM mumbojumbo and voilà we have evidence of global warming to feed the propaganda machine.
190
https://www.google.com.au/maps/@-33.8599253,151.2047705,3a,72.7y,181.72h,89.73t/data=!3m7!1e1!3m5!1sXUYxIJFvEk6TS4_hGYTeWQ!2e0!6shttps:%2F%2Fstreetviewpixels-pa.googleapis.com%2Fv1%2Fthumbnail%3Fpanoid%3DXUYxIJFvEk6TS4_hGYTeWQ%26cb_client%3Dmaps_sv.tactile.gps%26w%3D203%26h%3D100%26yaw%3D281.24075%26pitch%3D0%26thumbfov%3D100!7i13312!8i6656
Behind Sydney Observatory – on the right the Building going up is Barangaroo Tower Dark Reflective Glass
https://media.gettyimages.com/photos/barangaroo-international-towers-picture-id863920534
The Building on the left is Highgate Apartments – 127 Kent St (I had an office in one of the apartments) and the vegetation to the left of that is the Sydney Observatory
80
My unscientific personal observations involving no calibrations, scientific measuring wizard sticks etc continue to show things are changing in my “real” world. Six days into January and I have gingerly waded into the pool on only two ocassions. It used to be a 90,000ltr pool (8foot deepist point) but we filled it in a bit and reduced it to some 60,000ltr in anticipation of grandkids and to help the sun heat it up quicker for longer. This summer it has just not heated up. Even hardy daughter and a couple of her friends commented on it being cold when they tried a swim over Christmas.
Furthermore when(when) the sun does have an extended cloud free burst yes it is hot however as soon as a wind blows through the many degree different coolness of the breeze is very noticeable. As Jo comments “To get hotter maximum temperatures takes bone dry sand” which confirms to me at least that all the Tongan volcano triggered rains we had have made a great difference to the ground temperature and to a considerable depth.
My ongoing balcony observation of the sunrise shows the sun’s summer arc has not gone as far to the right as it has always been before ie it is rising to the left of a large “marker” tree that it used to rise behind before slowly tracking back towards its winter rising point – this time a clump of trees. Furthermore this last winter while it did still rise behind this clump it also was a bit further to the left of them also.
So there are my simple observations, totally unscientific and mundane which puts the sting in their tail. If your common garden variety schmuck can see discernable changes in sun movements and opposite hot/cold wind/sun variations which, during summer should not be so black/white chalk/cheese as they are whats the explanation from the schmucks WITH the scientific gear? Rhetorical (frustrated) question just to let some steam off.
230
All explained. According to BoMs own page Sydney (Observatory Hill) closed in Aug 2020. 😉
50
Which I mentioned at the bottom of the post with links to both datasets. So? The Heat Island effect is still very strong, and it is still amazing that the same area was warmer in 1859 eh?
81
Jo I guess my point was why is this site still collecting and releasing data when it is reportedly closed? UHI effect is a different, but significant issue. As we all know BoM or is that “THE BUREAU” or “The Bureau of Misinformation” is dodgy
00
2022-23: The Years Without A Summer
Experts™ shout, ‘Unprecedented! Never seen in my lifetime! It’s all our fault! The planet is dying!’ Except, and apart from:
1816 – The Year Without A Summer (Tambora, Indonesia)
1257 – Rinjani on Lombok, Indonesia
536 – Krakatoa? PNG? Central America? Meteor?
180 – Taupo caldera, New Zealand (BOOM!)
70,000 BC – Lake Toba, Sumatra, Indonesia
and on and on backwards in time immemorial…
Wet, cool, soggy easterlies continue drenching NZ, with more of the same next week. When people comment how ‘humans have changed the climate’, I laugh loudly (to gain an audience, as well as at the stoopidity of it all) then ask them when ‘cyclone season’ is [the what?! Nov-Apr], if they’ve heard of the Quarternary Ice Age [you’re living in it], or the Holocene [recent brief respite from previous glaciation, the termination of still being debated]. Some folk’s eyes glass-over, while on occasions I’ve had geologists & engineers & other realists strike up a
conversationchat regarding the immense age and cyclic qualities of this charming little watery volcanic planet.Must admit, sceptics are beginning to outnumber the believers… Hallelujah!
230
Just purchased
Global Crisis: War, Climate Change and Catastrophe in the Seventeenth Century Paperback – 15 August 2014
by Geoffrey Parker
on recommendation by my son – 48 Hours Audio or 1200 Page Tome – Chose the 1200 Oahe Tome
How to account for decades of worldwide war, revolution, and human suffering in the seventeenth century? A master historian uncovers the disturbing answer.
Revolutions, droughts, famines, invasions, wars, regicides – the calamities of the mid-seventeenth century were not only unprecedented, they were agonisingly widespread. A global crisis extended from England to Japan, and from the Russian Empire to sub-Saharan Africa. North and South America, too, suffered turbulence. The distinguished historian Geoffrey Parker examines first-hand accounts of men and women throughout the world describing what they saw and suffered during a sequence of political, economic and social crises that stretched from 1618 to the 1680s. Parker also deploys scientific evidence concerning climate conditions of the period, and his use of ‘natural’ as well as ‘human’ archives transforms our understanding of the World Crisis. Changes in the prevailing weather patterns during the 1640s and 1650s – longer and harsher winters, and cooler and wetter summers – disrupted growing seasons, causing dearth, malnutrition, and disease, along with more deaths and fewer births. Some contemporaries estimated that one-third of the world died, and much of the surviving historical evidence supports their pessimism.
Parker’s demonstration of the link between climate change and worldwide catastrophe 350 years ago stands as an extraordinary historical achievement.
And the contemporary implications of his study are equally important: are we at all prepared today for the catastrophes that climate change could bring tomorrow?
100
Satire is the best way forward, I only have to say global cooling has begun and everyone laughs.
170
I noted it a decade ago. Global Cooling is accelerating, especially South of the equator.
Three years ago I met a older woman activist spruiking Global Warming near the St. Kilda Pier. They had a horrible giant eviscerated robotic koala on a trailer for demonstrating Global Warming. So I stopped to ask her where this Global Warming was. And whether it was her personal experience in her many years. The rapid sea rise for example. No one has seen it in the last century. Nothing has changed. You could see she was thinking, comparing what she was told and what she absolutely knew to be true. Losing her religion. People need to believe something and many want to make a difference. This was just sad.
It’s amazing how good people passionately believe something and sometimes you can get them thinking with a simple question. I blame the Green political movement, those opportunistic unethical purveyors of anarchy and Marxism and fear. B*stards. Fascism is when big business joins forces with Marxism, something which is currently sweeping the world.
My concern is that there is no place apart from a few blogs where anyone is even interested in the truth. Certainly not the media. Russia is evil. China is good. Iran is misunderstood. CO2 is Climate Extinction. Joe Biden is not senile.
280
Ultimately a change in the weather, that cannot be explained by an increase in CO2, must eventually enter the MSM.
Opening lines of conversation at a gathering, all severe weather is climate change and climate change is a religion. This was put to me by a left wing zealot and the ambiguity brought a smile to my face.
71
Does mRNA destroy the human funny bone?
So many ‘inoculated’ people I know, who used to have a sense of humour, are now snappy and bitey, calling out any ‘fun-loving criminal activity’ as sarcasm, cynicism, or the big D-word. The more bass-ackward this world becomes, the more twisted my humour is: then again, ‘comedy’ always has a sad truth behind the laughs.
* fun-loving criminal activity, as in poking the borax, anti-zeitgeist, non-conformist, laughing in the face of adversity and/or the UN/WEF/etc.
70
Melbourne Latrobe Street closed Jan 2015 – Station Number 086071
Melbourne 1968 Days above 30C – 36
http://www.bom.gov.au/jsp/ncc/cdio/weatherData/av?p_nccObsCode=122&p_display_type=dailyDataFile&p_startYear=1968&p_c=-1481636851&p_stn_num=086071
Melbourne 1968 Days above 35C – 20
http://www.bom.gov.au/jsp/ncc/cdio/weatherData/av?p_nccObsCode=122&p_display_type=dailyDataFile&p_startYear=1968&p_c=-1481636851&p_stn_num=086071
Melbourne 1967 Days above 30C – 36
http://www.bom.gov.au/jsp/ncc/cdio/weatherData/av?p_nccObsCode=122&p_display_type=dailyDataFile&p_startYear=1967&p_c=-1481636851&p_stn_num=086071
100
The reason the temperatures have been lower is NOT because of rainfall but because of the change in the pressure patterns with more low pressure systems over the continent. Every record hot temperature at any of our capital cities and other coastal towns IN ANY YEAR will be seen to be caused by hot air from the inland. In Brisbane it will always be from the west or north west, the same for Sydney. Perth it will be with east or north easterlies and Melbourne and Adelaide it will northerlies or from the north west.
These airmasses will be coming from the centre of Australia and with the sun being overhead as far as 60 miles just north of Alice Springs in late December there is a lot of radiant heat coming off the inland deserts and mountain areas. I speak from having operated airline aircraft into Alice Springs and Mt.Isa in summer over many years as well as across the continent.
To get hotter maximum temperatures the hot air has to come from the inland and the synoptic situation will be the cause of where that air flows.
100
Is the region around Alice Springs heating now?
Will it soon move N/E/S/W and bring heat to some edge of Australia? Can it just radiate to the upper atmosphere such that the edges won’t notice?
Just curious. 🧑🎄
30
John,
In looking at The BOM, the temperature at 11 AM in Alice Springs is 28.2 C which is quite cool at this time of the year and with an E/NE blowing of around 25-30 k.p.h. it is giving an apparent temperature of 5 degrees cooler. The latest synoptic chart shows the wind veering to the S.E and coming from the east coast. It is not likely that surface air at Alice would radiate significantly higher with that air flow and most people don’t realize that winds can vary over a wide range with height. You can have the wind 180 degrees from the opposite direction 10,000′ higher.
The predominent wind over the continent is being influenced by the high pressure system south of Tasmania with winds flowing to the low pressure area in the Kimberleys.
60
I’m sure you also had humidity readings for flying, and they were just as important as temperature. Its very hard to change the temperature of humid air, while dry air will radiate heat very quickly.
Cape Town had the same weather, a wickedly strong cold wind from the SE off the Antarctic end, then in the middle of winter the most amazing warm berg wind from the North bringing heat down from the SW Africa desert. You could be sailing in a mild breeze and watching the Sou’easter coming towards you like a curtain, white caps and all. I never figured out how it could move slowly across the harbour, but once it hit you it was 30knots or more.
20
There are no readings of humidity required for aviation. Take off and landing data required is obtained from the local area pressure, temperature and wind direction and speed. Engine power settings on jets need to take into account or require pressure, temperature and aerodrome elevation
30
‘ … change in the pressure patterns with more low pressure systems over the continent.’
The subtropical ridge has moved too far south, leaving a vacuum for low pressure to hang about.
10
A very good example comes to mind. A couple of years ago in February I noticed that the temperature at Amberley in Qld was 29 C at 2.30 PM and at the very same time 23 miles to the west at Gatton it was 41 C –
a difference of 12 C.
The reason – the wind at Gatton was from the west at about 25 k.p.h. whilst at Amberley it was an easterly bringing cooler winds from the sea. It was not the cause of rainfall, CO2 or any other reason.
110
Yes indeed RK. I was once sailing south past Newcastle in a nice north easterly sea breeze. Quite quickly this changed to a north westerly. This was very hot & dry. I couldn’t help wondering if this was heat from the steel mills which still existed then, although I knew it was our desert interior breathing out.
50
Dont take the BOM’s word for it. Do what I did and download the max/min yearly average temps for your most local BOM station. Try to pick a station unaffected by urban heat effects- which rules out most of the capital city ones. Try a regional station with the longest recording history. I did it the cumbersome way and actually wrote down the figures and then refreshed the website for each year. You can do it via historical data archives for most weather stations. I chucked the data into a spreadsheet and the graphed it etc. Also did some stats on the data. What I found was the average maximum temp for my local city slightly increased over 130 years, but the average Min temp actually decreased by slightly more in comparison. Hence, the average daily temp ( Max + Min/2) showed a slightly declining trend line. This was an inland regional site in Victoria. When I did the same for a lighthouse ( Cape Otway) the opposite occurred – max went down, min went up. My conclusion for an average of 6 really good (non Urban heat effects) sites for Victoria was that the average temp has barely changed in over 130 years. It’s actually quite boring.
190
Ross,
No better example is the station at Cape Leeuwin in W.A. on the S.W.tip of the continent which has had no man made effect to influence it’s weather. The mean temperature there is around 23 C over 130 years and in fact the hottest was around 42.C on the 8th of February 1933. The day before it was 26 C and the day after it was 25 C. Obviously the wind was from the N.E. on the 8th and from the S.W. on the other days.
Interestingly the maximum temperature recorded for Darwin was in 1892 and in Alice Springs it was 1891. Cairns was 1923 and Brisbane 1940.
50
Ross mate – do not think “regional station”s in Oz are free of UHI – even BoM people published a paper over 20 YEARS ago
“Urban heat island features of southeast Australian towns.””
http://www.bom.gov.au/jshess/docs/2001/torok_hres.pdf
showing easily detectable UHI in small v small Vic townships. Catch up Ross.
The BoM ACORN data set is riddled with population and UHI.
10
Yep, should have said “relatively unaffected”. My local weather station is actually about 2 km from my house. I know of its history and can be certain it has as small an interference as possible. Same as Cape Otway. But all you need is for some new concreting to be done around the installation and it has been affected. Good words of advice Wazz.
00
So there’s some major flooding in the Kimberleys this week in WA. MSM news reports have already reported these floods as “never seen before” etc. They haven’t used that damn word “unprecedented” just yet, but it can’t be far away. I’m sure with some quick checking there will be some previous comparable floods in the history books. Maybe not for this specific river, but probably others in the area. So, just like the Sydney cool summer it’s been experienced before. From the chart it looks like 1892 and 1998 (?) were also extremely cool summers for Sydney. (or at least with lower max temps)
60
I have lived (42) years in Sydney’s north west and there is no question in my mind that the last (3) years that I’ve experienced here have been the coolest in my memory.
The ABC and their buddies at BOM or wherever, can put whatever spin they like on the weather vs the climate etc. But they will never convince me when my own judgement and my own instinct tells me otherwise . .
130
It was a brutal year. Even London was 8 degrees warmer 🙁
40
What day was that . .
30
Anyone else notice the correlation to UAH satellite temperature record, when it is smoothed? Like a sine curve oscillating with about a thirty year period?
20
Welcome to British Summers Down Under in SE Australia……………..
30
The Gulf Stream is amazing. Ten million tons a second of hot water at up to 9km/hr past a given point. 100km wide and 1km deep, more water than all the world’s rivers combined, it hits amazing speeds and is testament to the circulatory nature of both water and air.
And what has CO2 to do with this phenomenon? Nothing.
How important is this to the climate of Western Europe? Incredible.
If scientists concentrated on mapping the 3D behaviour and oscillations in all the world currents of this significance and turned that into surface temperature, we would understand the weather.
As it is, the BOM is just guessing, punting that El Nino and La Nina may or may not be significant. All those ‘models’ modelling the wrong things. Map the ocean currents and solar input and you have the whole story. And what matters for solar input is basically clouds and ice.
How is CO2 involved? As you can tell from BOM comments it is nothing compared to El Nino, only one ocean oscillation. That is because the heat in the oceans is 1400x that of the atmosphere because air is an insulator and 1/350th of the weight and radiates its heat into the night sky.
A super computer will tell you 2+2=3 if you program it that way.
140
You’ve nailed it Td . .
60
When I did my Geography GCE O Level in 1969. One of the questions was on the World Oceans and Sea currents. I knew this stuff off by heart. And I got an ‘A’. So I wonder, who marked the exam? Someone from the UN or some Climate Mad Mob. No, I don’t think so. In those days they had brains and used Science………..
https://www.youtube.com/watch?v=V83JR2IoI8k
60
Meanwhile in La La land at CSIRO this is their latest tweet “. As Australia moves to a decarbonised, decentralised & democratised energy system, a new generation of digital solutions is needed. #TeamCSIRO’s John McKibbin shares the three challenges that digital energy solutions can help us solve”. Can anyone explain what democratisation is? Or in fact, what a digital energy solution is, as well? A lot of people would probably like to give them a digital solutions- using the one finger salute. Our taxes at work.
60
Democratised is code for “we tell you when and how much energy you can use”. Digital solutions is code for “social credit system”. If you venture outside the allowed bounds of energy usage, then you’ll face consequences.
60
Why has no-one suggested sacrificing a few pollies to appease the climate change god?
Remember the Gates equation: P*S*E*C=CO2
Pollies Sacrificed Equals Climate.😎
60
Somebody take Jabcinda… please, take her…
NZ’s politricksters have been on ‘summer’ holiday for a month, with another month to go, yet the country is tickling along quite happily without them… JUST STOP POLLIES!
80
And all it took was a La nina and Southern oscillation (SOM) circulating increased water from the Tonga explosion through the NT, Indian Ocean, Antarctica, back up the Pacific and west across our east coast. Who knew to fix Australia’s water shortage all we needed was to explode Togan volcanos.
50
I told you we were doomed.
50
According to Milanković theory, the Earth’s climate should be approaching the next ice age due to astronomical orbital oscillations, but we have plenty of time to prepare.
20
Agree e+g,
But the cycles he identified are measured in thousands of years.
Prof Weiss identified just two cycles of 250 and 65 years which accurately mapped the climate variations over the past 2000 years. His analysis points towards an LIA event much earlier.
https://m.youtube.com/watch?v=l-E5y9piHNU
21 minutes.
Cheers
Dave B
40
“…I could not believe Sydney would go a whole year without a single hot day,…”
Jo, you Aussies must be a pretty hardy bunch when it comes to heat. Where I live it is dry, so 32C isn’t uncomfortable the way it would be if it were humid. But nobody would suggest that it wasn’t hot.
🙂
60
It’s 33C in Perth today and it’s not hot. The average temp here for January is 31C, so this is just a mild summer day. Unless we get a 37C soon, it doesn’t feel like summer has arrived…
But you are right, and the dry heat from the Great Sandy Desert is not so bad at all. The humidity would be so much worse.
It’s all relative isn’t it? We feel cold at 5C. You probably don’t!
161
You’re right about it being relative, Jo. When we arrived in Oz from Blighty, back in ’99, we thought Canberra winters were beautiful – not that cold plus the miracle of sunny days in the middle of winter. We then moved to QLD and now, fourteen years later, we think 10C is bloody freezing, stay indoors weather.
On this theme, I occasionally try to talk Mrs Wife into a trip back to Europe in winter, using fond memories of nighttime markets in France, brightly lit, with hot food sold from carts and everybody elegantly rugged up as they strolled between the beautifully-decorated shop windows and stalls. Of course white snow lies everywhere and crowds are drawn to the glowing embers of the guy roasting chestnuts.
But of course she remembers equally vividly the frigid cold icing our cheeks, the chill wind making our eyes water and the sweat building under four layers of thick clothing, plus hat and gloves. She also reminds me that the crisp white days are not guaranteed, most days more often than not just cold, wet, dreary and windy.
The last time I put forward this motion, it was supported by the board and I was authorised to book a ‘French’ holiday. In New Caledonia. Bonnes vacances!
80
One day of 38 this summer so far the rest low 30’s or high 20’s .
20
A very timely post. I live in Sydney – right now everyone talks about how unsummerish it is. But I am stunned that it didn’t get over 32C for an entire year. So why aren’t we seeing this in the MSM? What a hopeless lot they are. Journalists rate below used car salesmen.
100
This seems an ideal time to declare that Observatory Hill is poor site to determine Sydney’s temperature , and that perhaps inland Parramatta or Penrith would be far more indicative. Time to move the goalposts.
40
Back when I worked with a research group active in the cities space, we discussed joining with Parramatta Council to look at the ‘urban heat island’ problem, something affecting them far more than the near-water areas of Sydney. They had a pretty good handle on what the problem was, and what caused it.
40
Sydney Obs Hill is the worst site for temperature measurements because areas >10km inland (where most people live) are much hotter during summer, often times more than 10°C hotter. I recall many times during Spring/Summer coming from the City where it was 27°C or so and getting off the train inland to +40°C temperatures.
However, this post which talks specifically about Observatory Hill applies to all inland areas, which also had their “coolest” hottest day of the year in 2022, all around 36°C.
Parramatta is the most representative as it’s in the middle of the Basin. In an average year:
1. The highest temperature in Parramatta is 41°C,
2. 4-5 days would crack the 100°F (38°C)
3. 13-14 days would crack the 95°F (35°C)
4. 29-30 days would crack the 90°F (32°C), all much more than Obs Hill.
Some years we see 43°C or 44°C and others only 38°C or 39°C. This year, the highest temperature was only 35.7°C, which beat the previous lowest record of 36.1°C (records since 1967). Last summer was also not great, where the highest was only around 37°C. So we’ve had a run of really cool summers.
50
Jo, it’s worse than you thought.
So far this summer we haven’t had a day above 29°C in Sydney
And long range weather forecast for rest of Jan and Feb predict that won’t change.
If so, first summer ever without a day in the 30’s.
51
Craig, tell me more, please. Where that data is coming from?
31
This should be biggest story in Australia, but all the journo’s on holidays & all we get is which celebrity is wearing a G=string on the beach.
30
Down the pub this arvo with Sydney test pretty much washed out & it is freezing. How much longer can the global warming myth last?
30
Hottest December Day 2022 – 29.7°C http://www.bom.gov.au/jsp/ncc/cdio/weatherData/av?p_nccObsCode=122&p_display_type=dailyDataFile&p_startYear=2022&p_c=-876852222&p_stn_num=066214
Jan 2023 to date – hottest 28.1°C.
http://www.bom.gov.au/jsp/ncc/cdio/weatherData/av?p_nccObsCode=122&p_display_type=dailyDataFile&p_startYear=&p_c=&p_stn_num=066214
Jan 2023 – long range forecast
https://www.weather25.com/oceania/australia/new-south-wales/sydney?page=long-range
Feb 2023 – long range forecast
https://www.weather25.com/oceania/australia/new-south-wales/sydney?page=long-range
81
Thanks Craig, so this summer so far has certainly been a non-event in Sydney.
We will keep watching those numbers with a new interest…
51
Good find Craig and let’s hope the BOM don’t play silly fellas for the rest of the summer for Sydney.
But interesting times indeed.
30
Craig and Jo some interesting rainfall data for NSW from 1900 to about 1946. Note that the moving average line was below average from 1900 to 1946, but 1896 to 1900 would’ve been below average as well.
For NSW 1950 was the highest rainfall ever and 2022 just beat 1956 by about 4 mm.
So what caused that super drought period from 1900 to 1946? Of course co2 levels were very low before 1950.
http://www.bom.gov.au/cgi-bin/climate/change/timeseries.cgi?graph=rranom&area=nsw&season=0112&ave_yr=8
40
La Niña brings cloudier and wetter conditions which means lower maximums but also higher minimums.
Temperature anomalies are a much more useful metric, and they confirm that Sydney was slightly cooler than average last year. http://www.bom.gov.au/climate/history/temperature/
15
Yep, and with no temperatures over 32C.. for the first time since 1859.. ..
Even the much agenda-adjusted BoM once-was-data says it was cooler
DESPITE all the massive urban expansion and increase in atmospheric CO2 (which you have proven has zero warming effect) 😉
40
The cloudier weather cools the day and warms the night, so temperatures slide during La Nina.
The Southern Annular Mode remains strongly positive, so we can expect cool wet conditions to continue for Southern Australia.
20
‘In a positive SAM event, the belt of strong westerly winds contracts towards Antarctica. This results in weaker than normal westerly winds and higher pressures over southern Australia, restricting the penetration of cold fronts inland.’ (BoM)
Ah yes, but cold air emerges from the bottom of high pressure in the Southern Ocean near Antartica.
20
Blocking high pressure in real time, just so you know where the cool winds are coming from.
http://www.bom.gov.au/fwo/IDY65100.pdf
30
@Simon
“Temperature anomalies are a much more useful metric,…”
No, Simon. Not really…
https://m.youtube.com/watch?v=kwIixU1JyDU
20
“La Niña brings cloudier and wetter conditions which means lower maximums but also higher minimums.” – Simon
Yes, cloudier and wetter conditions, whatever causes them, do affect temperature, but not in the direction warmists say they do…
https://m.youtube.com/watch?v=Y2K1uHvfaek
20
Cherry Picking Nova??? So lame!!
Try these …
https://www.smh.com.au/world/europe/totally-insane-thousands-of-records-shattered-in-historic-winter-heat-20230103-p5ca5i.html
06
Congrats James, you’re defending your whole religion with cherry picking a warm week on a tiny slice of the Earth, while I was pointing out media bias.
But welcome, stick around and get ready to get red pilled.
51
Don’t get cocky, kid.
https://www.weatherbell.com/video/the-saturday-summary-13214944?full
The warmth in Europe is most likely temporary.
10
We have had a pleasant summer in the tropics, but I’m not so gauche that I would say that WORLD temperature is measured in my back yard.
20
[…] below the fold, check out Jo Nova, with a post on Sydney not having reached 90F all […]
00
Funnily enough, the New Zealand evening news on channel One tonight showed a map of the Earth with almost all areas coloured red indicating hotter than average (or hotter than ever before), except Australia which was covered in blue. Of course, it does not matter that Australia was not hot in 2022 (relatively speaking), because the flooding is proof of climate change [/sarc]. We all know that it never flooded in Australia before [/more_sarc]. Accordingly, you can be sure that 2023 will offer further proof of climate change regardless of the temperature.
Flooding in California on tonight’s news too. Another place where it’s often too hot and dry, or else too wet and flooding.
10