Remember the nomadic solar panel that appeared a few meters due south of the Sydney Observatory thermometer at the same week as the city ended it’s coldest streak in 140 years? Well Craig Kelly, who took the original photos, went back and now its gone.
Today there is just grass and shrubs to reflect the midday sun towards the back of the thermometer box.
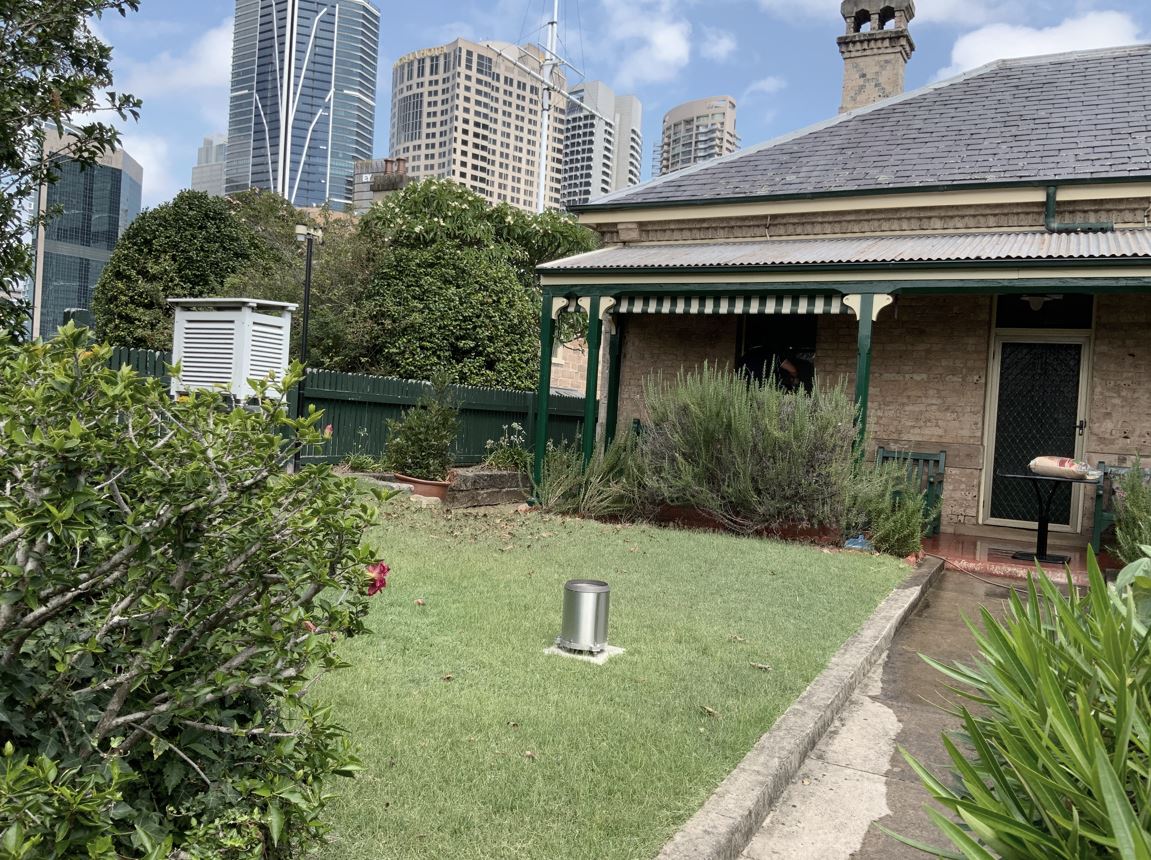
Photo by Craig Kelly 27th January 2023
As Craig Kelly said: “The fact that it’s disappeared shows that it was never installed – someone at the BOM just happened to grab a random solar panel and place it at such an unexplained position…”
So much for expert rigorous science accurate to a tenth of a degree.
Kelly explains that this site is nearly invisible: “The only way you can see it is by holding a camera above your head – it’s not visible to the eye – even if you were 6’6” and standing on your toes you can’t see over the fence – and the Observatory is closed to the public for some unknown reason.”
Perhaps the BOM just thought no one would notice, and “it’s for a good cause, eh?” We can’t have the punters thinking Sydney was cooler today than in 1883.
As I said:
The solar panel was exactly due south of the Stevenson screen on exactly the right day. If, hypothetically, someone wanted to leave a reflective object pointed at the box at midday, that’d be the place to do it.
Look for the handy BOM guidebook:
“How to create temperature records with spare parts lying around the house”
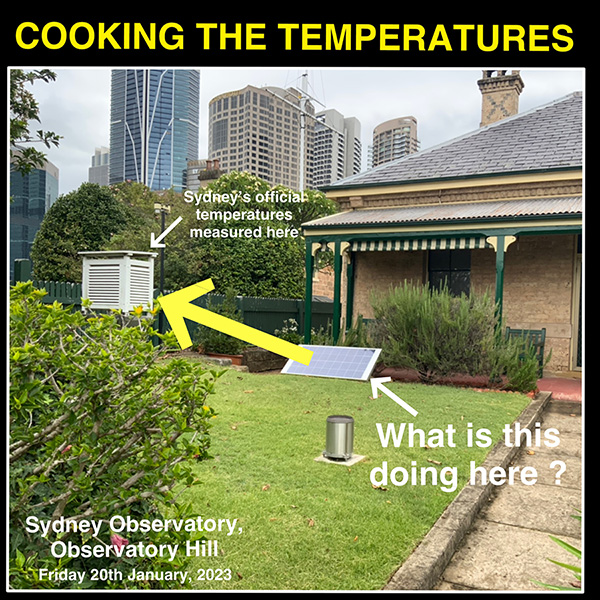
That’s a strange spot to leave a panel… | Photo by Craig Kelly 20th January 2023
It’s the year without a summer for Sydney. There’s only been one day above 30°C since Feb 21st last year in Sydney, and that was a day when the wandering solar panel was visiting the thermometer, seemingly connected to nothing and leaning on a bush.
Guilty, what? Will the BOM retract the 30.2°C “official temperature” or do secret homogenisation adjustments to figure out what the temperature might have been with thermometers 800 km away?
I wonder how often this is happening at other sites around Australia? Time to start looking?
By onlookers, not easily seen,
At just the right angle to lean,
One odd solar panel,
Some heat for to channel,
Straight on to the Stevenson screen.
–Ruairi
Solar panels only absorb 22% of the sun’s energy. They can reflect plenty of light, much more than grass would, and it’s possible that extra light heated up the Stevenson screen artificially.
…even if somehow this solar panel didn’t change the temperature on the day, it tells us everything we need to know about the lackadaisical BOM standards. There is something profoundly dishonest about claiming they do expert science while not maintaining sites, or explaining how large the uncertainties really are, and how meaningless most “hot records” may be.
The site is a terrible site even on a good day. Ken Stewart notes the BOM’s own instructions say there should be a 30m buffer around the thermometer screen.
__________________________
Google Maps of Sydney Observatory
Sydney Observatory Temperatures in Jan 2023 | Long term records of BOM site ID 066214 | Site metadata and maps | Latest Sydney Observatory temperatures (last 72 hours.)


I notice the sidewalk is partly wet in the one photo. Sprinkler system perhaps? Another potential influence on local temperature at the station. If automated I’d be curious when it was installed and what time of day it is scheduled to go off.
360
And that is another issue. Lawns used to be watered during the afternoon until the 90s. I remember some friends commenting in the early 80s about the lawns at the airport site being watered around 3 O’Clock on the hottest summer days. Might have been to stop it from burning but they seemed to think it was to keep the maximum down and stop scaring off Melbourne tourists. Either way, it would have a bigger effect than the solar panels.
Also, there are vineyards near the Mildura Airport that would especially affect maximum temperatures on days with a NE wind during January. It would have been mostly flood irrigation of sultanas until the 70s, once a month. Then overhead irrigation once a fortnight, then less watering of wine grapes, drip irrigation, and abandoned vineyards. There should be a noticable trend of cooling after 1980, then warming from the late 90s when there is a NE wind. Zero effect for a NW (except for the lawn watering).
170
A sprinkler system in Sydney – why?
80
Believe it or not, once upon a time (like 3 years ago) we used to get up to three weeks or more without rain in Sydney and here in the Blue Mountains and watering a garden was a necessity. Not so the last three years, thanks to three successive La Ninas and over 2m of rain last year.
40
It looks like someone may be hosing down the verandah. There’s a hose across the front step and a vague image of someone in front of the window (back on) with maybe a hose nozzle in their right hand.
20
I am more interested in the way the shrubs have not recovered since the solar panel has been removed. If the solar panel was there for just a short time they would show more growth towards the lawn and at the time of removal they would again stand up straight.
So how long was the panel sitting in that position? And was it removed from time to time to keep it away from annoying peeping Toms?
00
It’s OK.
The BoM have magical and secret Al-Gore-rithms in their “models” that can correct the defective data recorded when the solar panel was there, by their “homogenisation” process.
But no one is allowed to know the full methodology of what they actually do to the data (it’s a secret) and can’t reproduce the results, so it’s magic, not science.
551
“The homogenisation algorithm” was touted as a remedial in the original post comments:
Well, there’s been two “material site change[s]” now.
Have both been “detected and corrected” ?
300
Bureau of Meteoro-jiggery-pokery SOP.
90
From Simon above >”Any material site change should be detected and corrected by the homogenisation algorithm”
In a subsequent comment Simon asserts “It is documented” citing BOM’s ACORN-SAT version 2 documentation.
Yes the methods are documented – 3. HOMOGENISATION METHODS page 5. There are 5 methods run in parallel in V2. Critical is this:
Jo has written extensively on “well- correlated stations in the region” so nothing to add on that, I’m pointing to the second bolding for this site change (appearance and disappearance of solar panel) which is breakpoint detection.
Simon asserts (my clarification):
This is both a correct and a false statement. Yes they come out with nearly the same time-series results, no they certainly do not come out with nearly the same breakpoint detection results. Note the distinction between time-series and breakpoint detection. Simon and subsequent replies miss this distinction.
And see following comment.
31
Anyone who has compared breakpoint detection and adjustment at a specific time at any one site over multiple organizations (I have) knows full well that results differ and can be any of the following:
1) No break detected.
2) Break detected – no adjustment.
3) Break detected – positive adjustment (size differs).
4) Break detected – negative adjustment (size differs).
I’ve compared BOM, NIWA, NASA GISS, BEST and NOAA GHCN. So have others to a far greater degree e.g. Paul Homewood, Kevin Marshall (Manicbeancounter), Euan Mearns and Roger Andrews (deceased).
Euan Mearns:
Temperature adjustments in Australia
https://judithcurry.com/2015/03/17/temperature-adjustments-in-australia/
Kevin Marshall:
Reykjavik Temperature Adjustments – a comparison
https://manicbeancounter.com/2015/02/23/reykjavik-temperature-adjustments-a-comparison/
Kevin Marshall following Paul Homewood:
Is there a Homogenisation Bias in Paraguay’s Temperature Data?
https://manicbeancounter.com/2015/02/08/is-there-a-homogenisation-bias-in-paraguays-temperature-data/
Worst case I’ve found is the GISS adjustments to Gisborne Aero NZ where they obviously just adjusted to fit their CO2-forced climate model (ModelE).
At least BOM desists from that type of overt statistical fraud. But compare ACORN to BEST to GISS to GHCN – there is no breakpoint consistency whatsoever.
50
Richard
When the code for Mod3el E was forced to be released it was not released in a runnable form but bits and pieces, some assembly required. An extreme example was the need to deal with “little endian” and “big endian” modules.
Chiefio is one that managed to put it back together –
https://chiefio.wordpress.com/gistemp/
His conclusion was that it was “dumber than a tomato” as explained first up
30
Ian, I spent some time years ago with the ModelE code browser which was a very good tool to navigate around the modules and copy/paste in online discussions. Can’t access it now at the GISS website. Referenced here:
Another NASA/GISS ModelE Code Fragment
https://models-methods-software.com/2008/01/07/another-nasagiss-modele-code-fragment/
Code browser hotlink “not found”. Don’t know why the facility was removed but I can guess…
20
It’s not just the single 30.2C datapoint at Observatory Hill Sydney that would trip a breakpoint detection algorithm, it’s the series of data either side for whatever period the method stipulates.
Going by Craig Kelly’s tweet date and Jo’s post the solar panel was there sometime prior to 23 Jan to sometime prior to 31 Jan. By assumption the comparison would be something like 10 days of data after the break (when panel appears) to 10 days prior. This is the first breakpoint (Break #1).
The second breakpoint (Break #2) is when the panel is removed. So maybe 10 days prior to say 30 Jan compared to 10 days after.
I doubt 10 days of data either side of either site change (Break #1 and Break #2) would be statistically sufficient to trip the breakpoint detection analysis algorithm so the 30.2C will not be corrected i.e. it will remain in the data.
Menne and Williams (2009) uses the term changepoints and refers to monthly data (not daily) – see next comment.
30
Homogenization of Temperature Series via Pairwise Comparisons
MATTHEW J. MENNE AND CLAUDE N. WILLIAMS JR.
http://www-personal.umich.edu/~eoswald/Menne2009_QC_algorithm_4USHCNv2.pdf
And,
So the 30.2C and the 10 days of data (or whatever) while the solar panel was in place will remain in the data series by my (brief) reading of M&W09 – contrary to Simon’s Jan 23 assertion upthread.
40
M&W09:
I very much doubt the placement and removal of the solar panel would be entered into the station history record of Observatory Hill.
Therefore would come under the category of M&W’s “undocumented changepoints”. See M&W:
Of course, and given the short duration, will never be applied in this case.
30
Me >”So the 30.2C and the 10 days of data (or whatever) while the solar panel was in place will remain in the data series by my (brief) reading of M&W09 – contrary to Simon’s Jan 23 assertion upthread.”
I’m wrong I think. Yes the comparator series must be homogenous for 24 months either side of a break. But only “segments” of neighbouring series are used for adjustment – I missed that.
Don’t know the length of those segments. That would determine the sensitivity of adjustment i.e. accept/reject criteria and whether applicable to 21 days of data (and counting) in this case.
This is not to say I subscribe to “homogenization” of observed and recorded data without site history and using neighboring comparators – I don’t.
Maybe with clear identifiable documented changepoints as in NIWA’s 7SS. The NZCSC v NIWA court case was only in respect to such breaks (mostly site moves) and the respective statistical methodology for adjustment – NZCSC’s strict application of Rhoades & Salinger (1993) versus NIWA’s somewhat arbitrary application of same. The actual breaks however were well documented and non-contentious.
NZCSC statistical application of R&S93 here:
Statistical Audit of the NIWA 7-Station Review
https://www.climateconversation.org.nz/docs/Statistical%20Audit%20of%20the%20NIWA%207-Station%20Review%20Aug%202011.pdf
Appendix A page 30
The Rhoades & Salinger (1993) Method
Much easier to grasp than the Menne and Williams (2009) method.
10
Observatory Hill Sydney is SITE 66214.
Data here:
Weather Station Directory
http://www.bom.gov.au/climate/data/stations/
Step
1. Weather Station Number: 66214, 0 km
2. Data type: Temperature maximum, Daily
3. Download data
Site, Year, Month, Day, Max
IDCJAC0010,066214,2023,01,08,25.2,1,N
IDCJAC0010,066214,2023,01,09,27.3,1,N
IDCJAC0010,066214,2023,01,10,26.6,1,N
IDCJAC0010,066214,2023,01,11,27.0,1,N
IDCJAC0010,066214,2023,01,12,27.1,1,N
IDCJAC0010,066214,2023,01,13,27.3,1,N
IDCJAC0010,066214,2023,01,14,26.9,1,N
IDCJAC0010,066214,2023,01,15,28.6,1,N
IDCJAC0010,066214,2023,01,16,29.2,1,N
IDCJAC0010,066214,2023,01,17,28.6,1,N
IDCJAC0010,066214,2023,01,18,30.2,1,N
IDCJAC0010,066214,2023,01,19,20.3,1,N
IDCJAC0010,066214,2023,01,20,22.0,1,N
IDCJAC0010,066214,2023,01,21,25.5,1,N
IDCJAC0010,066214,2023,01,22,21.7,1,N
IDCJAC0010,066214,2023,01,23,27.0,1,N
IDCJAC0010,066214,2023,01,24,27.9,1,N
IDCJAC0010,066214,2023,01,25,28.4,1,Y
IDCJAC0010,066214,2023,01,26,29.5,1,N
IDCJAC0010,066214,2023,01,27,28.3,1,N
IDCJAC0010,066214,2023,01,28,29.5,1,N
10 days prior to 30.2 and 10 days after.
Either, the solar panel had no effect. 30.2 on 18 Jan was a one day spike.
Or, solar panel had effect up to 18 Jan but panel removed immediately(?). 19 Jan (20.3) was 9.9C cooler than 18 Jan (30.2).
Unless there is an entry in the site history re the solar panel, who knows?
This is raw data – probably also ACORN SAT final series.
40
Out of curiosity, tried to access GHCN Observatory Hill ID:ASN00066062 daily data but neither access method works for me – “issue” apparently:
https://www.ncei.noaa.gov/products/land-based-station/global-historical-climatology-network-daily
GISS only has monthly GHCN up to 2020:
Sydney Observatory Hill (33.8607S, 151.2050E) ID:ASN00066062
https://data.giss.nasa.gov/cgi-bin/gistemp/stdata_show_v4.cgi?id=ASN00066062&ds=14&dt=1
Interesting GHCN adjustment in the early part.
10
The BOM site has been intermittent for a few weeks I think. Seems to recover, but is frustrating.
10
Just doing their bit to help Al Gore “boil the oceans”
200
Oh come on everybody, look on the bright side – the BOM have just proven unequivocally that PV’s are 100% effective at performing their intended functions!
160
What’s with all the homogenisation and adjustments. The temperature is the temperature
20
Would it be possible to experiment and replicate the positioning of the solar panel on a similarly placed Stevenson screen and see what the effect it has on the recorded temperature.
Not perfect but it might give an indication of the magnitude of the effect.
Any volunteers with a Stevenson screen and spare solar panel lying around?
10
Well, we can’t, because the BoM simply deleted all data from before 1910 from the official record, even though thermometers before that were suitably accurate.
We’ll assume the predecessor agency had the same mercury thermometer technology available as the US weather bureau:
520
While I agree that the present BOM is grievously perverting the temperature record, it was the BOM in 1909 that deprecated the temperatures before that out of an abundance of caution. You see they were scientists in those days and they had over a number of years standardised all measurement sites to having Stephenson screens. They didn’t want to risk having inaccurate measurements. I think they took the task of measurement and the requirement on a scientist of scrupulous honesty in those days.
230
Stevenson screens may have been in use in Sydney & Melbourne in the 1860’s, possibly earlier. Whatever they used the figures were good enough to be used in the HADCRUT temperature series since 1858.
The BOM was formed in 1908 so had nothing to do with standardising measurement methods, although some of their personel may have had a part. WA standardised on Stevenson screens in the 1890’s (after the economy improved following the gold strikes) following other States.
So most States had figures from Stevenson screens for 20, even 30 years before the foundation of the BOM, yet these are rejected. Bureaucratic arrogance?
If they wanted to do something useful they could separate out those records. Would be far more useful than the time spent on ‘homogenising the figures’.
210
You are correct Graeme No.3 – there is much evidence of these pre BoM Stephenson screens around the various colonies.
In June 2010 I published – Late 19th Century photographic evidence of the Stevenson Screen in Australian meteorology
http://www.warwickhughes.com/blog/?p=604
90
Yes your site is great – the thing is though that the mindset of the 1909 bureau was scientific and abundantly cautious. Today they are just liars.
140
What really annoys me is the BOM 1909 annual report is no longer available online. It used to be. Somehow it’s disappeared. Otherwise I would post a link to it. I’ll have to go to the state library and look it up sometime!
90
It mentions in
https://www.biblio.com/book/weather-watchers-100-years-bureau-meteorology/d/943891124
that Sir Charles Todd was an enthusiast of the uptake of Stevenson screens. As Darwin was in his department it would be a fair bet that it had one much earlier than some allow too.
30
This is true. They were using Stevenson screens before 1908. But not everywhere – there were sites not in shade (like today) there were sites with inferior types of screens. In 1909 they standardised it (read the 1909 bom temperature record this is what it says)
I am not making this up it’s not a surmisal it’s a fact. I know it doesn’t fit the narrative exactly but it’s the truth; I checked it out in the temperature gazettes myself.
And while one could go back through the previous records and work out which old stations used Stevenson screens, I would trust the 1909 bureau.
It’s no excuse for the modern bureau of meteorology deleting 1909 temperature record viz this Jennifer Marohasy article:
https://www.spectator.com.au/2020/07/revealed-the-true-hottest-day-ever-recorded-in-australia/
70
Oh You mean the BOM in 1909 was exhibiting bureaucratic arrogance ! Yeh maybe – you could be right. A matter of pride really.
40
G#3,
Intuitively, one might be neat and choose 1900 as the ACORN-SAT adjusted temperature data set start date. ACORN-SAT emerged around year 2000, so there was abundant earlier data by then, on which to design it and it’s start date.
But no, 1910 was chosen for the start date.
Two broad possibilities come to mind:
1. There was too much missing or poor data, Australia-wide,1900 to 1910.
2. There were some abnormally hot years 1900 to 1910 that, if included at the start of the series would lessen the calculated warming trend.
From what I have read and calculated, I lean towards 2.
Of course, there might be another explanation.
A big, current problem is the continued unwillingness of BOM to engage in any scientific debate about matters that might be found “inconvenient”.
What sort of scientists work for a group that clams up on discussion of potential problems?
Particularly when the data are paid for by citizen taxpayers, where is any authorisation for BOM to censor?
Their role should be to serve the public, not censor comment. Geoff S
30
Reply to Panda – When I met staffers(temperature data experts) in BoM in 1991 there was a popular view between them that the Stevenson Screen was introduced to Australian meteorology with the formation of BoM. After that I hunted through their library shelves and found copies of the minutes of the Intercolonial Conferences where Met. was discussed 1879, 1881 & 1888 and depending on the colony there were various policies on using the Stevenson Screen.
30
Oh for a government minister to have the guts to audit this sham of a science organisation. Greg Hunt didn’t want an audit when he had the chance because it might reduce peoples trust in the BoM. They had lost faith and that is why they wanted the audit you fool. But Greg was a WEF graduate and had been innoculated against real data believing only in the dreaming of the elites.
610
An honest MSM would also be helpful. Imagine a young enthusiastic journalist exposing the mighty BoM as a witches coven full of fakery and magic. The big expose on 4 Corners of scientists fiddling the data to gain additional funding but causing vast expenditures to solve a problem that was artificially created. The walk of shame as bureau manipulators are frog marched into court for altering public data. Jail time.
520
Assuming rationalism takes over from the madness currently dominating the world, history will not be kind to Greg Hunt, WEF graduate.
He was the one that was directly responsible for:
A) Stopping an inquiry into data tampering at the BoM.
B) Banning safe antivirals for covid treatment or prophylaxis. (HCQ and IVM)
510
Well yes. And a few more can be added to that as well.
However, the next thing will be the diversion.
That might comprise an allegation that Craig Kelly jumped the BoM fence, installed the PV pannel, jumped back over, took the shot and was last seen smirking all the way down Pitt Street.
He’ll be charged with trespass.
The ABC will find two witnesses both of whom helped him jump the fence. One of them subsequently topped himself, but told his mother before he did so that Craig didn’t really jump the fence – but that’s immaterial.
An international green organisation will surreptiously tranfer large sums of money into an anonymous Australian bank account which will be used to fund the case against Craig the fence jumper.
180
Funny!! Sounds so similar to George Pell accusations, but I suspect that was your intention. 🙂
50
A selfie stick with a camera connected down to the recording instrument [ iSpy phone] perhaps?
There are several bloggers who do Walk & Talks that way.
01
And the woke Liberal Party in Victoria want him to be their President 🙁
20
After homogenisation, the temperatures affected by the solar panel will be spread across all surrounding areas, and then beyond.
310
No doubt there will be a technical update released on
“The Solar Panel Homogeniser”?
90
The actions of the BOM at Sydney Observatory are negligent bordering on criminal.
One has to be concerned for all of those other sites around Australia that they ‘manage’.
360
I think it’s at the point where NO BoM data can be trusted due to either (a) bad site management or (b) far more serious is their mistreatment of data by the scientifically and statistically invalid process of “homogenisation”. Plus (c), they have a political, not scientific agenda, and that is to “prove” catastrophic anthropogenic global warming.
390
Why data “homogenisation” is invalid.
https://jennifermarohasy.com/2016/02/12910/
140
My guess would be that they just sit in their offices behind computer models…
.. and don’t manage the temperature sites AT ALL. !
100
“Birds of a feather” etc.
In philosophical sense & possibly in a “biblical” sense, those in the pay of the BoM & the ABC share a lot of the same “genes”.
If there were ever such a thing as a gene sequencing psychological paternity test, I’d bet there would be massive peaks for “SorosBot DNA” [ they don’t all have ALL have PINK HAIR & kneel for George F ]
In a serious sense, I am certain the data harvested from the net activity/iSpy is snarfed up & sold on to the private contractors ” advising” the political campaign operators. They have been on top of it for a decade or so [ Cambridge Analytica +++++ etc.]:-
See Millie Weaver’s Shadowgate [ & never lose sight, because the 5 eyes don’t]
https://www.bitchute.com/video/sAPNi8wBVshM/
I wonder how many One Nation voters are on either of their payrolls?
Bets?
I wonder if there are contract services, accessing said harvested data history,
for ” Employment Filtering?
Ahem, …not that that would be moral or legal of course.[ but you don’t want any deep throat/breaking voices in the “choir”]
& again / sarc.
30
Great article by the way! When I tell un-red-pilled people about things like this though they simply won’t believe it, don’t want to know.
390
It’s beyond negligent now – it is fraud.
340
Thanks again to Craig Kelly and to Jo Nova for trying to tell us the truth about our very lefty, unscientific BOM.
But will anybody have the guts to expose this criminal activity in the MSM and then supply any updates until we understand the full story?
320
The Met Office is no better, they verified a new UK high record (since surpassed) at the Cambridge Botanical Gardens, even though the ground had been freshly tilled.
https://en.m.wikipedia.org/wiki/United_Kingdom_weather_records#/media/File%3ACambridge_Botanic_Garden_Weather_Station_from_the_West.jpg
220
Dark, freshly-tilled ground, heat absorbing and very active organically (microbes etc) will put out a lot of heat !
151
Many moons ago, I went gliding with a chap I knew, he pointed out the lift available from recently tilled bare fields with dark or red soil, the glider was fitted with a gadget that emitted a tone that rose as the aircraft rose, it was easy to feel and hear the lift from thermals as we traversed those paddocks, several eagles and hawks were on to it also.
70
Note the new high temp in 2022 in UK was on Coningsby airfield, with southerly breeze, at the recording site to the north behind the 8000ft (heat absorbing) tarmac runway and taxiway with the air traffic building and aircraft hangers behind as heat absorber/reflectors. Of course it was an artificially hot location and the site failed all met recording parameters. PS. I know the site well as ive flown in and out many times with afterburners lit. But the heat drifts across the met recording site from those jet engines are obviously irrelevant to an alarmist artificial heat record.
110
And the definition of an “Expert” is a drip under pressure!
100
Haven’t seen a 40C day in my area since Jan 2021. Normally get 4-5 every summer. About to hit 18C at the end of the week – crazy! Rarely goes under 30C here during summer.
This is what happens when you buy a house with a swimming pool in Jan 2021. Hardly get the chance to use it because it is too cold! I have single-handedly stopped global warming. You are welcome.
310
We’ve had no days of 40C this year yet. There were none the previous two summers; just one day that nearly made it last year.
140
Annie
O/T but what was that source of books you mentioned a while back?
TIA
30
Which books were those another ian? I’ve a memory block atm!
20
Annie
Thanks
IIRC it was a source of second hand books, might have been overseas
00
I don’t remember mentioning it, another ian, but will try to get the details from the chap who runs the secondhand bookshop in town. He gave me a card ages ago but I’ve mislaid it, or even chucked it out as it was never needed.
00
Global cooling and cold in general is what kills people, not global warming or warmth.
150
Trevor
Do you reside in Canberra?
I was there for a week recently. I had blankets on every night! I qualify this by admitting I live on the Sunshine Coast.
140
With the exception of two nights of normal summer warmth I had to add a blanket in recent times and last night it was needed.
Mid North Coast NSW.
100
Amusing, I stopped changing channels on television to watch a weather report recently and the weather presenter mentioned a possible 30 deg C day and added “wow”.
They must be desperate to maintain the hottest day commentary hoping that global warming scare does not fade away from viewer’s minds.
210
I can remember 30 degree days in Sydney in June, in the 70s
60
So, did Craig Kelly get a tipoff? Because it seems unlikely that he was wandering by and thought to take a photo. Particularly when the fence is so high. There’s more to this story than meets the eye.
70
See 4.2.1 above.
🙂
30
I asked Craig that question yesterday. I assumed someone had tipped him off, but no. There are five million people in Sydney but not one outside the BOM thought to poke a camera over a fence. (And I guess, in the world we thought we lived in, why would they?).
Craig Kelly:
When we think they can’t be craven and duplicitous or religious enough to break the rules…
This is why I’m thinking more of us should be visiting our local BOM site.
140
Ross, that’s exactly what happened as Jo described.
I’ve never been to Observatory Hill in my life, but have driven past it hundreds of times.
It was only that I wanted a close up photo of Stevenson Screen that I put the camera above my head and took the photo;
80
I keep asking warmists and they can never tell me, assuming it was actually warming, when in human history has natural warming ever been a bad thing?
Civilisation thrived during the natural warming of the Minoan, Egyptian, Roman and Medieval periods.
220
Do you really keep asking them? Do you ask people who know stuff? Here are a couple of answers, though there are many
https://en.wikipedia.org/wiki/Deforestation_during_the_Roman_period
https://www.jstor.org/stable/827881?seq=3#metadata_info_tab_contents
217
Both links you posted relate to mismanagement of the land, nothing to do with any adverse effect of natural global warming.
210
They relate to over population and civilisation expansion. Nice try at deflection.
123
Oh, I see, so your real objection is that global warming, even when natural, causes an expansion of civilisation and increase in the population….
210
I never raised an objection. I responded to your silly opening comment.
218
“I responded to your silly opening comment.”
With a ludicrous and pointlessly, irrelevant non-comment.
81
I love it when warmists are accidentally honest and reveal their true motivation for trying to stop supposed anthropogenic global warming.
It’s because warming causes “population and civilisation expansion” – since civilisation always flourishes under conditions of natural global warming.
And ladies and gentlemen, there you have it.
191
Yep your acceptance that your comment was daft.
and you accept that it lead to desertification. Keep looking and you’ll keep learning.
123
Are you really as [Snip]AD as your comments sound?
[Attack the comment by all means but not the individual]AD
30
“Are you really as [Snip] as your comments sound?”
More-so each week !
The original comment… “when in human history has natural warming ever been a bad thing”
… was not in the least bit “daft”.
The warmer period of history have always been to most prosperous.
The Colder period, have been times of famine and desperation. (Dark Ages, LIA etc etc)
Oh, and warming DOES NOT lead to desertification.
Try to get something correct, maybe just once !
70
“Keep looking and you’ll keep learning.”
Not from you.. Nobody will !
.. a truly Billy Maddison style post from GA. !
20
“They relate to over population and civilisation expansion. “
So absolutely NOTHING to do with climate.
…just a pathetic attempt at deflection.
71
So when it’s warm there are more people and they impact the environment a bit more than they did before.
Yep, I think that’s what you’re trying to say. Tell me, is it that you want less people? Who’s first?
80
During the Dark Ages and the LIA, the environment was impacting the people, heavily.
Why is it so bad that humans can actually exert a small amount of control on their local environment.
We have this underlying despite of humans, by the local leftists.. yet again.
10
DM, if GA is going to make it a Show & Tell P@##ing Contest of links*;
how about these in the face of the the temperature, Carbon Farming Boondoggle & Uncle Malcolm’s Windfarms:-
Gifford [ 1992]:-
Implications of the Globally Increasing Atmospheric CO2 Concentration and Temperature for the Australian Terrestrial Carbon Budget: Integration Using a Simple-Model
https://www.publish.csiro.au/bt/bt9920527
Gifford [ 2004]:-
The International Free Air CO2 Enrichment (FACE) Workshop: Short- and long-term effects of elevated atmospheric CO2 on managed ecosystems, Ascona, Switzerland, March 2004
https://nph.onlinelibrary.wiley.com/doi/full/10.1111/j.1469-8137.2004.01133.x
Donohue et al [2013]:-
Impact of CO2 fertilization on maximum foliage cover across the globe’s warm, arid environments
https://agupubs.onlinelibrary.wiley.com/doi/full/10.1002/grl.50563#:~:text=Using%20gas%20exchange%20theory%2C%20we,environments%20has%20increased%20by%2011%25.
Some would argue that the the TSI warming & the resulting marine outgassing etc. ultimately make Australia naturally Carbon Neutral or better.
We, the tax payers of Australia, should be sending the UNFCCC an invoice!
Imagine the self righteous umbrage we could get from George Soros, John Kerry & ManBearPig!
* JN has done many excellent articles on this, but somehow it never seems to turn up from the MSM Fossil Fuel Hating Harpies.
70
Restricting the view of the public? Well I have an answer to that problem. Send up a drone and video the whole scene. Ensure the video is uploaded to the ‘cloud’ so the evidence is not destroyed.
Two can play at this game.
Regards
Climate Heretic
120
For those interested the historical data for Sydney Observatory ( Sydney ) is certainly on the BOM website. Look under “Climate statistics for Australian locations”. Eventually you will see a page listing all the historical data since 1858/59. But it is not individual daily data. It’s data that is summarised as monthly. Which is actually still very good as you can download and compare. Get enthusiastic and you can compile the data yourself.
70
I am amazed that just because an instrument can record temperature to 0.001C that the reading is in any way meaningful to 0.001C, especially in this crazy historic location now next and directly above a massive freeway. Heat rises. And it’s maddening to have to point this out, but I am pretty sure the aborigines did not have freeways, tunnels or massive bridges. This is certainly not a laboratory controlled environment. I doubt even momentary variations of 0.2C are significant of anything more than a gust of air, a shadow or a cloud. And this location has to be much warmer than 250 years ago, surrounded by concrete, glass, engines, towers full of people with airconditioners blasting out even hotter air. I do not think Governor Phillip would recognize the place.
We are taking interpretation of temperatures to a crazy extreme chasing man made ‘warming’, especially in cities.
It’s not just Sydney. The Melbourne I know had heat waves around 37-40C every day in the first two weeks of February. It was hell. No one had airconditioning. The rich fled to Portsea, Macedon, Ferntree Gully, Lorne for relief at the sea side or at altitude.
And we had very hot Januaries of over 30C nearly every day, even twenty years ago. Now there is almost no summer and that has been the case for many years. But we are told it is warming. That’s not true. It is cooling rapidly.
So they question is why public servant meteorologists are lying to us? There has to be an explanation.
I am endlessly annoyed with documentaries from Naturalists to Travel to Holidays that it is inevitable that they muse on the impact of ‘Climate Change’ as if it is a real thing. Yes, climates change. But they mean we humans are responsible. That is absolutely nuts. Now even the weather is someone’s fault and we should be taxed to fix it.
220
The official Adelaide readings are taken at West Terrace, immediately next to a 5 lane highway – and when it’s warm, the maximum is nearly always during evening peak, say 5:30-6:00pm, later than I remember decades ago. All the other factors apply here – the spikes so that the daily max is 1.5 degrees or even more above the half-hourly readings. Also, we have had 2 days of 40 this summer, one each for the previous two. All were sudden spikes, the most recent being 40.2 on a day that was generally 36-37 at its warmest time.
As with other cities, the nightly weather folk try hard to whoop up the nonsense about warmth, no doubt as instructed by the weirdos at BoM. Anyone with a functioning sensory system knows this January has been mild, yet the daily average is 2 whole degrees above “normal.”
It is all a monstrous lie, rivalling “safe and effective” and equally sinister.
130
OMG it is just like the Sunday Sport all over again!
018
OMG, GA’s comment is just like a blank line !
100
Way back in BC there was an article in “The Journal of Irreproducible Results” on the power of linearisation, including techniques for doing such transforms on your data.
The least recommended was “The White Rubber Sheet Technique”. In that you plotted your data on a white rubber sheet then stretched it to linearise the points. drew appropriate axes and photographed the result. Among the downsides listed was the need for help with the stretching providing witnesses to what had been done.
I wonder if that is circularised as a “BOM Technical Advice” publication?
90
What is done to sensationalise CO2 is reprehensible. They move the X axis up and expand the magnification. You always get a rocket ship. And they claim exponential growth which is not true. It is nearly a straight line. That despite the exponential growth in the human population from 1 billion in 1900 to 8 billion today and total CO2 output would be even higher.
But aerial CO2 the alleged culprit has increased only 50% in 250 years of weather and world temperatures have gone up and down. Droughts, floods, storms, volcanoes and through all this someone sees that CO2 controls the weather. It beats me how anyone came to that conclusion. But I know why.
110
nah Craig, the fact that it disappeared means that it WAS installed.
The panel was picked up from where someone rested it temporarily to have a smoko, 2 days after the 30 degree day, and they installed it. Did anyone look at any of the other buildings or yards on the hill?
118
“nah Craig, the fact that it disappeared means that it WAS installed.”
Back in the store room ready for the next assist?
120
Exactly what I did last time I set up a transportable solar panel outdoors.
Put it back into storage afterwards.
When it was outside, it was temporarily “installed” for a specific purpose.
Its just that my purpose was not to do with “assisting” temperature readings. 😉
61
“the fact that it disappeared means that it WAS installed”
Where was it installed?
Your comment has absolutely no rational or logical basis.
72
By onlookers, not easily seen,
At just the right angle to lean,
One odd solar panel,
Some heat for to channel,
Straight on to the Stevenson screen.
300
It’s amazing how you can neatly sum up this shenanigen in one limerick Ruairi! 🙂
80
Thank you Ruairi!
40
Damn that’s good.
60
Where is Sir Arthur Conan Doyle? There is a short story to be written.
How did the solar panel fly over the fence?
50
The cow that jumped over the Moon helped it, of course.
30
Hi Jo,
Maybe it would be a good idea, for completeness, to put the date on the new photo showing the disappeared solar panel.
60
I’ll get Craig to confirm the dates.
30
https://mobile.twitter.com/CKellyUAP/status/1619247406331359234?cxt=HHwWhMDTnfu73PgsAAAA
First photo – w/solar panel – 20th Jan
2nd photo – solar panels removed – 27th Jan
80
20th Jan – solar panel
27th Jan – no solar panel
60
Thanks Craig! Added to post. Please check your email. Daily Tele wants to talk to you.
40
Thanks Jo, I spoke with them earlier today. They are on the case. But still waiting for a response and explanation from the BOM. Fancy that. Maybe, like dog eat my homework excuse – the Observatory has a dog and the dog dragged the solar panel there.
60
“the Observatory has a dog and the dog dragged the solar panel there.”
Cleverer than your average “BoMite” then…. Was able to set it up at just the correct angle to warm the screen.
10
It was “The Ghost Who Reflects”.
Convince me that I’m wrong.
00
“..Was able to set it up at just the correct angle to warm the screen”
Actually it may have been set up at just the angle to pass un-shaded between the louvres & directly at the thermometer, but of course that would probably be just coincidental.
The sky in the pic does appear a bit cloudy though, but every little bit helps.
At least [ if my high school physics memory is still working ] as reflected, it would have been polarised.
00
An appropriately witnessed document (Stat Dec or Affidavit )from the BOM explaining the circumstances of the placement?installation?removal of the panel and its current whereabouts would end the story. Why this has NOT been presented gives reason the be somewhat suspicious of the events associated with this troublesome peripatetic panel!
70
Where is the enquiry? Parliamantary enquiry? into the meanderings of this solar panel and the faking of data?
10
If anyone thinks the inner Sydney Bom site is the only one being ‘fiddled’, you’d be wrong.
40
IIRC
“Once is happenstance, twice is coincidence, three times is enemy action”
10
If the oceans are boiling, where’s my cooked lobster or prawns, c’mon.
60
Really, this just looks too good to be true.
10
We have a modular wi-fi linked garden weather station at home in Melb that records multiple variables and logs thunder and lighting among many other items (Tempest, I’m not advertising it although we like it – https://weatherflow.com/tempest-weather-system/)
my point is there may be similar enthusiast weather data available in the near vicinity that would provide some control to the arrival of the solar panel
How and Why Craig Kelly took this image and who put the panel there and what they say when asked why also interest me
what the state and federal ministers responsible say also are of interest
perhaps Rebel News could put microphones in people (with responsibility)’s faces
10
I did see Craig’s comments – I had meant to say ‘ a comprehensive answer for the press, to answer all concerns’
and I see a newspaper interview is in train
00
Yesterday my thermometer said it was 25 degrees below zero F. But that wasn’t the official temperature. The official low was only 9 below F. Nonetheless, it was cold enough gell up blended and treated diesel fuel. The treatment is suppossed to good to -20 F with number 2 diesel. But this was already wintertized diesel which is a blend of number 1 and number 2. Plus the treatment.
Then I learned that the official temperature is taken from the roof top of the local elementry school. Ahh sooo…..
20
I wonder how hard & how expensive it would be to set up thermometers close the BoM sites which actually meet the defined specs
as an independent audit-able control for these shenanigans?
The reported adjusted curves may take a swerve back into the real world of taxpayers & away from K12 bred Carbon Farmers.
At the very least, the concept is a fun thought.
20
Years ago when I was in Canberra d-j I was part of trying to do local assist for a more prominent climate sceptic than me – they were trying to negotiate a duplicate setup at Canberra Airport and it died on the vine. I always assumed the idea was killed by BoM tanty.
20
I guess if they woke up to a clandestine attempt, the smarties would dabble in a bit of [stronger than reflection] directed energy.
However, these days weather stations [ WiFi & all] are available & cheap & a lot of cockies have them.
I could imagine there are enough Non Carbon Farmers out there who would happily join an on line group.
[ especially with the cost of the diesel in the tractor…]
I was recently on a job north of Bathurst & my client, a geo & also a full time farmer West of Orange could log in to the
of the shelf weather station he had at home.
I realise the specific designations for BoM Stevenson Screens are tight, but it would be good to test them against a large control group, even if Michael Mann & Phil Jones would snort derisively at them.
Wouldn’t it be a treat to grid up & image a big population of data with non BoM Stations & BoM output & look for pimples?
That one in Sydney looks like it would fail the specs even without the transient reflector.
10
In Sept to Nov last year, 2022, I wrote 3 articles for Watts Up With That, WUWT, specifically about BOM treatment of customary Australian daily temperatures, like how to tell if one day is statistically hotter than another. The 3rd part was co-authored by Tom Berger.
I am away from my PC just now, so avoiding links, but simply search WUWT for “Sherrington uncertainty”. It’s easy.
We used Sydney Observatory site as an example of a station with with a long data collection history and good potential for quality backup of operations.
Even with “raw” data from the BOM web site “Climate Data Online” we found numerous errors that we had not seen before. For example, there was one month of daily temperature Tmin values that appeared to be cut and pasted into two other years. The block of data started on the first day of the calendar month and ended on the last day. Nature does not know about human calendars, so Man was almost certainly the cause.
How do you homogenise man-made cut and paste?
Geoff S
50
Is that 2 light fittings on a pole just behind the Stevenson screen? If so, then the night time temps would be increased slightly.
I have a thermometer on a wooden pole at eye level out in our undercover patio. The temperature is always between 1 or 2C hotter than the local area temps.
00
[…] This article originally appeared at JoNova […]
00