Make no mistake, the story of our lifetimes is that we got wildly lucky. It’s not just that most our economy is no longer dedicated to finding fuel (for our corporeal bodies or our machines) but that a vast share of our lives is not consumed with collecting wood or dung, rolling up hay, or gathering berries.
The graph below shows a remarkable transformation from a lifestyle where 80% of all the work done was just the daily task of finding fuel. The advent of the industrial revolution cut that effort in half, but the wild success of coal power and technology in the 1800s cut it by factor of ten. It almost appears as if coal did not just fuel the 19th Century, but created the 20th Century too. It was the great disruptor…
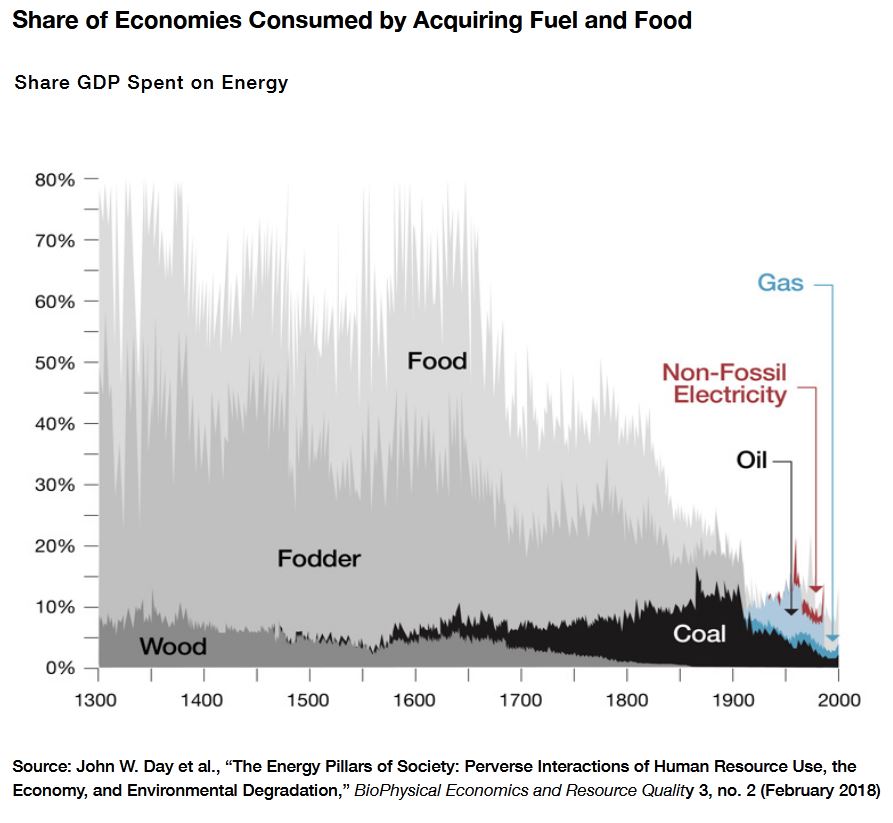
The real energy transition in the last 700 years
This was the economic transformation of the United Kingdom
By the 1990s the hunt for all the energy we needed was just a tiny 7% of the economy. And the most remarkable thing about that which is not shown in the graph, was that the total energy consumed had not shrunk at all, it had exploded.
Four hundred years ago a person in the UK would expect to use about 20KWh each day. Today each person consumes nearly 200kWh of energy. And the whole population was about 4 million people then, so there are 15 times as many people, all using ten times as much energy. How rich we are…
The graph Mark Mills recently used in the Energy Transition Delusion (above), was adapted from the earlier John W. Day study of 2018 (below).
From that paper:
Prior to the mid-seventeenth century, British society spent between 50 and 80% or more of GDP to obtain basic energy to survive. MacKay (2009) estimates that an affluent Briton currently consumes approximately 195 kWh per day per person while the average American consumes 250 kWh per day per person. He reckons that 400 years ago, in Europe, the average person sustainably consumed about 20 kWh per day per person, primarily from food and wood, which required approximately one hectare of forest per person. Obviously, not nearly enough forest exists now to support present population densities (Field et al. 2008).
The industrial revolution increased efficiency greatly through the widespread exploitation of fossil fuels, automation, and use of electricity. This resulted in energy expenditure in the UK reaching a minimum of about 7% of GDP in the late twentieth century (King et al. 2015), and annual net energy ratios for energy expenditures peaking globally in the late 1990s (King et al. 2015). Food and fodder, which historically had a net energy yield to society and underwrote almost all economic activity, today have mostly become net energy sinks in modern industrial society (Heller and Keoleian 2000). The remarkable achievements of societies running on solar-driven natural resource productivity reflects the high net energy return of food production in traditional agrarian societies with EROI [energy return on (energy) investment] values of 10:1 to as high as 50:1 (Lee 1969; Glaub and Hall 2017). Absent the technology supported by abundant fossil fuels, societal EROI was about 5:1 (Lambert et al. 2014). Until advanced technology developed, abetted by high EROI fossil fuels, all work in society was done with human and draft animals using fuel wood, peat and dung supplemented by modest wind and water power.
Rapidly transforming the energy system to lower EROI renewables to meet climate targets will mean that society must allocate substantially more GDP to investing in renewable energy plants, electric grids, energy storage, and liquid fuel substitutes. These compete with other economic drivers. The proposed transition to 100% renewable energy (Jacobson et al. 2015a, b) would require up to 5% of U.S. 2016 GDP to be allocated to renewable energy investment between 2025 and 2040 (SI-4), in addition to investments in decommissioning infrastructure and fossil fuel production to provide society’s remaining net energy requirements (SI- 3). This might severely limit discretionary investments by society, which facilitate economic growth (e.g., education, advanced health care, museums) (Hall 2017).
For comparison, the graph from the 2018 paper had slightly more detail. The 1970s oil scare makes a bump, then there is the start of another spike of inefficiency coming in the most recent years on the graph.
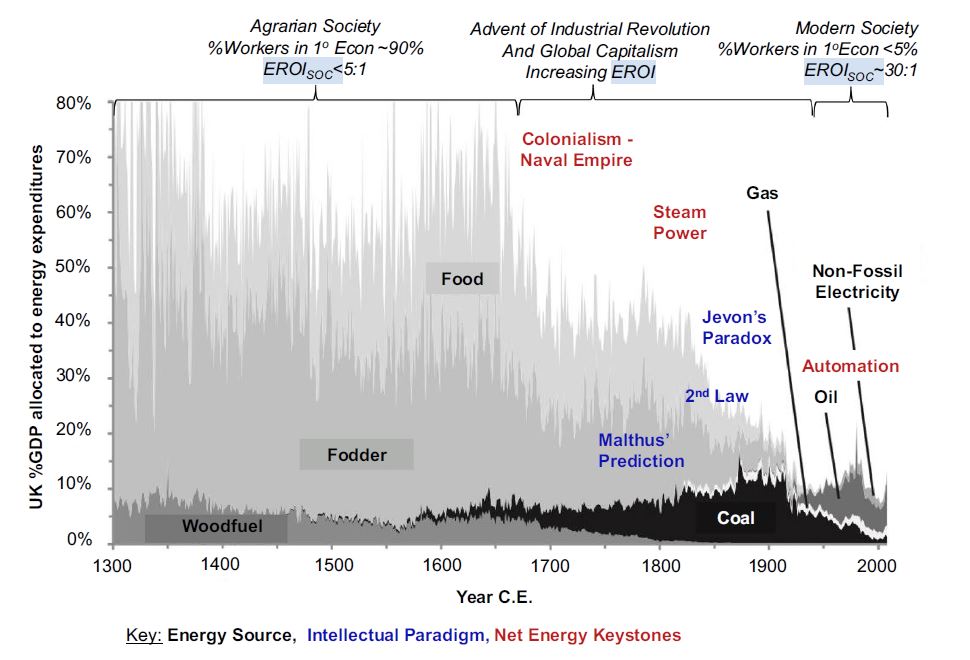
Fig. 3 Percent of GDP allocated to energy expenditure in the United Kingdom from 1300 to 2008. Energy sources are labeled in black; keystone innovations are labeled in red, and intellectual paradigms are in blue (Reproduced with permission from Fizaine and Court 2016). (Color figure online)
REFERENCES
Mark Mills The Energy Transition Delusion, Manhattan Institute [PDF]
John W. Day & Christopher F. D’Elia & Adrian R. H. Wiegman & Jeffrey S. Rutherford & Charles A. S. Hall & Robert R. Lane & David E. Dismukes, 2018. “The Energy Pillars of Society: Perverse Interactions of Human Resource Use, the Economy, and Environmental Degradation,” Biophysical Economics and Resource Quality, Springer, vol. 3(1), pages 1-16, March.
Fizaine F, Court V (2016) Energy expenditure, economic growth, and the minimum EROI of society. Energy Policy 95:172–186