The pattern is the same in the UK, in Germany and in the US, yet the media can’t seem to figure it out
New Scientist: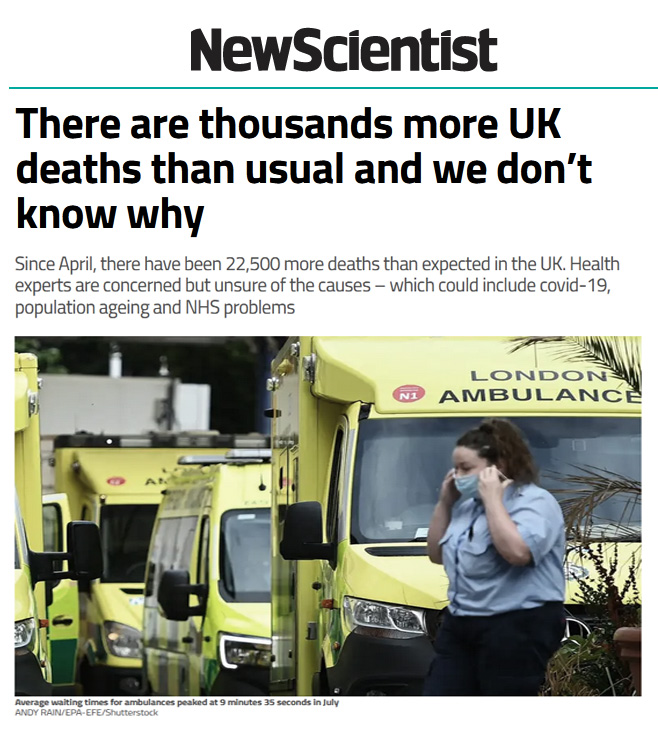 Just 22,500 people who we didn’t expect to lose. It’s ten times worse than the UK national road toll.
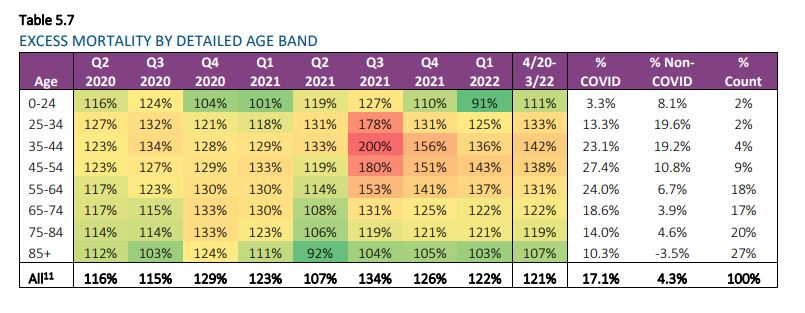
It was particularly deadly last summer in the US especially for 35-45 year olds
The Society of Actuaries (SOA) Report released a few weeks ago shows that people in that age group were twice as likely to die as normal in the third quarter last year. The odds were bad across the whole 25 to 54 age range. Deaths were 80% higher than normal.
If there is any good news in a chart of unexpected young deaths — its that whatever it was, the effect is waning. The bad news is that people in the prime of their life were still 30% more likely to die in Quarter 1 this year.
It’s a very big deal. Mortality rates in adults have been constant for decades (see figure 1 in this report). A 200% increase is a red flag flapping there. Something was going very wrong for some young working age adults. The Delta wave was hitting the US in Q3 but why would it hit the younger age groups so much more than the older ones? The data here are not specific enough to draw conclusions, but we have the more detailed resolution from the UK and Germany already. We know another piece of genetic code was also circulating then, not self-replicating but factory-made.
 As Mark Steyn said, there’s Nothing to See Here because that’s all he’s allowed to say. As Jo Nova says, where were the US Ministries of Health, the CDC and the NIH? They have all this data already. They didn’t need to wait 10 months to read it in an actuarial report. Lives are at stake. Children are losing their mothers and fathers. Where were the press releases, the studies, and the informed consent? If the 30-somethings were dying because they were unvaccinated and out partying while the older folk were protected with injections — we surely would never have heard the end of it. Yet here we are a year after this 200% spike hit and New Scientist still doesn’t know, and can’t seem to find any expert that does.
Edward Dowd, former BlackRock executive, points at UK data that shows a similar pattern:
The arrows mark the week that the vaccination schedule started for each age group. The change in the curve is evident.
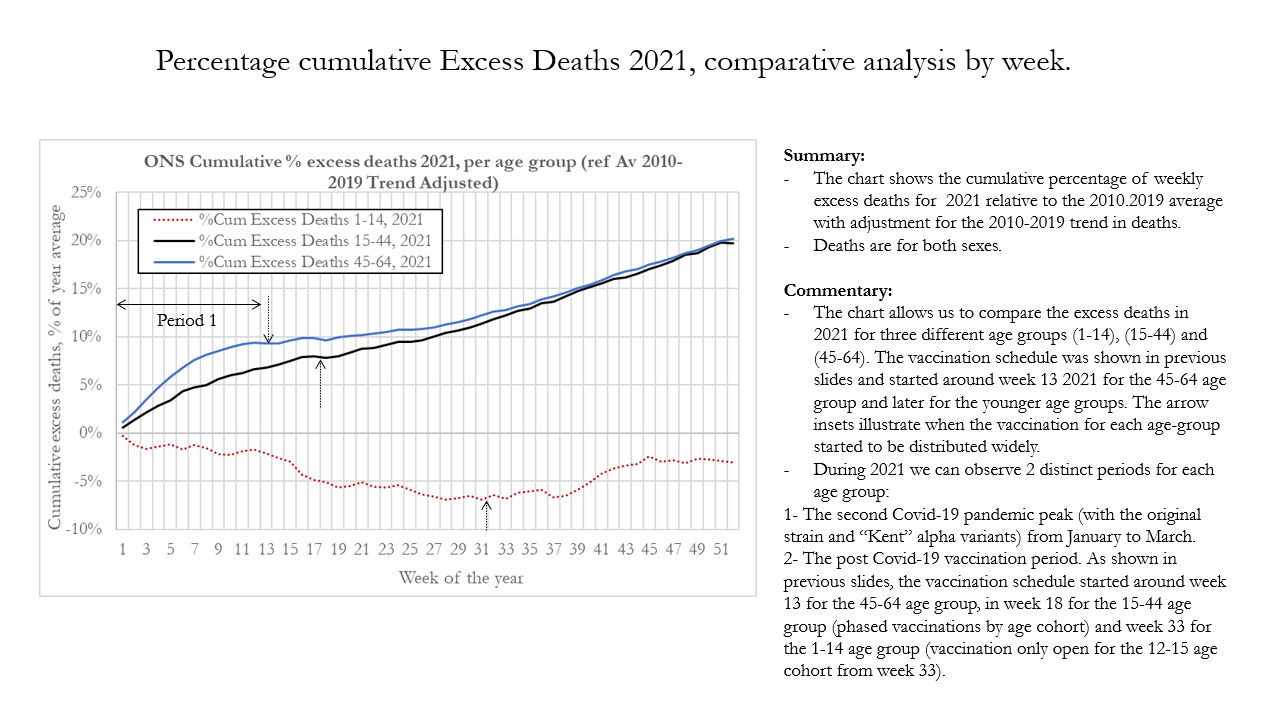
The arrows mark the week that the vaccination schedule started for each age group. The 1-14 age includes babies and children who were not eligible or unlikely to get vaccinated. | Click to enlarge and read the long caption.
Excess deaths are still climbing in 2022 and notably in all ages
Note the scale below is different to the graph above. Despite the way it appears, excess deaths are not rising in 2022 as fast as they were in 2021 in the first quarter, except — Lord no — for the children…
This is an awful graph.
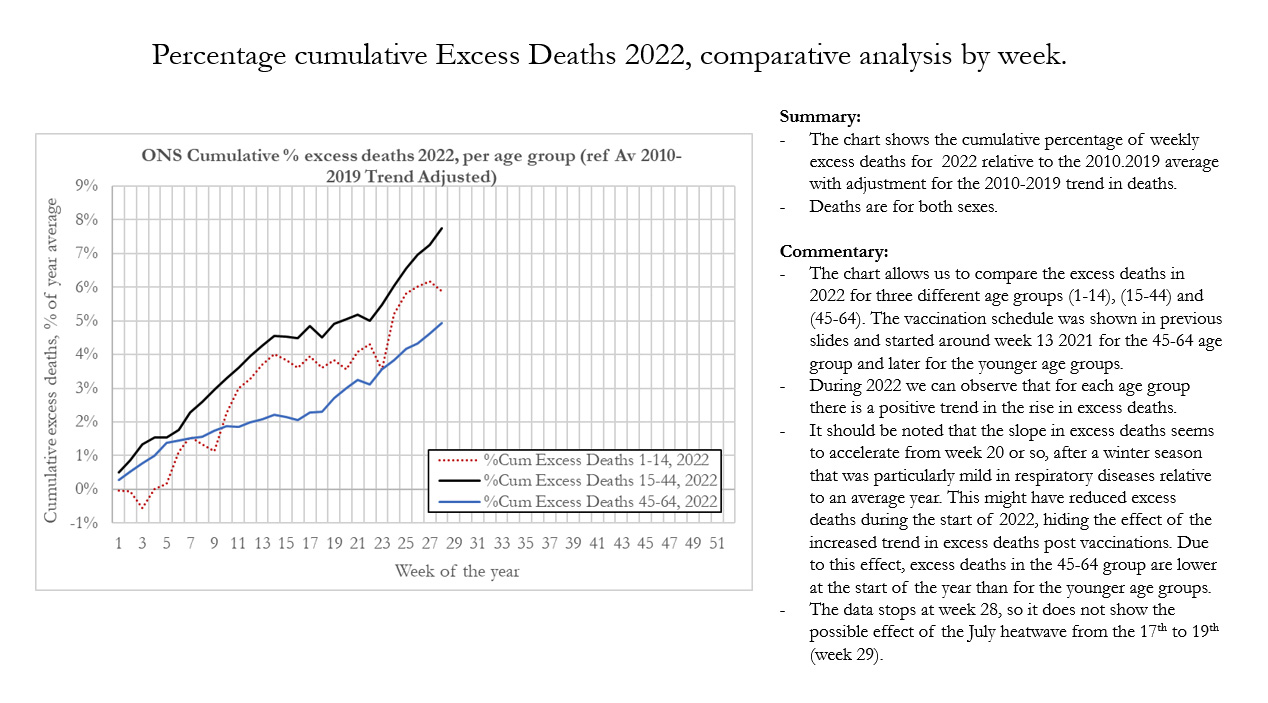
Note the scale is different. | Click to enlarge.
Past posts on excess deaths:
- The strange pattern of deaths in the UK — where “unvaccinated” age-groups are more likely to die a few weeks after vaccinations peak in their age group. (Dec 2021)
- Mysterious excess deaths 40% above historical norms in 18 – 64 year olds: Life insurance companies paying out 160% more in 2021 (Jan 2021)
- The new killer called “Unknown Causes”in Alberta Canada
- Excess deaths rise in Germany too, peaking in the same months medical experiments peak
REFERENCES
Society of Actuaries, Group Life COVID-19 Mortality Survey Report, SOA Research Institute, page 23
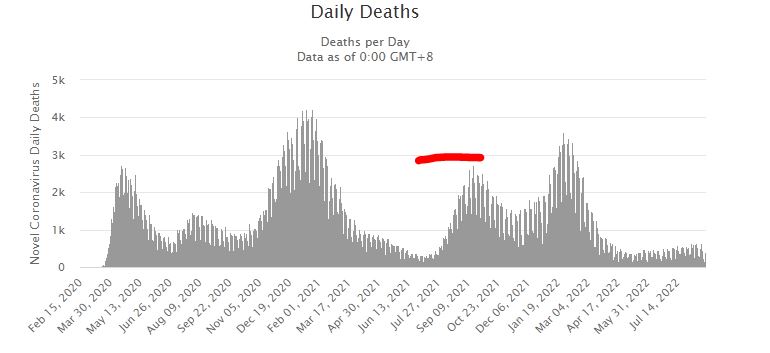
As Worldometer shows, Q3 was one of the four waves of Covid deaths in the USA in Quarter 3.
I note the vaccine rollout in Canada for 30 – 50 year olds was mostly a June to October 2021 event, i.e Quarter 3. Was it the same in the US?