Across the continent downunder, “the new pause” in temperatures is now 9.6 years long as measured by the most reliable system there is — UAH satellites.
If and when we hit the Ten Year Pause, the National Climate Alarm Centres will all issue press releases, just like the other headline events, right? Just like the “Worst bleaching since last year”, “Hottest day since records began” in 1993. Six hot days in a row in one city of Australia.
Which model predicted that temperatures in Australia would do “net nothing” for a decade?
Thanks to Charles for the graph! (His explanation of calculating the “zero slope” is at #14.2.1)
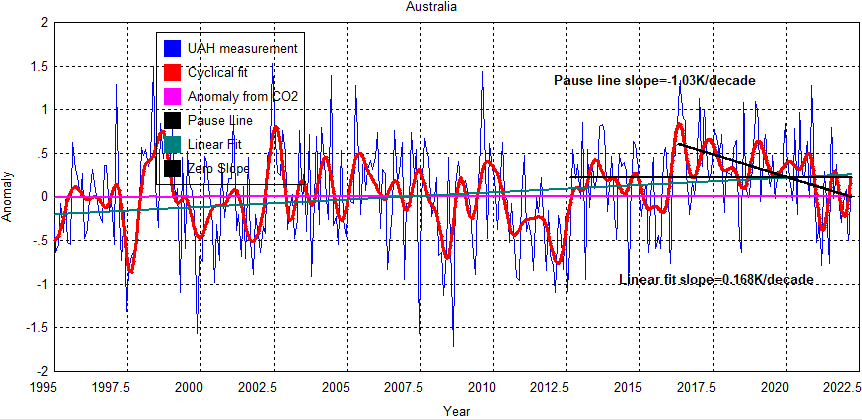
The length of the zero slope pause line is now 9.6 years.
Technically, temperatures have been falling according to the UAH Satellites since May 2016.
Satellites are obviously better for global and continental temperature trends
Assuming we care about trends that is, and not just one-second records. The UAH satellites circle continuously, and cover the entire continent. They don’t just measure 100 small points with thermometers, next to airports and incinerators, but 7 million square kilometers of area.
Some smarty pants will say UAH is bad, because it doesn’t match the land thermometers like RSS does. But that IS the point, RSS was adjusted to match the hyper-adjusted junk on land, and now they’re all terrible.
I explained before why UAH really is so much better:
Five reasons UAH is different (better) to the RSS global temperature estimates
-
-
- UAH agrees with millions of calibrated weather balloons released around the world. RSS now agrees more with surface data from equipment placed near airports, concrete, air-conditioners and which is itself wildly adjusted.
- In the latest adjustments UAH uses empirical comparisons from satellites that aren’t affected by diurnal drift to estimate the errors of those that are. RSS starts with model estimates instead.
- Two particular satellites disagree with each other (NOAA-14 and 15). The UAH team remove the one they think is incorrect. RSS keeps both inconsistent measurements.
- Diurnal drift probably created artificial warming in the RSS set prior to 2002, but created artificial cooling after that. The new version of RSS keeps the warming error before 2002, but fixes the error after then. The upshot is a warmer overall trend.
- UAH uses a more advanced method with three channels. RSS is still using the original method Roy Spencer and John Christy developed with only one channel (which is viewed from three angles).
-
…


Dual realities.
We see no reason to diminish Western society.
They could claim this as evidence the plan is working.
Of course, they didn’t acknowledge the old one, why would they acknowledge the new one.
Oh wait, it is not about climate, it’s about Western society being the target of the plan.
280
Speaking of something being part of the plan – here is more evidence that the World Economic Forum is evil.
“WEF Speaker Yuval Noah Harari: “Covid is critical, because this is what convinces people to accept, to legitimize total biometric surveillance…. The next phase is the surveillance going under our skin…. We are really acquiring divine powers””
https://twitter.com/FMnews_/status/1515446659294982144
210
The Inconvenient Truth is that there has always been Climate Change BUT there is no Global Warming to get alarmed about. In fact, the World is more likely to experience some Global Cooling in the very near future. And, that the Satellite temperature measurements are more reliable than land based temperature measurements. Just ask NASA.
161
‘ … the World is more likely to experience some Global Cooling in the very near future.’
Why is global cooling more likely in the near future?
112
Because the planet entered a GSM in 2020 and is now cooling.
It will disimprove each year.
This year is wetter and windier than it was last year … and it’s middle April …
90
Hard to prove, we would need to show the mechanisms between a quiet sun and earthly climate. The Maunder Minimum may hold the answer, perhaps a GSM impacts the polarity of the oceanic oscillations.
00
Question: Why is global cooling more likely in the near future?
Answer: Because it has been established by astronomers that climate change is caused by the speed of the centre of the Sun relative to the centre of mass or barycentre of the Solar System, which determines the length of the Solar Cycle. This in turn is caused by the orbits and masses of the Planets.
Evidence: https://www.institut-halbach.de/wp-content/uploads/2020/01/Abdussamatov_The_New_Little_Ice_Age_Has_Started.pdf
Orbital resonance calculations: https://tallbloke.wordpress.com/2021/10/30/orbital-resonance-and-the-celestial-origins-of-earths-climatic-changes-why-phi/
Forecast: This is a 100 year forecast of sunspot cycles, checked by a backward hindcast computer run, which predicts a cooling up to 2050: https://lweb.cfa.harvard.edu/~wsoon/myownPapers-d/VelascoHerreraSoonLegates21-April17-AdvSpaceRes-preprintOnline.pdf
Question: How does the backward hindcast computer run prove that the “Man-made Global Warming Hoax” was caused by this?
Answer: Between 1913 and 1996, only one of eight Solar Cycles was longer than the mean Solar Cycle length of 11.04 years, the last of these was the shortest Solar Cycle for more than 200 years.
70
‘Thus, the problem of sunspot cycle predictions should be considered as a question of probability. This is why the solution to solar cycle forecasting consists in calculating the prediction probabilities of future solar cycles.’
Perhaps they need to create smarter models with predictive capabilities.
00
These computer models are the most reliable computer models in existence, because they are based on Kepler’s laws of planetary motion. The machine learning backward hindcast computer runs are based on the probability that the assumptions for the predictions are correct. If the machine learning backward hindcast computer run does not fit the facts for the past, then the prediction is not correct, until the machine learning backward hindcast computer run fits the facts for the past. Only then was the prediction as reliable as Kepler’s laws of planetary motion.
The length of the solar cycle is more important than the number of sunspots in determining climate change, because the shorter the length of the solar cycle, then the higher average speed of plasma in the Sun, which determines how active the Sun is over a given period. So then it is predicted that the Sun will be less active due to the slower speed of plasma in the Sun over the next 30 years.
The prediction is as reliable as Kepler’s laws of planetary motion.
10
I like the hypothesis, the cosmological mechanism fits perfectly, but what we need is a five year weather forecast on earth.
Can the theory explain ENSO behaviour?
00
Solar cycle 24 was the shortest cycle in 100 years, are we in a Gleissberg?
00
A negative PDO should see a continuation of the pause.
https://www.ncdc.noaa.gov/teleconnections/pdo/
00
Also, don’t forget that Australia’s Bureau of Misinformation, errr, I mean Meteorology, deleted from the official ACORN record all of Australia’s extensive weather records from before 1910.
And of course, there is extensive alteration of the remaining data post-1910 by the mysterious process known as “homogenisation” that no one outside of BoM can reproduce and BoM refuses to disclose its methodology for doing so. If the data “analysis” can’t be reproduced then it is not science, by definition.
I wonder how long before BoM alters, deletes or “justifies” not using this satellite data?
BoM is not a scientific org admiration anymore, it is a political organisation pushing a narrative.
An interesting acronym the BoM chose there, ACORN. The non-native species, squirrels bury acorns in the ground and furthermore fail to recover 74% of them.
270
CORRECTION: Spell checker made an unauthorised change: “org admiration” should be “organisation”.
50
BOM now stands for “Bunch of Muppets”………………..
110
My mind goes back to my teaching days when a new subject was created for a couple of spare periods on the timetable at the school I worked at. My favoured acronym was POLY because it was just a filler.
And how about the problem caused for the Swan Hill Technical College when all of the technical colleges became Institutes of Technology. And did Curtin University really have a period when it was known as the Curtin University of New Technology.
Ah acronyms. TANSTAAFL.
10
University of Canberra almost amalgamated with Canberra institute of technology to form a polytechnic or, as was preferred a University of New Technology in Canberra.
…
10
David Maddison asks the interesting question, above, about why the Oz BoM should continue using ground based (..and biased) temp data rather than the UAH satellite data. It’s worth thinking about.
The question arises in my mind as to wether it is possible for the UAH data to be ‘compartmentalised’ to show just the data for the Oz continent. If that can be done then it would be interesting to see the Apples-with-Apples between the two.
Any ideas? Anyone for a research grant to do this? Maybe BoM could do it? Independently audited of course.
111
It won’t happen. The last time this was attempted was by then PM Tony Abbott.
The then “Environment” Minister, now “Health” Minister, Greg Hunt killed off the idea.
BoM is, after all, a political agency with an agenda to promote the anthropogenic global warming fraud, not an impartial scientific agency.
https://www.theguardian.com/australia-news/2015/sep/24/abbott-considered-investigation-into-exaggerated-bom-temperature-data
190
Greg Hunt is clearly a person terrified of the truth as shown by his dismal performance in both the environment and health portfolios.
If the BoM wasn’t altering data, why would he be afraid of an independent audit?
If HCQ, IVM etc. didn’t work, why wouldn’t he allow them to be at least tried among willing patients and doctors? The worst that would happen is that they would be shown not to work as is the official doctrine.
200
” it is possible for the UAH data to be ‘compartmentalised’ to show just the data for the Oz continent”
Already happens. We have our own column at https://www.nsstc.uah.edu/data/msu/v6.0/tlt/uahncdc_lt_6.0.txt
That is what the graph in the article is
140
UAH has regional figures for GLOBE NHEM. SHEM. TROPIC USA48 ARCTIC AUST
10
Because it is the only data that is relevant to almost all life?
01
Its a well know fact that nearly half the surface stations are unfit for purpose, even by BoM never-applied standards.
That means BoM “data”, especially after the black box of warming-creating homogenisation, is absolutely pointless and irrelevant to reality.
The data that is most relevant to all life on Earth, is the continued rise in atmospheric CO2. 🙂
That increase is making the world a better, more plant-friendly place….. so, naturally, the greenies want it stopped.
20
Notice also the long cooling period from 2002 til 2012.5, then a step, then 2 years cooling, then a step then cooling to now.
This is the very opposite of what mythical CO2 warming would do.
110
The PDO was negative from 2002 to 2013, then went back into its positive phase for a decade. Oceanic oscillations determine weather and temperature.
43
I predict that neither major party will mention this during the race to the Election.
120
LET’S DO IT FOR CIVILIANS, TOO: Pentagon to build nuclear microreactors to power far-flung bases.
Pentagon to build nuclear microreactors to power far-flung bases
Pentagon officials recently announced that the Defense Department will build a nuclear microreactor that can be flown to an austere site by a C-17 cargo plane and set up to power a military base. “Project Pele.”
In the fiscal year 2020, the Pentagon budgeted $63 million for the project, followed by another $70 million in fiscal 2021. Project Pele reports have hailed the fourth-generation nuclear reactor as a “pathfinder” for commercial adoption of the technology.
The plans call for a 40-ton reactor that can fit in three-to-four 20-foot shipping containers and, once set up, provide 1 to 5 Mega Watts of power on full power operation for up to three years before refueling.
The microreactor will ultimately join a newer type of nuclear fuel being used in the program at the Idaho National Laboratory. Testing and experimentation will occur in 2024, with demonstrations anticipated by 2025, Waksman said.
Members of the Nuclear Safety Project at the Union of Concerned Scientists also told Army Times in 2019 that they had major concerns that the Army’s own reporting on the design concept showed such a microreactor would “not be expected to survive a direct kinetic attack.”
Those include places such as Fort Greely, Alaska, and Lajes Field, Azores.
Long & Interesting Read
[Edit for length. – LVA]
40
That rather fleshes out the US Army’s recent announcement about going carbon-free for bases and non-tactical vehicles.
00
It depends on where you live as to what the climate is doing. According to elders weather site, Lakes Entrance has only had one month in the past thirty where the average day temperature has been in the positive. Most other months have been -1 or more.
70
And with this year being the coolest summer in my living memory, easily, we get confirmation that climate change is real, because of rain. Can you believe it ? This spring I was thinking if we get a hot summer and fires this year the alarmists will go crazy. So we get the coolest summer and they still go crazy. The argument you simply can not win using logic.
80
It was a cool summer in Sydney, daytime temperatures were down and up at night, so they cancelled each other out. Temps were about average.
10
EG what you write is a classic example of how averages can be used to destroy information.
20
The simple fact of the matter, more clouds produce cooler days and warmer nights. This is how its always been constructed.
00
I got tempted for just one swim in our pool this summer.
20
Luxury. We don’t even have a pool. We have to run under the sprinkler.
You think you’ve got it tough. We don’t even have a sprinkler. We had to go outside and wait for rain. And we don’t live near Brisbane so we had to wait a while.
And you tell that to the kids of today. They won’t believe you.
00
I remember a scandal in Astronomy when it was found that the IPCC produced a faked consensus that the Sun was not a key player in climate change, and all from one single scientific paper. Astrophysicists Doug Hoyt and Richard C. Willson, the satellite experts behind the collection of the original data found that the scientists who produced the paper had fraudulently manipulated their data.
https://www.researchgate.net/profile/Nicola-Scafetta/publication/329815053_Statement_of_Richard_Willson_on_the_TSI_ACRIM1_and_ACRIM2_data_modifications_implemented_in_Frohlich's_PMOD_TSI/links/5c1c13b492851c22a33ae2f1/Statement-of-Richard-Willson-on-the-TSI-ACRIM1-and-ACRIM2-data-modifications-implemented-in-Frohlichs-PMOD-TSI.pdf
50
Wow, that is extraordinary. No wonder we are sceptical.
00
Chas the Moderator at WUWT would know that I posted the current pause at 9 years and 8 months, a few days after Dr Spencer released the numbers from UAH at the start of April 2022. Geoff S
http://www.geoffstuff.com/uah_australia_to_april_2022.jpg
30
Thanks Geoff, Oz is below the line but its unlikely to become an election issue.
00
At a first glance, that looks OK, but…
Trend for UAH 6.0 AUST since Dec 1978: +0.18 ± 0.02 °C / decade
Trend for UAH 6.0 AUST since Aug 2012: -0.03 ± 0.16 °C / decade
While the first estimate is statistically significant, the second one is not at all, as the standard error is way higher than the estimate itself.
20
OMG you can’t put errors, confidence intervals or, indeed, any sort of analysis that interrogates an analysis.
You forgot a conclusion. Charles’s graph is wrong.
00
Ground temperature measurement changes used as a proxy indicator of “global” atmospheric warming is just bad science in our modern times.
Too many confounding physical variables and not enough information to model the “depth” of the fluid. And missing non-land areas without continuous records.
But as we’ve seen, with a little help from BOM’s ratbag homogenisation, these consumer figures can be used to support any crisis narrative.
Space measurements are a promising alternative, but suffer the same sort of “inference” modelling from measured radiation.
Maybe using real temperature measurements from radiosondes which collect temperature data at continuous altitudes to 28km would be better?
Modelling this data is more complex and may still suffer some physical interference due to limited locations (not many ocean launch sites).
At least this data is now being collected open-sourced at sondehub (independent of the “infected” meteorological organisations).
20
You might be interested in this recent essay by Andy May.
https://wattsupwiththat.com/2022/03/25/uah-vs-rss/
00
The satellite numbers (UAH) are verified using radiosonde data. Both have their place as to a much lesser extent do ground based readings.
10
So what is new?
00
It sure is easy to put a bunch of trend lines through subsets of data.
Let’s see… is this La nina warmer or cooler than the last? Is the most recent El nino wamer or cooler than the one before it?
12
Often the second La Nina is quieter, but ENSO has a mind of its own. Would a third consecutive La Nina be unprecedented?
00
I don’t mean the two in succession where there is no period of “recovery’ from the first event (if indeed it can be termed “first”), I am refering to the la nina that preceded the last el nino
10
Copy that, this La Nina is not as cool, so I might be wrong in thinking sea level will fall.
https://www.drroyspencer.com/wp-content/uploads/UAH_LT_1979_thru_March_2022_v6.jpg
00
The sea level effect wasn’t just how much rain but where it fell. The inland flowing catchments seemed to act like a sponge to hold water in the continent. The bulk of the rain in the last couple of years has flowed relatively quickly out to sea. Not sure what impact rain over south Africa has on sea levels
10
The Great Artesian Basin is the underlay.
On the question of ENSO, because this La Nina has been milder you could argue its the effect of global warming.
00
there are other sources of heat than just the sun – try the hot magma and radioactive heating in the core of the earth – why is that not an explanation for the rather erratic impacts of El Nino and La Nina? Is it not relevant that the source of both just happens to be the western side of the pacific in the ring of fire?
11
and? We are comparing 2 la ninas. If you have some sort of info about magma that is relevant present it.
whatabout doesn’t add anything to this.
11
There is a strong link between ocean spreading zone seimsic activity and UAH temperatures
10
Does the Indo Pacific Warm Pool get its heat from the deepest trench in the world? At the LGM the SST of the warm pool was a few degrees cooler than normal.
ENSO was fairly inactive until around 3000 years ago.
https://www.sciencedirect.com/science/article/abs/pii/S1040618203001344
00
The Indo Pacific Warm Pool is just south of the Mariana Trench, but everyone claims the heat is not coming from that depth because the pressure is too great.
https://en.wikipedia.org/wiki/Mariana_Trench#/media/File:Marianatrenchmap.png
00
Energy still disperses even at those depths, just rather slowly
Thermal transfer physics still applies. If it was at “equilibrium”, then more heat energy is added from below, that heat will spread upwards.
It can’t just stay there and build up.
30
Yeah, so the unusually warm North Pacific arc is probably related to warm water released from a nearby subduction zone.
https://earth.nullschool.net/#current/ocean/surface/currents/overlay=sea_surface_temp_anomaly/orthographic=-174.24,28.82,265
00
I prefer the word “possibly” rather than “probably”
Not enough information.
More probably from a variety of source, decreased cloud cover, changes in ocean currents etc
20
Fair enough, ‘possibly’ is best until more information comes to hand.
00
Its about how we frame the narrative.
https://notrickszone.com/2022/04/18/new-study-90-papers-were-published-on-the-hiatus-from-2009-2019-now-they-say-it-never-happened/
00
“It sure is easy to put a bunch of trend lines through subsets of data.”
But actual comprehension and understanding, is a lot harder for some.
30
UAH estimates troposphere temperature, not surface. The creator of that chart should specify whether the time series is TLT or TMT.
10
It was “Charles”!
I wonder if Charles could explain the derivation, rational and statistical significance of the lines. Did Charles consider starting a line in 2011 or 1993?
10
“rationale”
00
Charles should have specified the time series.
During 1979-2005 a difference was discovered between radiosonde and AMSU, ‘ radiosonde datasets in general showed more cooling than satellite data, sets in stratosphere and radiosonde data showed cooling whereas the satellite indicates warming in global or hemispheric region scale.
‘Therefore, this research suggests that for better estimating regional upper-air temperature trend in China especially in the lower stratosphere and middle troposphere, it is necessary to analyze multiple independent dataset.’
(Yanjun Guo / National Climate Centre)
00
What I furnish here should help you.
I compute the linear fit for each point in the series to the last point in the series. I start from point one to the end, and then I go from point two to the end. I store the slope values and generate the figure below. I circle the two points that start each line.
https://1drv.ms/u/s!AkPliAI0REKhhMZiAwm_lezLLcQIfQ?e=h9hS3K
30
Thank you Charles!
10
cheers Charles. A rationale would be good 9actually essential). Also statistical significance.
01
The trends should not differ as they do, unless you think CO2 causes atmospheric COOLING ! .
UAH is by far the most accurate measure of temperature trend.
It covers nearly all the planet, and is validated by USCRN, unadjusted balloon and radiosonde data as well as by CERES, ERBS etc
GISS et al are fabricated from a sparse, irregularly space set of every changing and urban effected stations.
70% of the Earth isn’t even measured.
RSS is fabricated using old degraded satellites, and “adjusted” using “climate models”
10
The data used in the graph is UAH TLT Australia.
20