UPDATED: See below
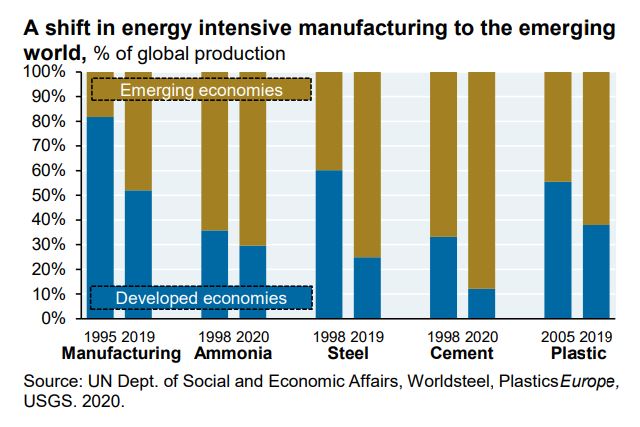
The Western World has mostly succeeded in reducing emissions by shifting their emissions to factories in developing nations. In industries like Steel, Cement and Plastic as much as 20 – 50% of all production has gone overseas.
All this was achieved in just 20 years or so…
…
In the game of emissions reductions the West will become irrelevant (and in so many other ways too):
…The even more important and larger question: even if the US succeeds, what about everyone else? Over the last 25 years, the developed world shifted much of its carbon-intensive manufacturing of steel, cement, ammonia and plastics to the developing world. As a result, developing world adoption of wind, solar, storage and nuclear power may end up being the primary determinant of future global emissions outcomes. That has certainly been the case over the last decade: Europe and Japan reduced primary energy use by 4%-6% but developing world increases were 6x higher than their reductions
–Michael Cembalist, JP Morgan Annual Energy Paper
UPDATE: David Wojick makes the good point that some of shift is due to an increase in China for China’s own use, as opposed to a loss in the West. But the shift is still real (perhaps less so in the US compared to countries which “decarbonised” without the benefit of massive shale gas production). Consider steel production from the Yearbooks of WorldSteel from 1998 to 2019 . Despite populations growing over that 20 year period, Australia produces 40% less steel, the UK production fell 60%, Canada fell 17%, France fell 36%, USA produces 12% less steel, and Germany 14% less.
The nations that adopted some of the highest UN carbon fashion stakes also suffered the greatest losses. China’s steel production grew 1000%.
The Australian population has grown 30% since 1998. US population has grown 20% (and unknown others?). China’s has grown about 17%.
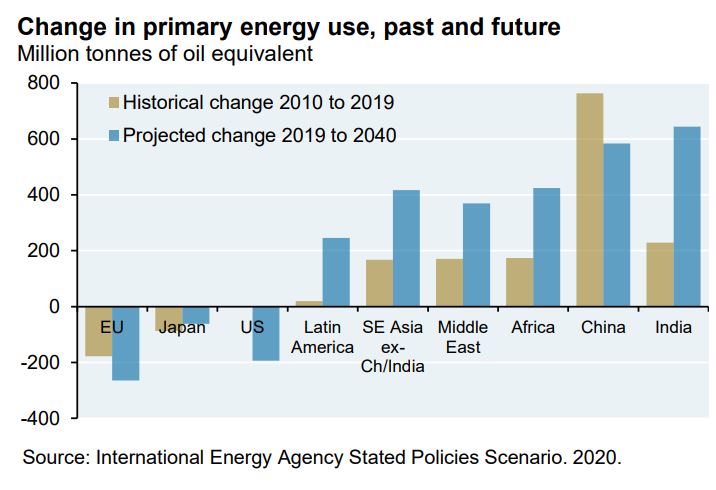
Patterns of energy use tell the story: here’s the shift in the last ten years.
Focus on the tan colored columns in the graph below. The US has not changed, but the EU and Japan have shrunk.
The blue columns are only a projection.
…
After the Legacy Media, comes the Legacy Superpower.
REFERENCES
-Michael Cembalest, JPMorgan, 2021 Energy Review
h/t Thanks to Rafe Champion at Catalaxy and Old Ozzie.