UPDATE: The Hon. Craig Kelly MP was so appalled by this story he has taken this to the Australian Parliament already where The Labor Party was so afraid they interrupted his allocated 15 minute speech just to stop him finishing. They even called a formal Division which means the bell is rung and all the missing MPs have to return to the Chamber to vote. See that on Kelly’s Facebook page. Who cares about our climate and who covers up for incompetent bureaucrats?!
Chris Gillham wonders how the bureau figured out the Marble Bar max was one whole degree too warm on 18 Nov 1923, but it was 0.6°C too warm on 19 Nov 1923, 0.3°C too warm on 20 Nov 1923, 0.2°C too warm on 21 Nov 1923, and 0.8°C too warm on 22 Nov 1923? He points out the sky was totally clear every day, the screen didn’t get shuffled around every day, etc, so where’s the logic? The world record was extinguished because on 8 March 1924 the ACORN adjustments magically cooled the temperature from 38.2°C to 36.5°C. What caused the thermometer to be 1.7°C too warm on that particular day? That adjustment is twice the size of the entire century long trend. Check out those “daily changes” of raw versus “ACORN.”
Has ACORN robbed Marble Bar of its world record?
by Chris Gillham, WAClimate
If the Bureau of Meteorology’s Australian Climate Observation Reference Network (ACORN) accurately corrects historic temperature observations, it means that Marble Bar in the north of WA can no longer boast it had a world record heatwave in 1923/24.
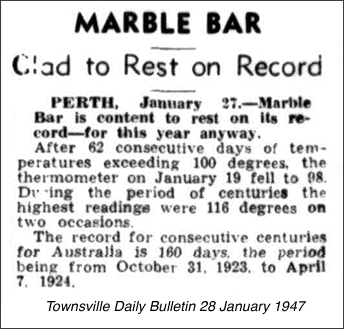
Marble Bar has been world famous for decades because of the 160 consecutive days in which it recorded maxima at or above 37.8C (100F or a “century” in the Fahrenheit days).
The Marble Bar thermometer in a Stevenson screen topped 100F every day from 31 October 1923 to 7 April 1924, and nowhere else on earth is known to have recorded 160 century days in a row without a break.
Marble Bar is now a runner-up
The BoM website used to have a Climate Education page explaining Marble Bar’s heatwave record. The National Library of Australia considered it to be of national significance and has archived it for posterity.
In 2020, the BoM website still has a page that explains: Marble Bar, in the Pilbara, holds the Australian record for the longest sequence of days over the old century mark (100°F or 37.8°C). This occurred during the period from 31 October 1923 to 7 April 1924 when the maximum temperature equalled or exceeded 100°F for 160 days in a row.
The Australian Bureau of Statistics acknowledges the world record and Australians have heard about the Marble Bar heatwave record for many decades :
Temperature dataset downloads from the BoM website show that ACORN has cooled 31 October 1923 to 7 April 1924 so much that the Pilbara town can no longer boast that it had a world record 160 consecutive days above 37.8C.
ACORN 2, which is described as a world-class homogenisation network, has reduced the 160 days to just 128 – from 1 November 1923 to 7 March 1924.
From 31 October 1923 to 7 April 1924, the dates during which the 160 days of 100 or more were recorded, there’s now 153 days at or above 100F.
And the winner is … America
Wikipedia’s Death Valley page states that “The greatest number of consecutive days with a maximum temperature of 100 °F (38 °C) or above was 154 days in the summer of 2001.” This data is confirmed by the American Meteorological Society, which also references 134 consecutive days at Furnace Creek in Death Valley that were above above 37.8C during the summer of 1974.
154 days is less than 160 days but a lot more than 128 days, so it seems that America now holds the world record heatwave of consecutive 37.8C+ days at Death Valley – thanks to ACORN.
On its archived Climate Education page, the BoM states that “The highest temperature recorded during the record spell was 47.5°C on 18 January 1924.”
This is correct in the original RAW temperature dataset (see below), but ACORN 2 cools 18 January 1924 to 47.3C.
An Excel spreadsheet (499kb) with columns of daily maximum temperatures at Marble Bar from October 1923 to April 1924 in ACORN 1, ACORN 2 and RAW can be downloaded here.
Daily cooling adjustments
BoM temperature adjustments to ACORN weather stations have cooled Australia’s history of very hot days (see No more extreme hot days in Australia than 100 years ago and The Australian Bureau of Met hides 50 years of very hot days).
Politicians and climate change skeptics are often scorned for suggesting that the BoM adjusts temperature data to fit a global warming agenda or to cool the past (e.g. Media Watch), and in late 2019 SBS News reported that the bureau denied it has rewritten Australia’s climate record.
The animation below uses the daily temperature datasets for RAW, ACORN 1 (introduced 2011/2012) and ACORN 2 (introduced quietly with no BoM announcement in early 2019) to compare the number of days each year from 1910 to 2019 that Marble Bar recorded a very hot day (defined by the bureau as at or above 40C) :
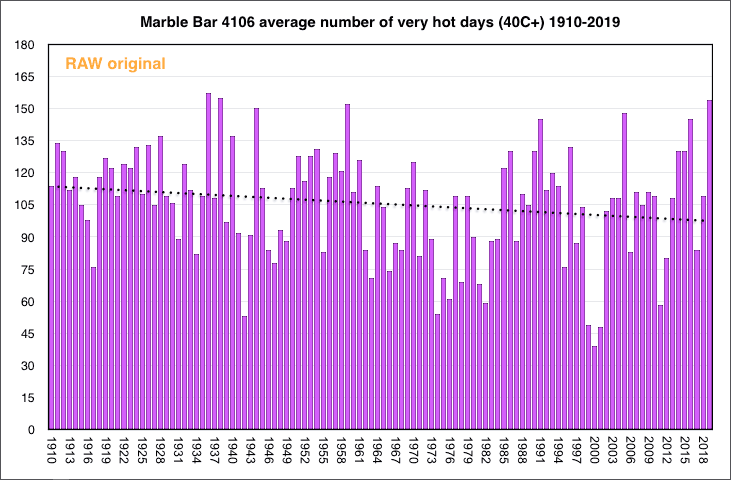
Marble Bar very hot day trends
This animation demonstrates that temperature data has been adjusted, with Marble Bar just one of many examples where Australia’s climate record has been rewritten to cool the past.
The slides show that very hot days were far more frequent according to the original RAW thermometer observations in the first half of the 1900s, but ACORN 1 cooled many of these and ACORN 2 has trimmed them even further to create an upward trend in the occurrence of 40C+ days at Marble Bar since 1910.
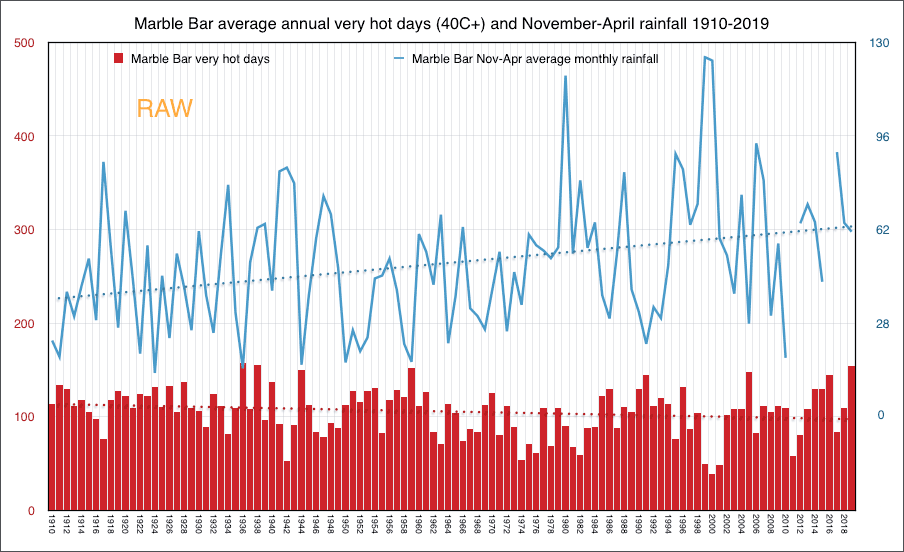
Rain = clouds = fewer very hot days
The bureau’s archived 2009 Climate Education page helps explain why Marble Bar had the world’s longest heatwave in 1923/24: “The town is far enough inland that, during the summer months, the only mechanisms likely to prevent the air from reaching such a temperature involve a southward excursion of humid air associated with the monsoon trough, or heavy cloud, and/or rain, in the immediate area.”
Marble Bar averaged just 9.9mm of rain per month from November 1923 to April 1924, compared to the 1910-1964 Nov-Apr average of 43.4mm per month. Just 71.1mm of rain fell in 1924, compared to an average 325mm in 1910-1964. The town had 132 very hot 40C+ days in 1924, compared to the 1910-1964 average of 112.3.
It’s no surprise that the frequency of rainfall strongly influences how hot it gets in Marble Bar and how often the town exceeds 40C. In the absence of cloud data, rainfall is a proxy for cloudy days that keep temperatures below 37.8C or 40C.
Confining the data to months when very hot days occur, the animation below shows the correlation between annual November to April rainfall at Marble Bar and the number of very hot days in the RAW, ACORN 1 and ACORN 2 daily temperature datasets :
RAW very hot day (40C+) annual averages:
1910-1964 112.3
1965-2019 98.7
ACORN 1 very hot day (40C+) annual averages:
1910-1964 93.2
1965-2019 94.5
ACORN 2 very hot day (40C+) annual averages:
1910-1964 90.7
1965-2019 95.1
Rainfall November to April monthly averages:
1910-1964 43.3mm
1965-2019 56.5mm
The animation demonstrates that the frequency of very hot days increased when rainfall and cloudy days were relatively sparse at Marble Bar in the early 1900s, and how very hot days decreased when rainfall and cloudy days increased from the 1970s.
However, the correlation between very hot days and rainy days is ignored by ACORN 1, and even more so by ACORN 2. For example, ACORN cools 8 March 1924 from 38.2C to to 36.5C at Marble Bar, ending the world record, but there was no rainfall on 8 March 1924 so what caused the thermometer to be 1.7C warmer than it really was on that particular day (according to ACORN)?
1,187 fewer very hot days
Marble Bar had 6,178 very hot days of 40C or more from 1910 to 1964 in the original RAW observations, and ACORN 2 cuts this to 4,991 – a 19.2% reduction.
If this homogenisation is an accurate adjustment, it must be assumed the BoM identified a significant recording error in the standardised equipment and/or Stevenson screen, or an influential site move, in the first half of Marble Bar’s temperature record – sufficient to diminish the ability of rain clouds and clear skies to keep the daily temperature below or above 40C.
Alternatively, the daily ACORN adjustments are due to area averaging based on daily temperatures at “neighbouring” weather stations. In 1923/24, the closest known weather stations with digitised daily temperatures were Port Hedland Post Office, a coastal site almost 140 kilometres away, and Broome Post Office about 440 kilometres to the north (long-term Nov-Apr average maxima : Port Hedland 34.6C; Broome 33.9C; Marble Bar 39.7C). Nullagine, about 120 kilometres south and without digitised daily temperatures, is an influential station (long-term Nov-Apr average maxima 37.6C).
Although ACORN 2 substantially reduces the frequency of very hot days in the early 1900s at Marble Bar, both RAW and adjusted ACORN 2 maxima show the average temperature of the very hot 40C+ days was 42.4C in 1910-1964 and 42.3C in 1965-2019.
As at most weather stations, Marble Bar’s temperature history has been influenced by shifting rainfall patterns rather than CO2.
ACORN homogenisation of Australia’s temperature history doesn’t alter readings at the rainfall gauges since 1910, and seemingly ignores the correlation between cloudy days and very high temperatures.
Averages
The cooling adjustment of Marble Bar’s early observations affects both the frequency of very hot days and the yearly average maxima. Below compares average annual maxima in the RAW, ACORN 1 and ACORN 2 datasets :
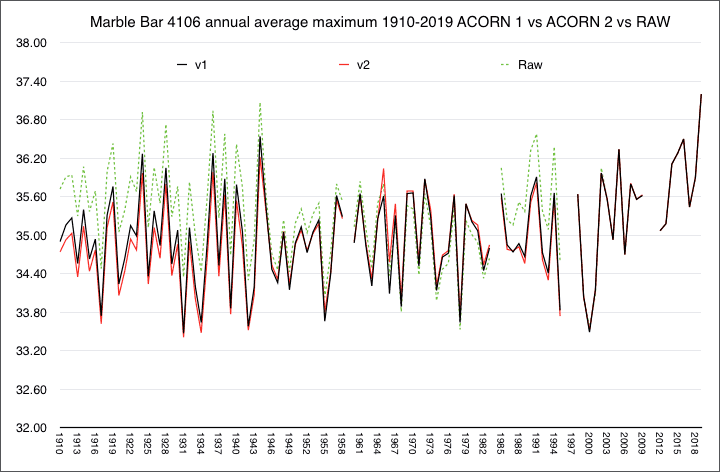
Average maxima
1910-1964 – ACORN 1 34.90C / ACORN 2 34.77C / RAW 35.45C
1965-2019 – ACORN 1 35.16C / ACORN 2 35.18C / RAW 35.25C
ACORN 1 warmed 0.26C / ACORN 2 warmed 0.41C / RAW cooled 0.20C
Average change per decade : ACORN 1 0.10C / ACORN 2 0.12C / RAW 0.03C
The maximum averages show that ACORN’s reduction of very hot days in the history books is typical of broader adjustments to maximum temperatures on all days at Marble Bar before the 1970s.
Not just very hot days
ACORN adjustments to historic daily observations affect not only the frequency of very hot days (40C+) but also what the BoM defines as hot days (35C+).
Since 1910, Marble Bar has recorded daily maxima at or above 35C every month of the year. The animation below shows annual hot 35C+ days at Marble Bar in the RAW, ACORN 1 and ACORN 2 datasets from 1910 to 2019, as well as annual rainfall :
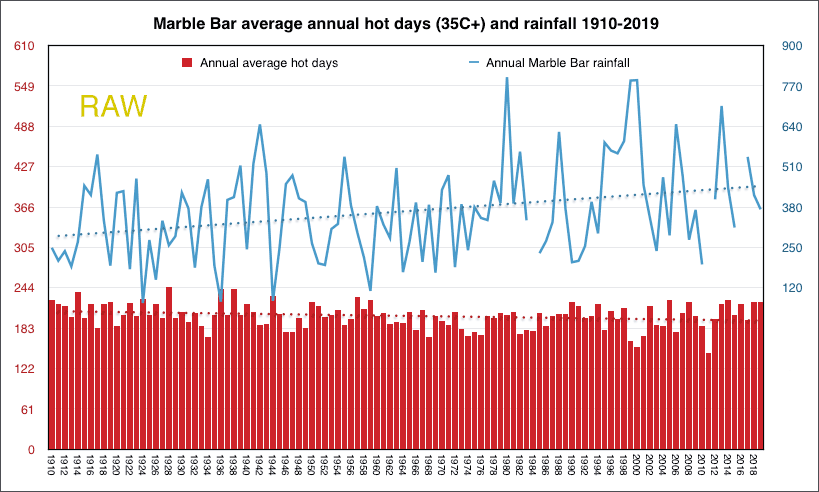
RAW hot day (35C+) annual averages:
1910-1964 206.5
1965-2019 196.7
9.8 fewer hot days per year in 1965-2019 than 1910-1964
ACORN 1 hot day (35C+) annual averages:
1910-1964 196.3
1965-2019 194.2
2.1 fewer hot days per year in 1965-2019 than 1910-1964
ACORN 2 hot day (35C+) annual averages:
1910-1964 191.2
1965-2019 194.8
3.6 more hot days per year in 1965-2019 than 1910-1964
RAW hot day (35C+) annual average temperature:
1910-1964 40.1
1965-2019 39.9
Average hot days temperature 0.2C cooler in 1965-2019 than 1910-1964
ACORN 1 hot day (35C+) annual average temperature:
1910-1964 39.9
1965-2019 39.9
Average hot days temperature the same in 1965-2019 as 1910-1964
ACORN 2 hot day (35C+) annual average temperature:
1910-1964 39.9
1965-2019 39.9
Average hot days temperature the same in 1965-2019 as 1910-1964
Annual rainfall averages:
1910-1964 325.0mm
1965-2019 407.3mm
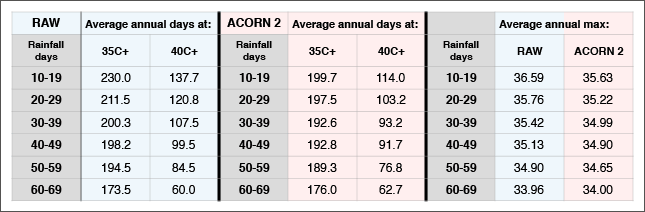
Because annual rainfall can include downpours concentrated over just a few days and there isn’t necessarily any rainfall on cloudy days, another way to identify the correlation between hot or very hot days and cloudy rainfall days is to compare the average number of actual rainfall days each year, rather than total annual rainfall, since 1910.
This clarifies the influence of downpours over a few days but can’t account for cloudy days without rainfall.
The table below shows the averaged number of 35C+ and 40C+ days at Marble Bar in years when 10 to 19 days, 20 to 29 days, 30 to 39 days … 60 to 69 days of rainfall were recorded from 1910 to 2019:
Marble Bar is also noteworthy for recording 200 consecutive days of 35C+ from 5 October 1923 to 21 April 1924, averaging 41.7C, which ACORN 2 has reduced to 179 days from 19 October 1923 to 14 April 1924, averaging 41.5C.
Which dataset do we believe?
Marble Bar, widely considered to be the hottest place in Australia, nowadays has cooler weather and its residents endure fewer scorching hot days than was the case a hundred years ago.
ACORN’s rewriting of Marble Bar’s climate history has warmed the town and encouraged the belief that CO2 is responsible for more hot and very hot days.
If the BoM still believes its 2009 Climate Education web page and argues that Marble Bar retains its heatwave world record because the original 160 consecutive days of 37.8C+ in 1923/24 were valid and accurate, the credibility of ACORN is destroyed as a homogenisation process that persistently cools historic temperature observations around Australia.
But If ACORN is touted as a world-class network that produces accurate historic temperatures, Marble Bar can no longer boast that it holds the heatwave world record.
Either the original observations were accurate or the ACORN cooling adjustments are accurate, and the bureau can’t claim it’s both.
• Further details here, a page with links to further analysis of hot and very hot day frequency in different Australian regions.