Instrument errors, noise, may account for a quarter to one half of our national warming trend in the last century.
When the newspapers run a headline with Sydney hits, say, 44.4 degrees and that number gets engraved in history, who realizes that the extreme heat may have only lasted one second? You might think the maximum temperatures were above 44 for at least ten minutes, but the BOM will write it into the record books even if that heat lasts one second, and if the temperature a minute before was more than a whole degree cooler. We’re writing puffs of jet emissions, car exhaust, or random packets of hot (or cold) air into history books, and comparing these new records with old ones done in slow reacting liquid in glass thermometers. No wonder we are setting records!
In the last twenty years, electronic sensors have replaced most of the old fashioned thermometers. It’s for exactly this reason that we need the side-by-side comparison data that Bill Johnston asked for and which the BOM can’t supply because it is deleting the data – as a matter of routine practice.
Back in 1910, or even 1990, thermometers were not able to record a spike of heat (or cold) that lasted for such a short time. Liquid-in-glass thermometers just can’t react that fast (who remembers waiting with a thermometer under their tongue as a child?)
This is not just about headline grabbing records, but about temperatures recorded every day and used to calculate long term trends. The effect of bringing in newer more sensitive thermometers in the mid nineties could cause a “step up” in maximum temperatures.
The BOM needs an audit. A full independent audit.
Any politician who cares about the climate would order one immediately.
Meteorologists debate whether it should be 5 minute or 7 minute averaging, not 1 second
A paper by Lin & Hubbard in 2008, argued that, even 5 minute averaging was not long enough to avoid some warming bias in maximums (and cooling biases in minima). We don’t have to ask what they would think of one-second “averaging” or sampling rates:
“Commonly-used 5 min average was not sufficient for the fast-response thermometers in surface climate networks while the WMO standard thermometer (20 s time constant) should have a 7-min running average for reporting daily maximum and minimum temperatures. The surface temperature sensors with smaller time constant than the standard LIG [Liquid in glass] thermometers must implement a follow-up running average algorithm.”
The story of strange temperature mismatches appearing
A few months ago, Ken Stewart and others in the independent BOM Audit team (like Lance, Phill, Ian, Chris, Bill, Geoff, Bob and Tony) were watching the various BOM data channels when they noticed strange mismatches. The live update BOM observations page records temperatures every 30 minutes at hundreds of sites across Australia. Sometimes though, the daily maximum temperature would lie far above any of the 30-minute observations. Stewart wrote to the BOM to find out why, and was shocked to hear that the 30 minute data was not the average of the last 10 minutes, or even the last single minute. It was just a random sample of the data the second before.
So Ken asked for the detailed data (and paid for it) so he could graph and see how long the temperature spikes were lasting. But what he found was that readings would sometimes erratically rise and fall, chopping up, down and up, and the spikes — were often outliers, far beyond normal variation. And there was no apparent mechanism to remove these noisy errors either (at least, not on the high side). And normally noise is not so important – it cancels out when numbers are averaged — but when only the highest moment (or the lowest) is recorded, there is no averaging among the Maxes, and nor the Mins — though the cooler extremes are less affected by the spikes and rapid changes that are going on in the hottest part of the day.
Sometimes a temperature two whole degrees above the rest of the readings was being recorded for posterity as the the daily max, which may theoretically be also recorded as the hottest day ever… See these graphs below and be prepared to change the way you think about “record temperatures”.
To find out how often these spikes occur, Ken graphed how fast temperatures changed within one minute of the daily maximum temperature being reached — and fully 44% of all the readings he looked at, the temperature fell more than 0.3C within one minute. In theory these electronic thermometers are supposed accurate to 0.2C, so swings this fast could be due to pockets of warm air coming and going (like a jet turbine) or they could be errors (or both). In 200 cases Ken found five situations where the one minute drop after the peak temperature was reached was 0.6C – 1.5C!
More importantly — the entire 20th century warming trend — as Ken points out — is only 0.9C. If these thermometers are picking up noise spikes as big as two degrees, it’s no wonder the BOM doesn’t put error bars on the century long trends.
There have been no studies published of automatic electronic thermometer probes and the old fashioned liquid in glass thermometers side by side.
How Temperature Is “Measured” in Australia: Part 1 by Ken Stewart
Record temperatures, maximum and minimum temperatures, and monthly, seasonal, and annual analyses are based not on daily values but on ONE SECOND VALUES.
The Bureau reports daily maximum and minimum temperatures at Climate Data Online, but also gives a daily summary for each site in more detail on the State summary observations page , and a continuous 72 hour record of 30 minute observations (examples below), issued every 30 minutes, with the page automatically refreshed every 10 minutes, also handily graphed.
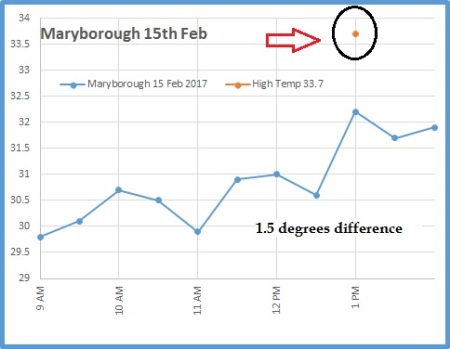
In Maryborough on the fifteenth of February this year the daily maximum was recorded as 1.5C above the highest 30 minute data point.
At Harvey Bay, the temperature was 2.1 C below the reading at 6am.
I sent a query to the Bureau about Hervey Bay, and the explanation from the Bureau’s officer was enlightening:
Firstly, we receive AWS data every minute. There are 3 temperature values:
1. Most recent one second measurement
2. Highest one second measurement (for the previous 60 secs)
3. Lowest one second measurement (for the previous 60 secs)
In Stewart’s words:
The temperature reported each half hour on the station Latest Observations page is the instantaneous temperature at that exact second, in this case 06:00:00, and the High Temp or Low Temp for the day is the highest or lowest one second temperature out of every minute for the whole day so far. There is no filtering or averaging.
The BOM tries to explain why:
The explanation for the large discrepancy was that “Sometimes the initial heating from the sun causes cooler air closer to the ground to mix up to the temperature probe (1.2m above ground).”
However… it can be seen that the wind was south east at 17 km/hr, gusting to 26 km/hr, and had been like that all night, over flat ground at the airport, so an unmixed cooler surface layer mixing up to the probe seems very unlikely.
You will also note that the temperatures in the final second of every half hour period from 12.30 to 6.30 ranged from 25C to 25.5C, yet in some second in the final minute before 6.00 a.m. it was at 23.2C.
How to spot natural versus unnatural temperature changes
In Part 2, How Temperature is “Measured” in Australia Stewart describes what the differences are between natural and unnatural temperature fluctuations, and looks at the noise levels on minima compared to noise levels on maxima.
Not all quick changes are unnatural.
Temperatures can change quite rapidly in a natural setting — for example, as the sun rises over an inland spot (like Urandangi) temperature rise 5.1C in 24 minutes. So that’s a sustained rapid rise of 0.2C a minute. Fast! But we wouldn’t expect to find rises that are faster than that in coastal situations, or ones that happen during the middle of the day. We also wouldn’t expect to find cool changes that come and go in a minute – flip flopping from warm to cold to warm. We know that cold fronts and other changes can come through and drop temperatures rapidly (as Ken describes, like a 1.2C fall over 1 minute in Rockhampton) — but these are step up or step down changes that are sustained after the shift.
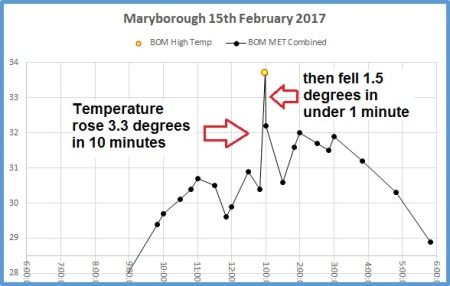
What’s not natural are spikes like this in Maryborough where temperatures rise 3 degrees in ten minutes then fall 1.5 degrees in just one minute straight afterwards.
” …rogue outliers are being captured as maxima and minima.”
Doesn’t noise just cancel out and won’t this make minima cooler too?
The errors don’t cancel out — high spikes are recorded as the max of the day. The noise that trends downwards (and is cooler) during the hot part of the day is not recorded in the long term climate records. (As is hot noise during the coolest part of the day). As Stewart points out during the warm part of the day “only the highest upwards spike, with or without positive error, is reported. Negative error can never balance any positive error.”
Stewart analyzed both the hot and cold parts of the day and found that there is a lot more variation during the hot part of the day. As well, the Bureau was caught clipping low side “noise” (and even low side real measurements) at Goulburn and Thredbo a couple of months ago. They have not answered questions about when this clipping started, and which stations it applies to. They are doing an inhouse review instead.
Ironically, because there will be a smaller cooling effect, as well as the larger warming one, it will mean the DTR (Diurnal Temperature Range) will be increased. This is not what the CO2 modelers are looking for. They expect CO2 to shrink that diurnal range by keeping the heat in at night and bringing up the minima.
Instrument errors may account for a quarter to one half of our national warming trend in the last century:
There is some ambiguity about the error margins of the electronic AWS sensors, is it +/- 0.2 or +/- 0.5? In 2011, the BOM mentioned that 10% of electronic thermometers are functioning outside the +/- 0.2 range that is more than 50 probes in the network.
Stewart concludes that because these one-minute differences are so common he thinks it’s likely nearly half of the high temperatures recorded may be 0.2C too high, saying that “Instrument error may account for between 22% and 55% of the national trend for maxima.”
Stewart has a wish list of things that need fixing which include replacing automatic electronic sensors at at least 50 sites. Obviously the Australian BOM should not be using one-second samples but something more like ten minute averaging. He wants the BOM to show error bars on all it’s long term trend calculations. He wants the BOM to redo their filters so they can identify their spurious spikes.
Jen Marohasy has just posted on this also, in her words, it shows twenty years of measurements are “not fit for purpose”.
I naively thought that the ‘raw data’ was mostly good data. But now I am even sceptical of this.
As someone who values data above most else – this is a stomach-churning revelation.
Indeed, it could be that the last 20-years of temperature recordings by the Bureau will be found not fit for purpose, and will eventually need to be discarded.
Just yesterday I wrote a rather long letter to Craig Kelly MP detailing these and other concerns. That letter can be downloaded here: TMinIssues-JenMarohasy-20170831
To repeat: The BOM admits temperature adjustments are secret and thus completely unscientific. If we had a team to audit the dataset, as we requested in 2011, or to replicate the data as I requested in Sept 2014, this erasure of cold temperatures would have been fixed by now.
Read all of Ken Stewart’s work and see all the graphs:
- How Temperature Is “Measured” in Australia: Part 1 by Ken Stewart
-
How Temperature is “Measured” in Australia: Part 2
BACKGROUND
- Another BOM scandal: Australian climate data is being destroyed as routine practice
- BOM scandal: “smart cards” filter out coldest temperatures. Full audit needed ASAP!
- BOM scandal heats up: Kininmonth, Watts, Nova quoted in The Australian “We audit banks, why not BOM?”
- Scandal: Australian Bureau of Meteorology caught erasing cold temperatures
Thanks especially to Geoff S, Phil, Lance as well as Ken Stewart and Jennifer Marohasy.
REFERENCES
Lin & Hubbard (2008) What are daily maximum and minimum temperatures in observed climatology? INTERNATIONAL JOURNAL OF CLIMATOLOGY Int. J. Climatol. 28: 283–294