Questions about the BOM spread: “Adjusted Temperatures Need Explaining” by Tony Cox in the Newcastle Herald. Jennifer Marohasy picks it up and draws attention to the situation of Newcastle temperatures, which were recorded at Nobbys Signal Station, near the Lighthouse at Nobby’s Head.
Old Trove archive records show that in the 1939 heatwave there were protests that Nobby’s Head temperatures were too cool to represent the real heat going on in Newcastle because it is exposed to good sea-breezes. (h/t to Siliggy)
The BOM page for Nobby’s links to this graph of the raw data.

The raw data from Nobby’s shows a hot period in the late 1880s. This is Climate Data Online or CDO.
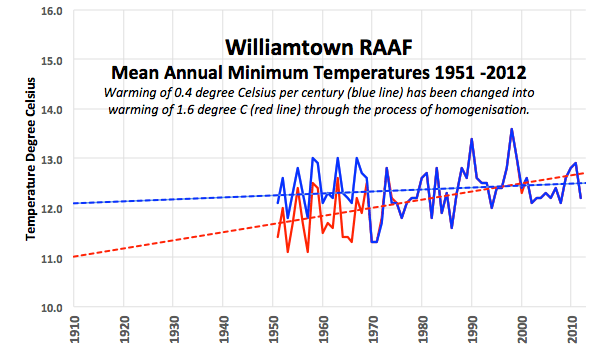
Jen Marohasy points out that the BOM ignore this long record and use Williamston RAAF near Newcastle instead as one of the 112 stations to calculate national trends.
Note the trends…. adjusted of course.
…
Marohasy argues that the BOM ignore the better long record and use the shorter airport instead:
“…it’s not the best temperature series for the Newcastle region. It only starts in about 1951. A much more comprehensive record, but one that is conveniently ignored by the Bureau in the development of the official temperature network, comes from the Nobby’s Signal Station, Newcastle. This record starts way back in 1862, and guess what, like most of the really long records it shows that it was much warmer in the late 1800s than for any time since. In fact the hottest years on record are 1877 and 1878.”
So is there a good reason to ignore Nobbys? I would like to know.
I went hunting for reasons, but came up empty. The basic site summary for Nobby’s tells us thermometers were installed in 1862 and removed in 2001. The Equipment history is on page 14. Most thermometer changes are in the last 14 years. There are no site changes recorded from 1862 – 1998 — though the report warns that historical data may not be switched over from paper records to PDF. It’s probably incomplete.
The Metadata for the Newcastle temperature record up until 1993 was summarised by Torok (1996) from the official station correspondence as follows:
Record of Changes in temperature measurement at Newcastle (BOM No. 061055)
1922 Dec: First official correspondence.
1943 Dec: Building to occur.
1955 Dec: Screen moved 40 feet west due to construction of tower.
1965 Aug: Screen stand is 6 inches too low and painted black.
1975 Oct: Building has rendered site poor.
1989 Feb: Screen recently moved out of enclosed position.
Source: (Torok, 1996, Vol 2 p. 255). Warwick Hughes site has links to the Torok PhD thesis, Appendix A.
The BEST project looked at Nobby’s and published their version here. They list the reasons for continuity breaks.
“A further column dates at which the raw data may be subject to continuity “breaks” due to documented station moves (denoted “1”), prolonged measurement % gaps (denoted “2”), documented time of observation changes (denoted “3”) and other empirically determined inhomogeneities (denoted “4”).”
When I look at their breaks I see a “2” then several “4s”. Did I miss any? That would mean that apart from a gap in measurements, all the BEST adjustments are thanks to “empirically determined inhomogeneities” Does this mean statistical tests? How does any statistical test on noisy data figure out what is a unrecorded station move and what is a step change in climatic patterns? The BEST adjustments are not due to site changes that they have documentation for. What does empirical data mean anymore if it is adjusted post hoc for no physical known reason?