The Australian Bureau of Meteorology uses “surrounding” thermometers to adjust for odd shifts in data (caused by things like long grass, cracked screens, or new equipment, some of which is not listed in the site information). The Bureau fishes among many possible sites to find those that happen to match up or , err “correlate” during a particular five year period. Sometimes these are not the nearest site, but ones… further away. So the BOM will ignore the nearby stations, and use further ones to adjust the record.
These correlations, like quantum entanglements, are mysterious and fleeting. A station can be used once in the last hundred years to “correct” another, but for all the other years it doesn’t correlate well — which begs the question of why it had these special telediagnostic powers for a short while, but somehow lost them? Or why a thermometer 300km away might show more accurate trends than one 50km away.
One of the most extreme examples was when Cobar in NSW was used to adjust the records at Alice Springs –almost 1500km away (h/t Bill Johnston). That adjustment was 0.6°C down in 1932 (due to a site move, we’re told). This potentially matters to larger trends because Alice Springs is a long running remote station — the BOM itself says that Alice Springs alone contributes about 7-10 % of the national climate signal.[1] Curiously Cobar itself was adjusted in 1923 by a suite of ten stations including Bendigo Prison which is another 560 km farther south in a climate zone pretty close to Melbourne. In 1923 Cobar official temperatures were adjusted down by a significant 1.3 °C. No reason is given for this large shift — a shift larger than the entire (supposed) effect of CO2 in the last hundred years.
Ken Stewart reminded me of these extreme records because he’s been hunting this week, and found some even longer ones.
Mount Gambier, in South Australia, has been adjusted with the help of Lismore in northern New South Wales, 1,526km away. (And it’s not as if there is a shortage of sites in this well populated part of South Australia.)
But the gong, the gold medal, the record breaking achievement for the Bureau, goes to…….
Alice Springs, in the Northern Territory, which has been adjusted using data from Collarenebri in New South Wales, 1,590 kilometres away.
See below on the map, the smattering of sites used to “correct” four different records in Australia: Albany, Alice Springs, Adelaide, and Gabo Island.
For foreign readers, bear in mind that it’s 4,000 km (2,500 miles) from one side of Australia to another.

Figure 5: A map of sites used to homogenize thermometer data in Albany (red), Alice Springs (purple), Adelaide (light blue), and Gabo Island (yellow). Obviously distances are very large and sometimes comparator sites are on the far side of mountain range
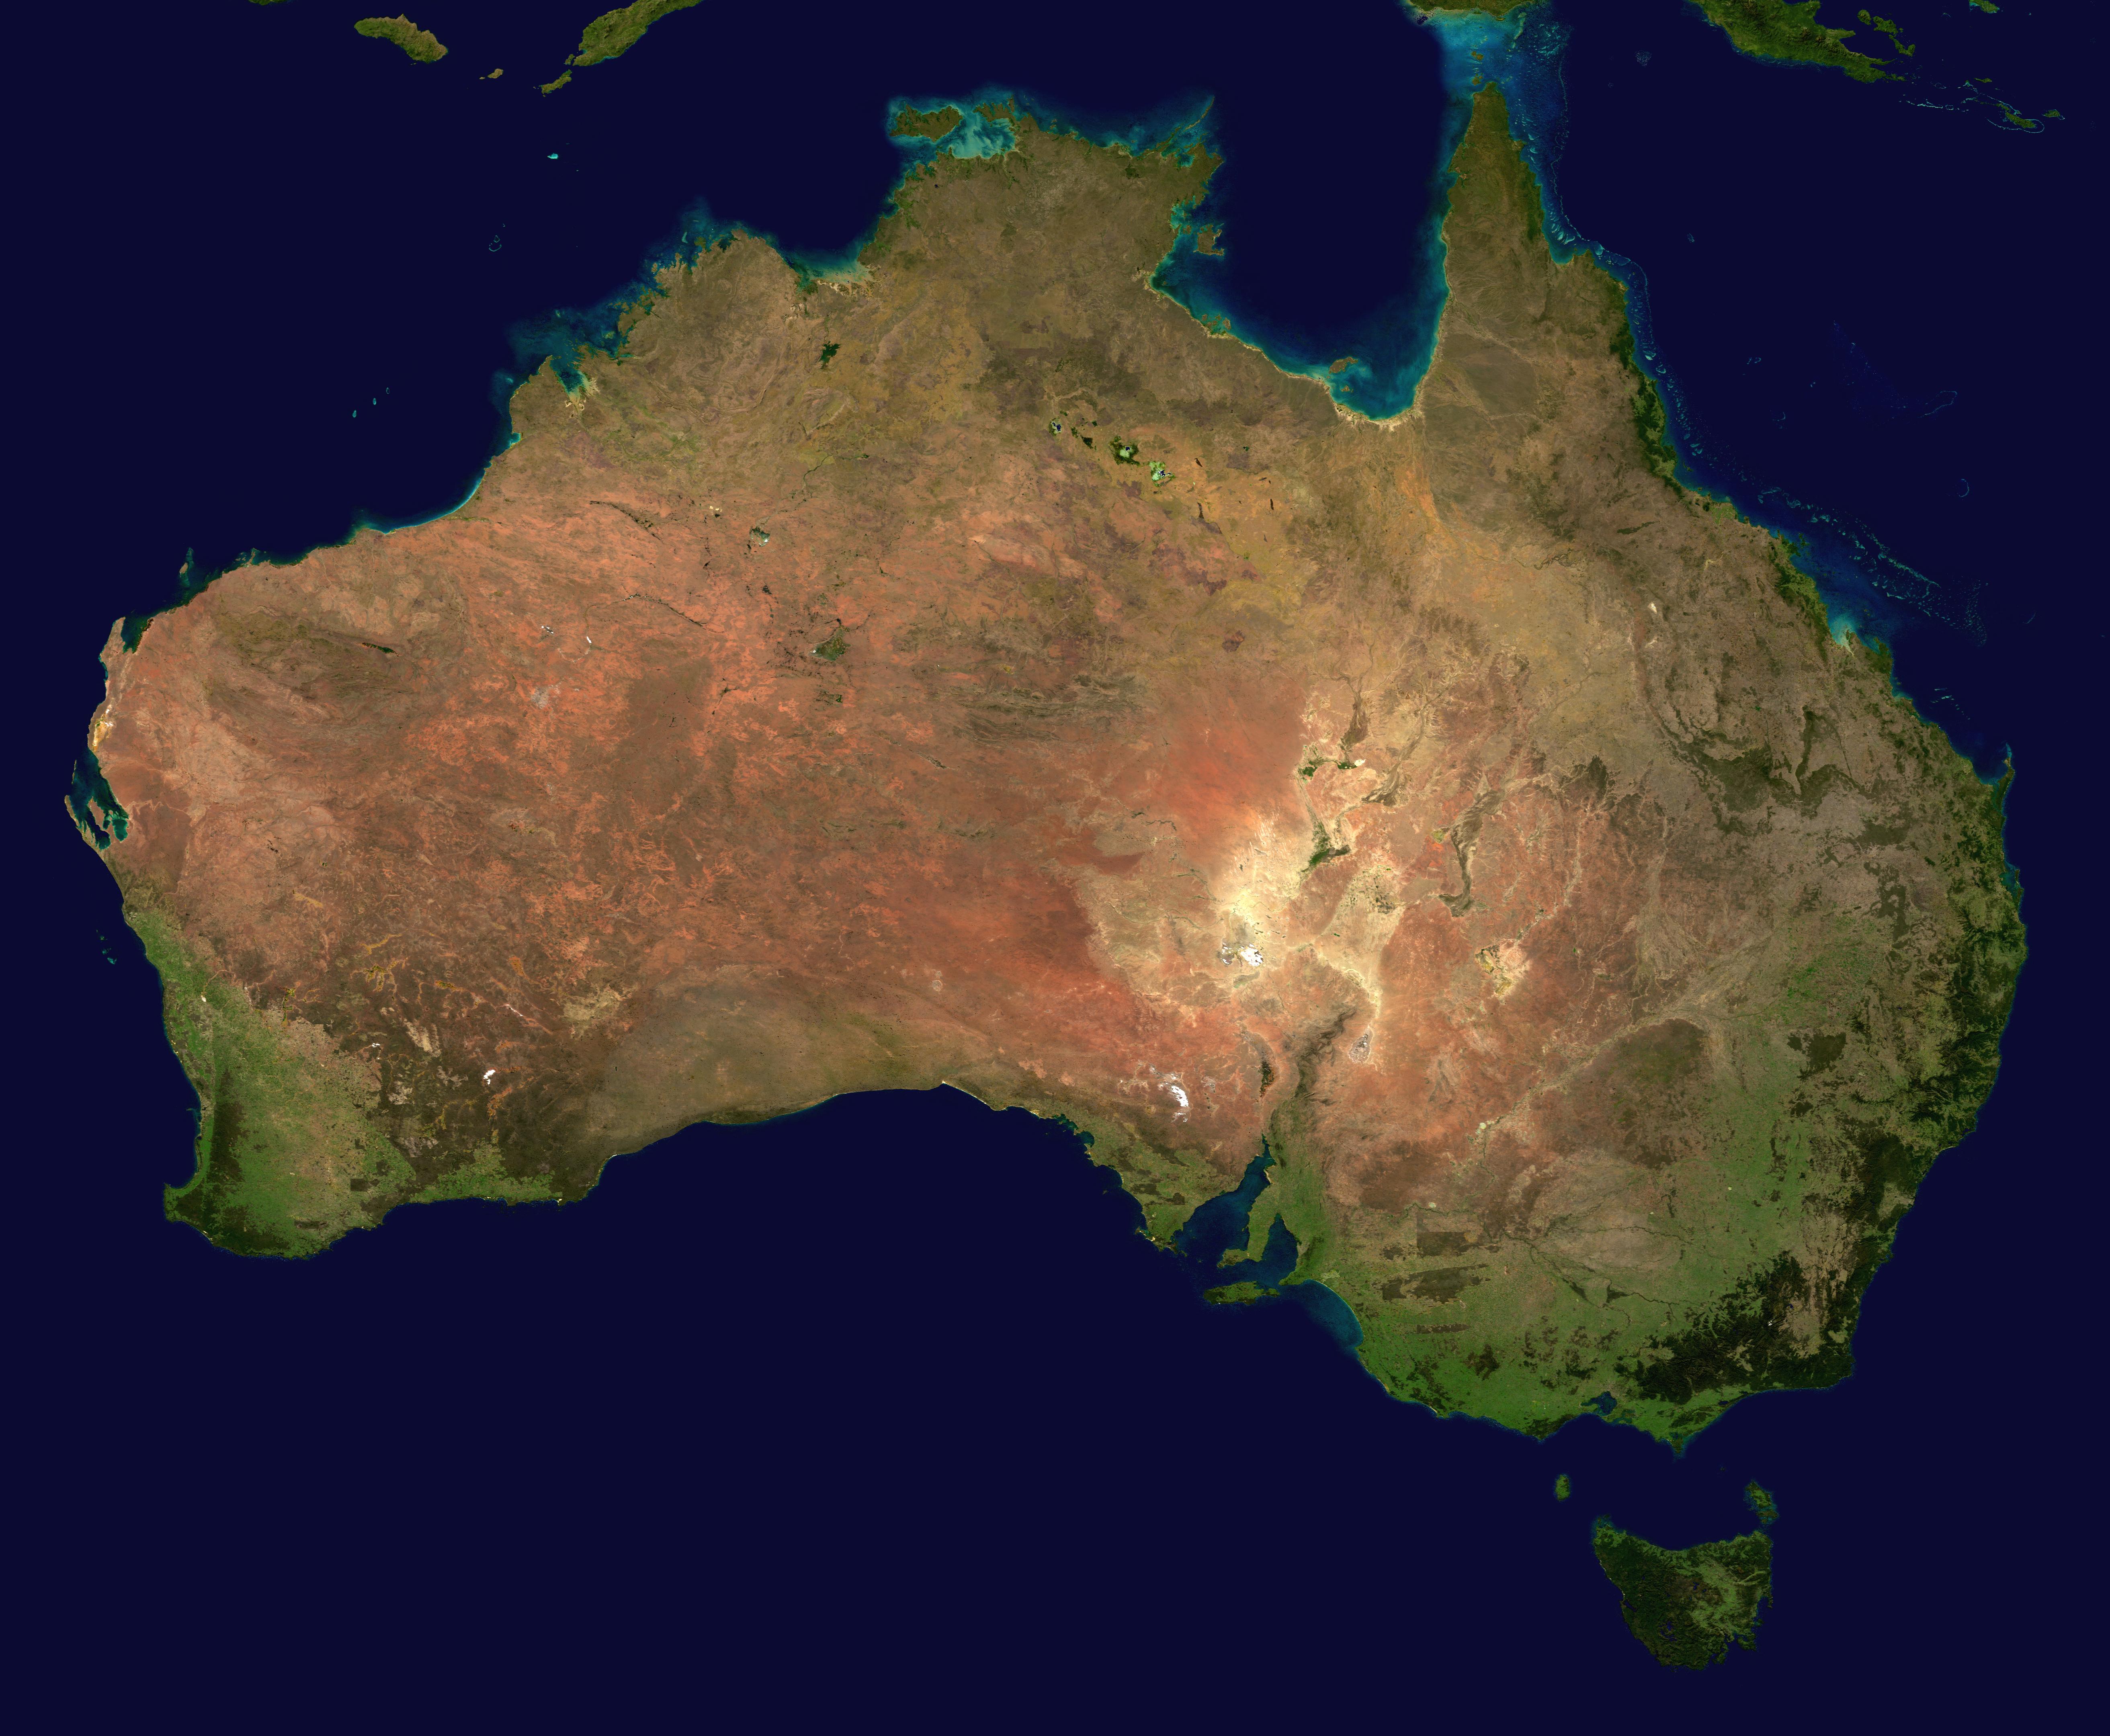
TonyfromOZ points out that the scale is easier to understand in this sort of map:

Australia and contiguous USA are roughly the same landmass. From truesize.com
While Alice Springs involves the most ridiculous distances, there are plenty of freakishly odd entanglements — like Hay, and Gabo Island. The latter thermometer is on an island in the Bass Strait, but the former, in Hay, is nearly 600km away, over the water, on the other side of the Great Diving Range, and far off, in a hot dry plain. Yet Hay in NSW was used to adjust the Gabo Island lighthouse data in 1920 and 1927 – but not in other years when the “teleconnection” between them apparently broke. Pfft. Just like that.

The climate can be really very different on either side of the Great Dividing Range, yet all these stations were used to correct Gabo Island.
We’ll be revisiting the joys of continental thermometer correction and the many permutations and combinations of statistical fun that can ensue. Because the BOM doesn’t have good metadata and isn’t starting with a full documentation search (like skeptics do) they don’t know which sites are good sites, (or were good sites) and can use bad data to ruin good data.
If you got a million dollars a day to study Australia’s climate, and you cared about it, you might think that getting all the historical documents in order would be your first priority. Others however, prefer to use statistical analysis and search for teleconnections in the data.
Many thanks to Bill Johnston who explained how homogenization works (inasmuch as anyone outside the BOM can know) and Ken Stewart, Siliggy, Chris Gillham, and the rest of the BoM unofficial auditors for their unpaid excellent help. And to Jennifer Marohasy who keeps doggedly asking about homogenization.
[1] Australia’s climate data FAQ, Australian Bureau of Meteorology, August 2015, p 25.
http://www.bom.gov.au/climate/change/acorn-sat/documents/ACORN-SAT_TAF_FAQ.pdf
http://www.bom.gov.au/climate/change/acorn-sat/documents/ACORN-SAT-Station-adjustment-summary.pdf
Image Wikimedia copy from NASA Earth Observatory


The Bureau of Mismanagement was, yesterday on their alpine forecast page, advising of snow and sub-zero temperatures for the high country of both VIC & NSW during the next few days. Perhaps with the help of “Mike’s nature trick” and a little homogenisation via Alice Springs they can turn those ‘negative’ numbers into positives. Not sure if their editing prowess can alter webcam images yet: will check mountainwatch.com soon to see how many centimetres of ‘runaway warming powder’ has accumulated so far. It is October isn’t it?
200
I heard NZ had their hottest winter everrr this year. NIWA is in step with our lot in an attempt to push global warming.
120
Well Bill G*tes has been advocating a “climate lockdown” , now that they have trained us how to respond to thier other little “gifts”, to help us devwelop pavlovian-style responses to other triggers….
Spot the globalist agenda….
https://www.climatedepot.com/2020/09/25/soros-gates-funded-6-5-million-to-group-now-warning-world-may-need-climate-lockdown/
“”Soros & Gates Funded: Now Project Syndicate (PS), a group both Soros and fellow liberal billionaire Bill Gates fund, is peddling a tyrannical proposal. Specifically, the group is pushing an eco-extremist idea that the world may need a “climate lockdown” to preempt climate change unless we have a “green economic transformation.” …
90
Glen, too true. They crave headlines when a nor’wester raises the mercury to mid-20s, yet the following day when a cold southerly roars through, dropping temps AND snow… deathly silence, nary a squeak, nuffink!
You may not have heard about a little wildfire last Sunday on the shores of Lake Ohau (means ‘place of wind’) near Mt Cook. A ‘lifestyle subdivision’ has developed over the years next to the lake – tiny plots for holiday homes in amongst trees – next to a DoC reserve full of wilding pines and unkempt tussock. When a roaring NWer caused powerlines to arc in the wind, boom! All the residents escaped yet everything was burned to a cinder.
Ex-NIWA climate-cook, ‘Dr’ Jim-jam Salinger, was quick to get air-time, claiming our ‘carbon pollution’ had caused the ‘unprecedented’ heat, and that before Europeans arrived, bush fires were ‘unknown’ in this land. Say what?! Nature had the last word, however, as the next day a southerly came through and SNOW began falling on the embers. Will they ever learn?
70
I notice Sea surface temps have been on the warm side. I rest my case.
20
Of course, so many wood fires, reverse cycle air conditioning, gas heaters, electric blankets and others in use.
And Ugg Boots on feet of course, it is NZ.
40
RE: Jennifer Marohasy
What’s the bet they don’t use her footage of reef health …
http://joannenova.com.au/2020/10/yet-more-footage-of-great-barrier-dying-reef-not-dying/
Makeshift research fleet undertakes first Great Barrier Reef ‘census’ citizen science project
https://www.abc.net.au/news/2020-10-08/citizens-of-the-gbr-launch-great-reef-census/12711870
“Snorkellers and recreational divers can carry out the surveys, which involve swimming along a reef and taking a photograph every 10 metres.”
140
Just to get a political grip on the possibility of an audit.
‘Hunt’s successor, Josh Frydenberg, similarly refused to have an audit. Both turned a blind eye to the BoM’s unscientific obsession ….’ Oz
180
Perhaps the Bureau of Misinformation can import some temperatures from the back of Bourke to explain this …
BoM, 2008: “IT MAY be time to stop describing south-eastern Australia as gripped by drought and instead accept the extreme dry as permanent, one of the nation’s most senior weather experts warned yesterday.
“Perhaps we should call it our new climate,” said the Bureau of Meteorology’s head of climate analysis, David Jones.”
https://www.smh.com.au/environment/this-drought-may-never-break-20080104-gdrvg6.html
BoM 7 Oct 2020: Victoria weather warning for heavy rainfall and possible flash flooding as La Niña arrives
https://www.abc.net.au/news/2020-10-07/warning-for-heavy-rainfall-flash-flooding-northern-victoria/12738556
BoM: significant rainfall and flooding for part of southeastern Aust, 6 Oct 2020
https://www.youtube.com/watch?v=08CGdyLHHA0
It can’t be coal what done it … Australia’s coal consumption at 25-year low in 2018-19
https://www.argusmedia.com/en/news/2146636-australias-coal-consumption-at-25year-low-in-201819
110
To quote that (in)famous Green Ocker Rocker Extraordinaire (GORE) band, ironically named Midnight Oil,
‘Short memory, must have a…’
10
It is a basic law of experimental science that you do not adjust the original data. Even known instrumental errors are added to the original data which is unchanged. If you have predictions you have to fit the predictions to the data, not the data to the predictions. In any extrapolation or interpretations there are many assumptions and adjusting the data means the truth now contains the conjecture and cannot be used to prove or disprove the same conjecture. Why the BOM decided that adjusting raw data was the way to practice science needs explanation.
That the temperature 600km away should have any bearing needs explanation. This practice of adjusting raw data is based on wrong science.
I can understand that people see the need for smooth charts eliminating local and perhaps severe variations, even from one hill to the next, but with the massive computer power available for analysis why change the data? And then publish that as reality, even history? It is not. It’s mythology. And we suspect with the presumption of man made global warming built in.
Which then ‘proves’ the idea for the whole planet as Australia is the major source of Southern Hemisphere data for the last century. But that may be the explanation. Global politics mixed with science.
The raw data should never be adjusted. Who started that idea and why?
391
Blair was not the principle architect, but his fingerprints are all over it.
https://theconversation.com/profiles/blair-trewin-3692
22
Get it right el gordo. The principle architect sounds like some sort of manufacturer of ethics; try principal, or leading, architect.
80
Ta, my bad.
The leading light is a mystery, but I suspect he was parachuted in to create the right environment.
11
Guilty, yer worship! A plodder within the circle who assumed the responsibility for pushing this stuff.
20
Hansen, Lebedeff 1987 is why it’s become acceptable to change raw data to fit the narrative.
Just like Hansen et all 1984 is how it became acceptable to horribly misrepresent Bode’s linear active feedback amplifier analysis in order to override the Stefan-Boltzmann Law as it relates to the non linear, passive relationship between W/m^2 and temperature.
Hansen’s fingerprints are on so much of what’s wrong with climate science. Ironically, part of his justification for promoting bad science as a means to an end was to promote more nuclear power.
90
Not to mention the hockey stick artefact which followed Piltdown Man methodology.
70
I don’t know where to start with your misunderstanding of science (basic law???) but I think I have solved one problem for you.
Your statement about adjusting the original data is not true – they keep the raw data. It is still there, undeleted and unchanged. Somehow they are able to change it for different analyses and preserve the original unchanged. What magic is this?
Now, raw data in every field of science since people started sciencing gets used in all sorts of ways to find new things and is rarely, if ever, presented on its own. You know that though don’t you?
413
In science raw data is never “adjusted”.
112
Rubbish. For a start we are talking about instrumental data which uses a proxy for temperature and spurts out a number. Think of a bulb thermometer. It is actually the distance a liquid travels up a narrow tube. the raw data is distance. The instrumental data is read from the calibrated marks on the tube that a human put there.
So every one of those old readings is a human looking at an instrument and interpreting the distance travelled of a liquid. The raw data was never recorded.
once that raw data is written down it is never changed but you object to someone sticking it into some software and doing stuff with it? Why?
216
That’s a very silly and tortured attempt at sophistry. “and interpreting the distance travelled of a liquid.”. No, that’s why the marks are there. The temperature is noted, not interpreted.
The instrument was calibrated and the marks were placed there by the manufacturer. You are explaining to yourself the way thermometers work by expansion of a liquid up a tube, not the way the calibrated instrument works by reading of the marks.
131
as my quote shows. The raw data is still there so you are safe from tampering with history.
217
If raw data is never adjusted why was Bourke data given the red pen treatment and changed GeeAye ?
120
“Now, raw data in every field of science since people started sciencing gets used in all sorts of ways to find new things and is rarely, if ever, presented on its own.”
Complete rubbish. That is utterly wrong.
The fundamental job of science is to predict the raw data. The slightest variation is a clue and that has led to many discoveries. It is how neptune was discovered, by the slight ‘errors’ in the orbit of uranus. Variations of real data from the model are the key to all science. Making the world perfect by homogenization make the facts fit the model. This is philosophically abhorrent to a scientist.
201
“I don’t know where to start with your misunderstanding of science (basic law???)”
Ditto
111
Raw data
Molecular biology. Missing raw data. No raw data, no science.
even Nature Like many other journals, in addition to asking authors to complete a reporting checklist to ensure that key experimental approaches are adequately described, for Western data we require authors to provide original raw data for all blots and gels in articles to be accepted.”
You can check for yourself and the Lawsuit by Michael Mann against Peter Ball in the Canadian Supreme Court fell over because Michael Mann promised to the court and then refused to supply the raw data.
“What happened was that Dr. Ball asserted a truth defense. He argued that the hockey stick was a deliberate fraud, something that could be proved if one had access to the data and calculations, in particular the R2 regression analysis, underlying it. Mann refused to produce these documents. He was ordered to produce them by the court and given a deadline. He still refused to produce them, so the court dismissed his case.”
A hypothesis is the testing of a proposition against the data. And underlying that is the ability to reproduce the raw data. If the raw data is not available, the theory cannot be disproven but also it cannot be reproduced and increasingly it is being reasonably argued that the theory is not proven and potentially completely wrong, if not fraudulent.
161
The raw data in molecular biology is a computer output that needs to be available for scrutiny. The publications are based on what is done with the data not the raw data which is utterly incompressible without adjustment.
213
Computers are not science. They are computers. All data is taken from instrumental observations and these days computers are used for everything but that is a straw man argument. Computers are not making the conclusions. People are or programs written by people based on algorithms which have a model included. For proof you need reproducibility. Which means access to the raw data from the instruments, the algorithms or routines and any filtering. That means all the data, not just data which fits the conclusions.
So by what magic was the temperature in Cobar used to adjust the temperature in Alice Springs? You cannot adjust the temperature 600km away. It is not the output of a model or a computer program. It is hard data. The temperature at Alice Springs. It was measured by a thermometer in Alice Springs! And now it has been changed. That is not science. That is wrong.
241
Raw data incomprehensible without adjustment? BS! The raw data is far more comprehensible than any homogenised crap. We are not talking about encrypted data that needs decoding to make sense. We are talking about temperature data even a child can read.
180
have you tried to read terabytes of data from fluoresnce detectors? I prefer to a computer to read that rather than spend human lifetimes reading it.
10
And temperature is perfectly ‘compressible’ as raw data. The only measurements which as simple are length and weight.
62
And a corollary of that is apparent from this case, that the need to see the calculations which transformed the raw data into the published data which can also be at fault, as is so often the case. In effect by not winning his lawsuit against Dr. Ball’s implied statement of criminal fraud leaves Michael Mann guilty of fraud under Canadian law.
In American law he has in effect taken the fifth amendment, the right not to self incriminate. This is amplified by the fact that Mann claimed that his publicly funded research was his own personal intellectual property and so by his own action, his conclusions stand unproven. Goodbye Hockey Stick.
172
And as even the journal Nature points out, they want to see ALL the raw data, not just the data handpicked to match the predictions. This is another device which enables fraud. As Dr. Ridd points out, a photograph of the Great Barrier Reef showing a damaged area when a photograph a few meters to one side shows pristine healthy reef. Selecting your data to match your conclusions is another major problem, far more common in biological sciences where the amount of variation is so high.
141
gee aye, I cannot possibly agree with your reasoning regarding the manipulation of ‘raw data’.
The simple ‘pub test’ is all I need to tell me that your analysis is incorrect.
GeoffW
70
I understand that the original authors of the “modify the data to suit the theory” school of science were the Climate Research Unit at the University of East Anglia. They even went so far as to throw away the original data so that nobody could come back later and audit what they’d done.
10
For the lurkers, if you lower past temperatures then the present is artificially hotter. Darwin is a good example.
https://wattsupwiththat.com/2019/02/22/changes-to-darwins-climate-history-are-not-logical/
120
Why don’t they just use the temperature of the site as recorded?
Would be a lot quicker. Oh, perhaps that’s the reason…
150
Meteorologists or magicians or manipulators , instead of recording temperatures they’re manufacturing them !
110
The inability to trust historical data means that policy is based on fake news. The current corona virus is an example where the definition of death from corona virus varies so much from country to country there is no idea what the real figure is. Unfortunately politics is the major determinant of what constitutes historic facts.
When data can’t be manipulated to suit your narrative just make it up. When the BOM changes data in such an arbitrary way why bother to try to invent an excuse for doing so, just do it and don’t say anything. The MSM and government will never hold them to account unless it doesn’t match the narrative.
90
And that narrative is to keep harping about reducing our emissions. Amazing to watch this nation destroy itself. Let’s see how close we get to achieving that goal before enough people wake up and say enough is enough on this emission reduction nonsense. Alternatively, if people really believe that reducing emissions is that important then we ought to go fully nuclear ASAP. Of course that’s not going to happen for other silly reasons so let’s stick to the current game plan to reducing our emissions, right? Stupid is as stupid does.
150
If you want to get some idea of why this is all happening, Jo mentioned a few posts back about Tucker Carlson and a book he had published “ship of fools”. It is possible to download this from the web as a pdf 179 pages so not all that long and very easy to read. Lots of the content is anecdotal (which is what makes it interesting) but its also pretty chilling reading. One can easily see relevant examples from events in Australia. Tony Abbot cf Trump. The scandal over the computer room exclusively for aboriginals in Queensland, the censorship and cancel culture in Australian universities. eg: the cancellation of Howard Brady’s very respectful and utterly non threatening talk. Even the radically different response by the Victorian government to the BLM protest vs the protests over lockdown. Very well worth reading and very worrying. How does one break through such a barrier? Popular opinion? Dont forget the media control information to most of the population and they are an integral part the “ship of fools”.
170
Look at it this way. The ship of fools will hit a rock or something eventually and sink. Those of us who are aware of the coming disaster have ready access to a life boat to avoid being drowned.
60
What lifeboat? Civilization is a big ship on a vast and hostile ocean.
53
Replace water with Lake of Fire and I think you will know what I’m talking about.
30
The liberal application of “Narrative Smoothing” – how very “scientific”.
40
Surely that should read: the assumed effect of CO2 ….
130
Agreed. That is non science, an abomination.
When an alleged scientist a hundred years later decides that his calculations are more accurate than a man reading a thermometer and writing the result with a fountain pen on paper, science is dead in meteorology. The man is being told the temperature was not what he saw with his own eyes because a computer model involving temperatures up to 600km away says so. It is the triumph of models over facts, the end of the scientific method and even the rewriting of history.
The only upside of this new ‘science’ is that error bars are no longer needed and points will always be on the curve. If they are not, you just move them. And then publish the results as reality. It will make graph drawing a lot easier. You just put the data points on the curve.
The BOM scientific method:
1 Define purpose.
2 Construct hypothesis.
3 Test the hypothesis and collect data.
4 Analyze data.
5
Draw conclusion.Change data to match hypothesis. Call it ‘homogenization’6 Communicate results. (Publish changed data as fact)
131
MCMXLIII. You are correct. Post fixed. Thanks.
30
The BoM stance seems to be an arrogant: the record we produce is our interpretation of the available raw data, if you don’t like it do your own record.
Reproducibility is fundamental to science and that would be the role of a thorough taxpayer-funded independent audit.
80
Joanne mentions this one line, almost a throwaway:
Here’s something that got me into so much trouble.
Back when I was starting out ‘blogging’, I was in the middle of my 50 part Series on Kyoto.
Once I had become settled into doing that, the owner of the blog I was contributing to mentioned that readership had gone up, and perhaps I might like to write a short series on Australian history.
So I did just that. In part one of the Series, I painted a picture of the lead up to when Australia was discovered and then settled. As part of that first Post, I included two images, one showing the relative sizes of England and Australia, and a second image showing the relative size of Australia when compared to the United States of America. All innocuous enough really, until the rush of emails a day later, from a friend I have in the U.S. who was now reading all my Posts. He had been fielding phone calls from a number of his friends who questioned the image showing the comparison of Australia and the U.S. and could I remove the image and find one that was correct.
Not one of his friends, nor him, actually believed that this was the case, that Australia was almost the same size as Continental U.S. and it took me literally days and many emails to assure him that the image was in fact correct. He told me that when it came to Australia, people in the U.S. knew nothing at all, were not taught about anything even remotely about Australia other than it was an island somewhere in the Pacific, and that word ….. ISLAND equated to being small. They were quite literally astonished, and it was mentioned that perhaps most Americans thought the same as he did regarding the size relationship between our two Countries.
It doesn’t relate to this topic, but I’ll include the link to that Post and you can see that image at the top of the Post.
To this day, I still field questions asking if it is true.
Tony.
80
Americans are very ignorant of geography. It was a continual complaint by the National Geographic Society. In their school testing, most would fail to name any country in Africa between South Africa and Egypt.
That is not to say that America does not include some of the world’s most knowledgeable people and geographers but that the bulk of the people know little. I put that down to America being so big internally and so isolated and the lack of geography in schools but most importantly to the fact that we Australians are always outward looking and they are inward looking. I would suggest very few Americans have ever been South of the equator.
A T shirt I have from Vienna has a Kangaroo on it, with a cross through the Kangaroo. No Kangaroos in Austria! And it’s fact of history that Adolph Hitler was born in Australia.
And in my business life it was amazing when people thought I lived next to Germany. People who were openly amazed that my English was ‘very good’. In Russia, all they know is about Kangaroos. Introducing myself to a group of school children in St. Petersburg, they all started hopping about. It’s all the adults know too. I blame skippy.
Television is starting to change that but when I started travelling to the US, I knew very few friends or family who had been there. Amazingly it is now rare to find anyone who has not been to America. But I still know almost no Americans who have been to Australia. And those who arrive on a visit really complain about the length of the flight, because it was so unexpected to spend 16 hours in the air.
This is all understandable as only 2% of the world’s population live in the bottom 1/3rd of the planet. We have our own unique species. And good records.
Which is why the BOM homogenization is so important to world ‘temperature’ records. And obviously why they are retrospectively and outrageously altering the historical thermometer readings, the most basic scientific data apart from measurements with a ruler. We are part of the giant global warming scam. I believe it is more likely that Australia has cooled in the last century, but who wants to admit that? No more overseas junkets for the BOM.
111
Good suggestion Tony. Map added to the post.
50
Er, which Adolf Hitler was born in Australia?
10
Tony, I can vouch for that, having lived in the States 30 years ago: most of my friends & coworkers thought both Australia and New Zealand were tin-pot banana republic ‘tropical islands’ somewhere in the Pacific (which is halfway true). Personally I blame such films as Crocodile Dundee and Once Were Warriors for that geographical misunderstanding.
Having driven from Brisbane to Perth and New York to Los Angeles, as well as being an atlas fiend from a young age, it astounded me most ‘Americans’ could rattle off ALL the presidents’ names yet couldn’t point out Iraq on a map of the world (the war du jour at the time), God bless ’em.
70
Like the inadvertent admission of the New York Times
“His campaign is rooted”
” NEW: The New York Times editorial board endorses @JoeBiden for president: ”His campaign is rooted in steadiness, experience, compassion and decency” https://t.co/xaxUTONmhj
— New York Times Opinion (@nytopinion) October 6, 2020 ”
https://catallaxyfiles.com/2020/10/07/his-campaign-is-rooted/
80
An extra tick for funny, if I could.
21
And Tara Reade would like a word about his compassion and decency in regard to the days when she was asked to root for Joe as a member of his staff. The records of her written and submitted complaint about his behaviour are still locked up and only creepy Joe can release them.
He may find the climate changes very quickly if those records are released. But then Trump’s orders to release all records pertaining to the Russia scam and Clinton’s email server will drag down a lot of people who have hidden their role in the attempted coup. Then perhaps we can see some climate realism in Trump’s second term. Which would help science weak ditherers like Boris and Scott Morrison. Then the days of professional adjusted temperature records may be over and we can build cheap coal power stations and dams to save precious water. We cannot sell the thousands of useless windmills because, thanks to the RET, we Australians paid for them but we do not own them. Or has no one noticed?
91
“Surprising science – There’s no such thing as clean energy”
https://wattsupwiththat.com/2020/10/07/surprising-science-theres-no-such-thing-as-clean-energy/
40
Nice figures. 2018 world energy is 2% wind, 1% solar. And you have to wonder if these are name plate or real, so it could be much lower. This for the expense of at least over $US3Trillion in 7 years. Plus the damage done in so many ways, mainly ultra high electricity prices, blackouts and unpredictabilty. Everywhere that is except China which as the world’s second biggest economy is exempt and a climate victim receiving compensation and carbon cash. Which makes as much sense as UN sponsored Climate Science. And now the WHO is as much use as the IPCC and the Human Rights Council.
41
A couple of months ago, despite me having sent a number of emails regarding so called renewables, unreliable, intermittent energy sources and power stations by comparison to the local electorate Federal MP with not much more than acknowledgements of receipt, I emailed again explaining Nameplate/Installed and Capacity Factor, and how over 50 years of accountable working life for a power station, well maintained could exceed 80 years operating, wind turbines would need replacement at 20 years and 40 years to achieve 60 years and time for another replacement, plus “firming” equipment replacement.
At long last the message got through and I received a warm and friendly thank you.
70
I could see it coming……..
20
If Alice Springs readings can be “homogenised” from a reading in Cobar why can’t Cobars readings be altered by a thermometer in, say, Cairns and so on?
60
In ever decreasing circles until the data vanishes completely and we are just left with Man Made Global Warming and a hatred of carbon dioxide, the nastiest industrial pollutant in human history. Next to water that is.
71
H2O is the other dangerous industrial chemical produces by combustion of fossil fuel. And H2O needs to be recognize as deadly in large quantities, like say the Pacific Ocean.
Millions have died as a direct consequence of the dangerous chemical water. Drownings in Australia are nearly one person per 100,000 per annum. It’s still much lower than central America where deaths by drowning reach 16 people per 100,000.
So if we stop burning fossil fuels, more lives will be saved. It is only good luck that no one drowned in the cooling pond at the now dismantled Hazelwood coal power plant in Victoria but bottles of water should carry health warnings. People have also drowned from intentionally drinking too much water. Involved in more documented deaths by far than CO2. And a vastly more dangerous Greenhouse gas, responsible directly for all the typhoons, hurricanes, tornadoes, and killer monsoons and deluges and don’t get me started on killer floods and landslides and Tsunamis. Water, the silent killer. Industrial pollution.
81
Dihydrogen Monoxide! Dreadful stuff 😉
40
‘Cats ‘n dogs’ of it coming down atm.
40
It’s the Di-Hydride which is worse (as in OxyDiHydride.) Watch out for that.
10
We all know there’s only ONE criterium that is considered to select the “correlation site”: It absolutely MUST show warming, the more the better. Nature be damned.
41
Re: BoM’s temperature adjustments, AC/DC’s new song comes to mind, ‘A Shot in the Dark’.
50
For the record, as posted before a few times, the Minister for BoM received a detailed letter in 2013/14 complaining about the inaccurate BoM media releases that did not match historic record data and other information. The Minister apparently asked BoM management for an explanation and received an acknowledgement together with the poor excuse that “errors and omissions” were responsible and action would be taken to ensure it did not continue.
In Cabinet the Prime Minister Tony Abbott recommended after hearing the Minister’s report that due diligence, that an independent audit be conducted at the BoM. His recommendation was defeated by, apparently, a narrow majority of votes. It should be noted that in September 2015 Coalition PM Abbott was replaced by PM Turnbull (of the Turnbull Government) after “relentless negativity” directed at Opposition Leader Abbott from 2009 and PM Abbott from 2013.
As far as I am aware no attempt has been made since to conduct an audit.
60
An audit of the BOM, CSIRO, ABC and SBS would close most of it. In an internet world the ethnic service SBS has no known reason to exist and they are all in direct taxpayer funded competition with free enterprise, again for no known reason. A bit like the various Clean Energy and Air and funding Authorities established on the basis that CO2 is pollution even though 98% of all CO2 is sloshing around in the oceans not the air and the annual human contribution to the total is negligible, 2% of 2% or 0.04% and that higher CO2 is actually a very good thing as all life on earth needs CO2. And there is barely enough of it. At 0.02% life would cease to exist.
71
Perhaps a reason we are so afraid of the temperature going up is that the rainfall will go up, CO2 will go up and soon we will be facing Tyrannosaurus Rex and no longer be the world’s top predator. Apparently our ancestors at that time were a small marsupial but there must be an ancient DNA memory of being very afraid of higher CO2. And Rex.
21
Perhaps a reason we are so afraid of the temperature going up is that the rainfall will go up, CO2 will go up and the lush jungles return, the ones which gave us all the oil and coal and gas reserves. But soon we would be facing Tyrannosaurus Rex and no longer be the world’s top predator. Scary stuff. We would have to hide behind Triceratops.
Apparently our ancestors at that time were a small four legged marsupial but there must be an ancient DNA memory of being very afraid of higher CO2. And Rex.
31
On the horns of a trilemma it would seem.
60
Adjusting data is lying – pure and simple. Its why theories and models must be regarded as failures if they don’t match the data .
Science is getting like internet dating – everyone using false data to make themselves look good…..
80
For Lease
Modelling software adaptable to any far-left political agenda, garbage in, garbage out results guaranteed.
50
Stop fussing. It’s all in the same country. All you have to do is take the temperatures from each thermometer in the country, add them together, then divide by the number of thermometers. That will give you an Australian average.
It’s called science.
40
Or Climate Science. Something like that, anyway.
40
Hi RoHa,
So to get the right result stack the number of thermometers where it matters and place a few token thermometers here are there and do the ‘Average’ trick to get the right result!
That is how Branch Stacking works!
Lets do it for Temperature!
No one will ever notice, Right?
40
Ah, not the BoM Homologated Temperature but the Slithers’ Averaged Ambience.
The latter may well be better than the former so go for it.
20
This type of graph is at the core of the problem.
http://www.geoffstuff.com/BEST_correlation.jpg
http://www.geoffstuff.com/rohde.pdf
The criterion for matching different sites at various separations is the simple correlation coefficient, in this case between temperature sets from pairs of places.
Now, we all know that correlation coefficients can be very high when the 2 sets being compared are a simple, trending straight line. In simple terms, a temperatrure change of 1 deg C over a century, one that went in a neat straight line, would get a high coefficient like 1 if the other site was the same. But sites are not giving straight lines, they have hourly, daily, monthly, annual etc variation that gives finer character to the sets of data. These variations set part of the eventual correlation coefficient, with the other main part coming from the “straight line match” effect.
Bodies like the BOM and BEST seem not to have asked if the correlation coefficient is an appropriate metric. There seems to have been next to no study of why one pair of stations X km apart give a high coefficient, while a nearby pair the same distance X apart give a low correlation. The blunt methodology that is used simply says something like “Wow, we have correlation coefficients abouve 0.6 for many of the pairs in this graph, so we can use that good match to adjust values at separations up to 1,500 km.” Which they then proceed to do.
We need to investigate other ways to show if it is valid to use T values at one site to adjust the values at another. We have to avoid the straight line match problem. My problem is that I am not expert in correlation coefficient finer properties, so I have to ask for help. Mathematicians?
If you know ways to get over the above objections to correlation coefficients, boy, would I like to hear about alternatives. Geoff S
30
Geoff
IIRC wasn’t there one of “The Laws of Hansen” that distances out to 1200 km were ok for such purpose?
Your questions still likely stand though.
I recall a discussion on another “Hansen in Stone” value and its origin.
One reply was along the lines of “He needed that number so he worked backwards till he got it”
20
Antarctica is lacking a comprehensive instrumental historic temperature record.
Could the BoM generate one using their unique techniques? They could use data from Australian weather stations to do so, just like they did with Horn Island.
No weather station, no problem. Just fabricate the temperature record.
60
It is about 6300km from Melbourne to the nearest part of Antarctica. But there are closer Australian islands to the mainland that are located north of Antarctica and south of the mainland such as Heard and Macquarie Island.
BoM could first fabricate an instrumental record for them and then they can use those records to create instrumental records for Australian Antarctic bases such as Mawson, Casey, Davis etc.. Those records in turn could be used to create historic records for all the other bases in Antarctica such as the US base at the South Pole. I’m sure they’d appreciate historic data from before 1956 when it was established.
Being able to determine historic temperature records where none previously existed is a wonderful innovation and will help fill in gaps in the worldwide temperature records going back indefinitely in time and without geographic restriction.
Some distances here:
https://www.antarctica.gov.au/about-antarctica/geography-and-geology/geography/distances/
40
, Royal Commissions…BOM, CSIRO and “Our” ABC. Cannot come quick enough for this trio of trash
30
Why does Gobo Island need correction at all?
What are the sources of error?
It shouldn’t need *any* correction.
20
Perhaps it wasn’t showing the required warming?
10
There is a scientific process known as temperature homogenisation to necessary to isolate and remove measurement biases, from the real climate signal. But how does this isolation occur?
Venema et al 2012 states the issue more succinctly.
(Italics mine)
What is alledged here is that the Australian BOM has got rid of any pretence of procedure, using stations that are distant but have a “correct” climate signal. The fundamental reason for doing this, I believe, is a cultural one. “Climate Science” is the purest form of Post-Normal Science, based belief-mantras. The evidence is filtered through such mantras. The temperature data sets that most conforms to a belief-mantra like “the world is warming, it is serious, human-caused, and solvable” (Supran & Oreskes 2017) is the one that sets the standard for adjustments. Geography or standards are secondary.
I explored the homgenisation issue in detail over five years ago in the following post.
https://manicbeancounter.com/2015/06/27/defining-temperature-homogenisation/
30
There is a scientific process known as temperature homogenisation to necessary to isolate and remove measurement biases, from the real climate signal. But how does this isolation occur?
Venema et al 2012 states the issue more succinctly.
(Italics mine)
What is alledged here is that the Australian BOM has got rid of any pretence of procedure, using stations that are distant but have a “correct” climate signal. The fundamental reason for doing this, I believe, is a cultural one. “Climate Science” is the purest form of Post-Normal Science, based belief-mantras. The evidence is filtered through such mantras. The temperature data sets that most conforms to a belief-mantra like “the world is warming, it is serious, human-caused, and solvable” (Supran & Oreskes 2017) is the one that sets the standard for adjustments. Geography or standards are secondary.
I explored the homgenisation issue in detail over five years ago in the following post.
https://manicbeancounter.com/2015/06/27/defining-temperature-homogenisation/
[Kevin, this was caught by the spam filter. No reason given…..]ED
10