For most of this year 2016 was expected to break the 1998 record (which was the hottest year in the UAH satellite data set). But a sudden drop in Dec pulled the yearly average down so that statistically they are indistinguishable.
From one big El Nino year to another big El Nino, we’ve put out one third of all human emissions that have ever been put out since hunter gatherers wandered the steppes, but it appears to have made very little difference.
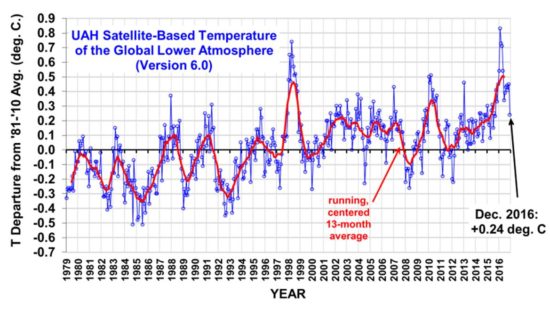
Thanks to Roy Spencer and global satellites: 2016 not Statistically Warmer than 1998
 The top five years in the 38 year satellite record
RANK YEAR deg.C.
01 2016 +0.50
02 1998 +0.48
03 2010 +0.34
04 2015 +0.26
05 2002 +0.22
Does it mean much? Not a heck of a lot. The pause was already long enough to show the models don’t work, and whether or not 2016 was another record is neither here nor there, except as a PR point.
The quest to kill the pause continues
Another new paper claiming (yet again) that there is really no pause shows how much the Global Worriers fear that message. As Anthony Watts points out, they left off 2016 data:
What’s missing? Error bars showing uncertainty. Plus, the data only goes to December 2015. They’ve missed an ENTIRE YEAR’s worth of data, and while doing so claim “the pause” is busted. It would be interesting to see that same graph done with current data through December 2016, where global SST has plummeted.
Here’s what I said about the Karl et al study that is still being claimed as a pause buster. We can see just how far believers have to go to remove the dreaded pausation:
To find global warming in the last 15 years, we need to ignore all that and use sea surface data blended from boats randomly trekking through shipping lanes with buckets and from ocean buoys (and that’s not ARGO buoys). But even that isn’t enough, that original data needs to be adjusted, and where sea ice gets in the way, gap-filled from sparse land data (as you would right?). Then we need to accept a lower-than-usual significance test, and carefully cherry pick the time periods to blend the past rapid warming with past cooling, so we can say we’ve found the holy grail, a quasi significant slight “warming trend” in data adjusted with a wildly uncertain correction estimate. And Professor Matthew England likes this kind of science.
And what a joke the adjustiments were in Karl et al:
Ross McKitrick points out that to get the new NOAA sea surface data they added 0.12 °C to the buoy readings, to make them more like the ship data. That magic number came from Kennedy et al. (2011) where the uncertainty was reported as (wait for it) 0.12 ± 1.7°C. (Which is like saying there is definitely one apple here, give or take 17 apples. So this is what 95% certainty looks like?).