The mystery of Australian temperature adjustments
Ken Stewart has been checking the Australian BOM official ACORN minima data against the raw data. This week he highlights the six very strange cases of Brisbane Airport, Amberley RAAF, Dubbo, Rutherglen, Rabbit Flat, and Carnarvon. In all these places the adjustments change the trend by more than 2 whole degrees C. It’s a kind of hyper-homogenization.
Thermometers are supposed to be accurate to a tenth of a degree. Australian average trends are sometimes calculated to one hundredth of a degree. What then do we make of adjustments that change the trends by a whopping 2 degrees, and decades after the data came in? The only thing we know for sure about Australian temperatures is that we need an independent audit. Why is it left to volunteers to check? Surely the Greens want good data too?
Some of these stations are isolated outposts, so theoretically they are the heavyweights on Australian area-weighted averages. The map scales can be a bit deceptive. In outback Australia the nearest neighbours can all be 500 km away (300 miles). Some dots on the map are not so much a town as a motel and a gas station. Sometimes one lonely thermometer gets the job of estimating temperatures across thousands of square kilometers. This applies to Rabbit Flat, and we’ll discuss that in a different post.
We’ve talked about the extraordinary case of Rutherglen before, where a cooling trend across a whole region becomes a homogenized warming one. And both I and Jennifer Marohasy have discussed the extreme oddness of Amberley.
But Carnarvon provides new material for playing Guess-why-this-got-homogenized? In the case of Carnarvon (see below) the raw trend shows an ever so slight warming over the last century, something like 0.2C, but the all-new adjusted “high-quality” ACORN trend is rising instead at around 2.2C per century.You might think Carnarvon was the aberrant outlier — a station that was different to the rest of the region so it’s been adjusted to fit. Except the original raw Carnarvon trend was virtually the same as the raw average of all its nearest neighbours (bar one). So all those must be flawed too? Well, the BOM didn’t think so, because the adjusted trends of neighbouring towns are only warming at a modest half a degree a century, while Carnarvon is ripping along at more than 2 degrees.
I’ve spoken to Ken Stewart, and he’s just baffled about all six stations. Perhaps there is a reason for these drastic adjustments. But without detailed and credible answers, how does a rational person have confidence in the current almighty ACORN set? There are too many mysteries (like, say, the hottest-ever day being in Albany, an obvious error that still hasn’t been detected by their “expert” peer review).

Carnarvon (Western Australia) has ACORN neighbours: Learmonth (298km), Wittenoom (560km) , Meekatharra (524km), Geraldton (447km), and Morawa (538km). The only non-Acorn site with continuous data for the early part of last century is Hamelin Pool 6025 (174km away).
Ken Stewart’s conclusion: –
The Acorn adjustment algorithm creates homogenised data by comparing with up to 10 neighbouring sites. I have shown that the adjustments have made the Acorn trends greater than, not only the raw data trends for each site, not only the raw data trends of the closest neighbours in the Acorn dataset, but in every case but one, greater even than the trends of Acorn homogenised data from the same neighbouring locations. The adjustments created thus appear to be spurious and the algorithm faulty.
Carnarvon adjustments don’t make sense

….Fig. 6a: Raw vs Acorn
The Carnarvon raw trend is not rising as fast as the average of all the neighbours (three of which are 500 km away).
But this trend of the neighbouring stations is heavily influenced by just one station – Morowa.
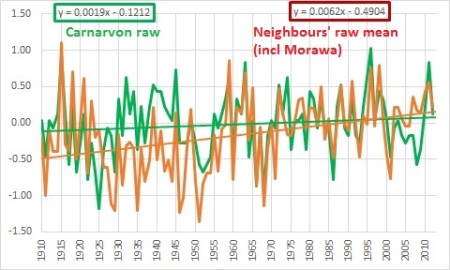
Fig. 6b: Carnarvon and mean of neighbours (raw).
When Morowa is removed we can see just how similar the raw trend in Carnarvon is to most of the stations all around it.

Fig. 6c: Carnarvon raw vs neighbours’ mean excluding Morawa
The BOM adjusted Carnarvon (black line) and now the temperatures there rise a lot faster than the neighbours.

Fig.6d: Carnarvon Acorn vs neighbours mean (raw) (including Morawa)
But the neighbouring stations did not get adjusted much — their ACORN record resembles their raw records.

Fig. 6e: Carnarvon Acorn vs neighbours’ mean (Acorn)
To see all six sites, visit Kens Kingdom. Leave a comment there or here to let Ken know how much you appreciate the time it takes to put all this data together. He’s gone through all 104 ACORN stations, he’s figured out which sites show what trends, and checked the towns that are neighboring. It’s a lot of work to get to the bottom of this, and there are no government grants for auditing government temperature data…


The critical adjustment (some 2 degrees) is made over the period 1925/1931. Surely BOM must have given a justification for such a huge adjustment. Or am I too naive to think so?
261
[SNIP! – Absolutely not. – Jo]
114
They are fully exploiting the predictive power of fruitful politicized national science?
Ref: http://www.mdpi.com/2076-0787/3/3/299/pdf
51
They are the progressive (politicized) Enlightenment liberalism?
41
Correct. You’re too naive.
The adjustments are to daily data. These graphs show annual data as supplied by BOM. The major adjustments were 1974 (-0.5), 1945 (-0.5), 1931 (-0.5), and 1917 (-0.3), approximately. There were numerous others as well, up and down. 1910 is thus 1.8 degrees cooler than raw data shows.
211
The Rutherglen acting as homogenization point makes no sense – Albury Airport & Hume Weir are both air weather stations and will reflect different temps accordingly,. I recall once seeing adifference in temp between Albury Airport and the Hume Weir of at least 1C due to the proximity to the water of the hume weir. Likewise, Rutherglen is a rural area – so why use other stations *unless* you wnated to hide its data…..?
41
Carnarvon is on the coast. According to the figure just two of its neighbours are likewise on the coast, the other three are well inland. Further, a quick look at Google maps shows that Morawa is near a series of pools of water that presumably exist when Lake Nullewa sends some water along the creek, in other words Morawa is lmost in a flood plain. If there is water the sun’s heat will be used to evaporate teh water and make less contrbution to raising ground surface temperature. If there’s no water then the sun’s heat will alll go into raising the ground temperature. In a wet season, let alone a wet year, Morawa will record a different temperature than what it would in a dry season.
Using Morawa as a comparison site is simply foolish.
51
Using Morawa as a comparison site is simply foolish
JohnM with it comes an anomaly,and with an anomaly comes a loophole,Bureaucrats love loopholes,their very existence relies on them.
31
That is (the 2 degrees), if one compares Carnarvon Acorn with its neighbors.
41
As a one-time colleague would have said, there is a rabbit away here – time to flatten it!
41
I would have given Greens the benefit of the doubt until maybe a year ago. But there are too many instances of statistics abuse, and the dogmatic rejection of any questioning of that abuse, to continue doing so.
Any auditor, like Ken Stewart, would naturally check first the most isolated thermometers. That is why on a global surface temperature an audit would focus on estimates for the oceans and in the remote land areas. Globally the position might be the same as the BOM Australia data, as the greatest warming appears to be in Siberia and the fringes of the Arctic Ocean.
There is strong evidence that the surface temperature data is used to tell a story, rather than to reveal the truth. For instance, three years ago the NASA GISTEMP figures showed no leveling-off in the temperature trend post 1998, in clear contradiction to HADCRUT and the satellites. The current data set is now in line with HADCRUT for the period 1998-2010, along with other anomalies.
231
One of the main problems I encounter is that people cant comprehend “trusted” sources ( i.e. 4 letter “trusted” agencies ) lying to them.
Unless you can get them to understand these sources role they play in the whole scam, you cant get people to sit and contemplate the voilation of trust that has occurred.
“Someone should tell Adolf….”
91
No, the Greens just have an obsessive hatred of fossil fuels – and the West, and America, and free speech, and democracy, and so on. They will say and do anything, and propose any absurd unworkable alternative you can name, just to vent their obsessive hatred for coal and oil.
But there is only one question that needs to be asked here: why is the Abbott government doing nothing about this?
121
This is a mystery to go with:
Why didn’t Malcolm Fraser repeal the welfareism that the madman Whitlam inflicted upon us that has now grown so big that it is destroying our economy?
Why didn’t Howard take action to get rid of the thousands of bureaucrats in Canberra sucking the life out of the state health, education systems when these functions are clearly not listed in the constitution as functions that the Commonwealth has any power to legislate in. These departments have about 10,000 employees between them in Canberra but do not operate a single hospital or school and do not employ a single nurse doctor or teacher?
Why didn’t Howard repeal section 18c and illiberal sections of acts like the racial discrimination act after the Liberal National Coalition argued strongly against it and voted against it when Labor brought it in?
Why do all of these so called Liberal Governments who continuously state that they believe in small government and low taxes also expand government and raise taxes as soon as they get into government?
Why didn’t Howard get rid of the Human Rights Commission and many other of these far leftist bodies set up deliberately to white ant out society and our culture?
Why doesn’t Abbott get rid of these same undemocratic and unelected bodies? There are many more examples of this stupidity and when you can answer these questions you will understand why nothing is done about the corruption within CSIRO and the BOM.
83
CameronH,
These are excellent questions that need to be answered.
The reason is that power will always accumulate power. The trend to collectivism and centralisation is inevitable and needs a conscious effort to thwart, remove and break up existing power structures and distribute the power as widely as possible.
21
It all comes back to O’Sullivan’s Law which states: “All organizations that are not actually right-wing will over time become left-wing.” This, I believe is why you see such obvious leftists such as Malcolm Turnbull in the Liberal Party and he is not the only one. From my point of view both major parties are drifting to the left. The ALP is probably now more far left with the LNP center left.
11
“Surely the Greens want good data too?”
Nope … they’re aren’t interested in data which disproves their CAGW mantra … they are after all students of the Saul Alinsky Rules for Radical class which requires ‘the end justifies the means’. So lying, cheating, manipulating are ok with them as long as it paints humans as being nasty destroyers of the planet who need to be controlled and corralled in ghettos aka Agenda21.
91
… Surely the Greens want good data too? …
Maybe nail-down a definition of ‘good’ in the context of data and see if what one thinks it would mean, falls within cooee of that. And expect a yawning chasm full of artful dodging.
121
I suggest you try borehole thermometry to investigate temperature changes over time. You will need to drill shallow wells and measure temperature versus depth. Inquire with experts in the field, I’m sure they can help.
11
http://home.badc.rl.ac.uk/mjuckes/mitrie_files/docs/mitrie_borehole.pdf
This is a link to a publication about borehole thermometers. However, I think this field has much more potential and can be refined to identify temperature trends in areas where there’s none or iffy data.
01
Fernando,
As one who approved the drilling of many, many boreholes in his career, and watched many in progress, I can say that I would not use this method of temperature reconstruction in a fit.
The math is ill posed.
The assumptions are enormous, unverified and some are unverifiable.
Please do not treat it seriously.
50
I’ve gone into detail on the boreholes data and papers: http://joannenova.com.au/2012/11/the-message-from-boreholes/
The boreholes are useful to show that broad millenial temperature changes were global rather than local, but the resolution is dismal, and as Geoff says, the assumptions make all the difference. We don’t know the timing, nor the exact degrees. The many contradictory graphs by the same authors in different papers says quite a lot. But it does appear that there was a general cooling sometime in the last half millenia, and a generally warm period before that.
There is a dearth of Australian proxy studies, as I keep saying. For resolution on the 200 year scale you would think Australia might have enough clam shells, stalagmites, lake sediments, or coral etc…
81
Add to this Steve Goddards latest revelation. http://stevengoddard.wordpress.com/2014/07/20/something-seriously-wrong-at-ushcn/
Temperature data was manipulated to justify TOBS
121
Two of the most important laws of the Climate Change Cult are:
1. Thou shalt manipulate the data for the faithful, heretic be he who uses the original data.
2.Thou shalt not be found out.
The breaking of these two laws has now become commonplace.
141
Commented at Ken’s site.
“Ken, great work, I know how long it takes looking at the raw data, I have been looking at some in the USA.
You could really do with talking to Steve Goddard at
http://stevengoddard.wordpress.com/
as he has ben finding almost identical “Quality Control” adjustments of the US temperature data.
For instance see this
http://stevengoddard.wordpress.com/2014/07/20/something-seriously-wrong-at-ushcn/“
121
Thanks! Will check.
60
Do we need any more evidence that the BOM data needs to be independently audited?
181
Evidence does not matter, only models.
41
They must have got the algorithm from GISS.
51
The “homogenisation” algorithm is certainly a shared resource.
iirc, it originated from a collaboration between Giss and HadCrut, then migrated to BOM. (might be wrong, though)
There is some indication that maybe NCDC was also involved at some stage.
I think I saw somewhere that NCDC was the first to start “adjusting” the 1940’s peak (after suggestions from Wigley at CRU)
31
GISS interpretation of Carnarvon’s temp data.
Exhibit A – raw data (v1)
http://data.giss.nasa.gov/cgi-bin/gistemp/show_station.cgi?id=501943000004&dt=1&ds=1
Exhibit B – adjusted data (v4)
http://data.giss.nasa.gov/cgi-bin/gistemp/show_station.cgi?id=501943000000&dt=1&ds=14
11
Notice that Giss daren’t show the pre-1950’s temps and what they would have done to them. 🙂
Fortunately Ken still has the real data. 🙂
31
I hope others have this original data too.
As a scientist I’m gobsmacked that they have been able to get away with it. As a retired person reading outside my area of expertise I can’t be bothered with the attempt to fight it.
51
Acorn’s algorithm is claimed to be a world first best practice algorithm called Percentile Matching. Read all about it at the Acorn site at http://cawcr.gov.au/publications/technicalreports/CTR_049.pdf pp. 49 ff. So home grown. Doesn’t it make you feel proud?
130
Ken,
Have you had a look at Melbourne yet? Does the Melbourne record show a trend or adjustments?
11
I think you will find that Melbourne and some other cities have actually had a warming trend flattened a bit.
http://kenskingdom.wordpress.com/2010/09/14/the-australian-temperature-record-part-9-an-urban-myth/
I assume that this is so they can say that the UHI effect is not very strong in major cities.
note: that link is from 2010, Ken may have some updates.
81
Melbourne’s minima have been cooled by -0.81C per 100 years. Melbourne is one of 8 locations not used in climate analysis because of Urban Heat Island effect.
91
Peter C,
I’ve done an analysis of Melbourne Regional 86071 versus Melbourne suburban stations over the past few years.
86071 stands out as having a differnt shape to the suburbs, as if someone was playing with the calibration knobs on the instruments.
I’d post it here except my Web Host has gone belly up and I have not found a replacement yet.
Happy to send you or anyone the data and graphs. Email me – sherro1 at optusnet dot com dot au
81
There certainly appeared to be a strong UHI profile evident in this work done by Uni of Melb some years back. The result is based on 1985 to 1994 data, presumably unadjusted.
One wonders what kind of hijinks the BOM has in store when they make the transition from the old Melbourne Regional Office station to the new Melbourne Olympic Park station?
31
That is amazing Bob in Castlemaine.
The Melbourne CBD temperature station is in a classic location for Urban Heat Island Effects. It is shielded these days from the prevailing COLD south westerly winds by tall office buildings, but is exposed to HOT northerly winds coming across the park around the Exhibition buildings. It is also exposed to high levels of road traffic only a few metres away.
The analysis you refer to seems to indicate an Urban Heat Island Effect of about 2 degrees!
How come no one has told Prof David karoly who works in the very self same Melbourne University!
21
how else do you expect the temperature trend to keep up with the output of the gcm,s . screw the natural system, if it will not warm,we can make it (on paper and pretty graphs at least) warm 😉
61
If you watch the SG site, you will pretty soon come to the realisation that the so-called warming in the latter half of last century…
… is ALMOST TOTALLY down to “adjustments” in the temperature record.
In many places in the USA, the “adjustments” are more than 100% of the trend.
Same applies to Australia..
No wonder ever a modestly average summer becomes “the hottest ever” !!
*The problem with this is that David has used Hadcrut (or was it Giss) data in his model, so I’m not at all sure where that leaves the solar-lag theory. 😕
If all the s0-called warming is totally down to adjustments, then it may discount solar as a major driver….. hmmm….. time will tell, I guess.
132
And like the Australian data shown here, the adjustment pivot point is around the late 1980s and early 1990s.
Strange that, it’s like they’re all singing from the same songbook.
51
Via this washington post carbon(sic) tax article with the claim:
“There’s some potency to the issue of climate change in Australia, which has seen longer, more pronounced droughts in recent years that scientists have linked to climate change.”
For evidence, the link is to the ABC report titled, “Australian heatwaves more frequent, hotter and longer: Climate Council report.”
And, this BoM External Link: Interactive animation shows temperatures around Australia over the past week
. . . .
Oh dear.
Can anyone see frequent, hotter heat waves in the last week?
Having established that consensus science says weather IS now climate, and, the WMO claiming heat waves are now proof of GLOBAL WARMING …
Again, here is the failed BoM National temperature outlook for July to September
Issued 25 June 2014
. . .
How much more incorrect can ‘the experts” be?
91
Sterling work by Ken, Chris and Jo. It is past time for a response from Blair Trewin and David Jones.
61
The people who designed this algorithm provided ‘independent expert advice’ to the government and courts in New Zealand when citizens were chasing down similar problems.
51
Steve Goddard over at Real Science has found that US land temperature records have been systematically adjusted to create an artificial warming trend that does not exist.
I am sure that this is a world-wide phenomenon …
91
Indeed Frank Lansner has looked at the Global Raw Data as we discussed here:
“Messages from the global raw rural data. Warnings, gotcha’s and tree ring divergence explained!
Franks work really deserves more attention.
90
This looks more and more, that most of the warming that there’s been in the last Century, is due to a computer algorithm, and a faulty one at that. Good find Ken et al.
140
I used to think that homogenized was something the dairy did to the milk so the cream wouldn’t rise to the top. It was done by some sort of machine and those machines were around long before all but a very few were even thinking about computing machines.
Now it’s computer intensive homogenized data but what rises to the top is always the highest temperature they can squeeze out of it — quite a feat without a doubt.
I wonder how much better they could do if they were more interested in honesty than higher temperatures. 🙁
70
It be warm up here,
where the cloud are soft,
and the sky shine sunny blue.
Where thoughts are straight,
with a theory great,
and what you believe are true.
And yea verrily,
up here be the warmist.
He of the model and the fiddled figures.
Stalwart, bellicose, keeper of the faith,
ruler of the universe and sundry other provinces.
His be the world of imagined imaginings,
of the event yet to occur.
But he are strong,
for he have the media.
And low, but down,
if not further,
be standing the skeptic.
Protector of the CO2.
Diligent, enquiring.
He question “The Truth”.
His be the world of the record unadjusted,
of the evidence unmolested.
of rational thought and data
Wherein there lay the quest to reveal.
Strong and getting stronger,
he rides the stage at Nova station.
30
When can we expect BOM’s response? Surely they can’t ignore these claims?
50
The first map (showing station neighbours) immediately sets off alarm bells for me.
I’ve lived in many towns up the East coast of Australia. There is an obvious thermal gradient from the ocean to the Great Dividing Range, another thermal gradient along the range, and a different gradient from the range to the inner desert area of Australia.
If these stations are simply graded with their neighbours in all directions, the results are wrong. No ifs or buts about it. You have to calculate equivalent land temperatures “along” the thermal gradient, not randomly in any direction.
The one at Carnarvon is so wrong it’s scary. And any station along in front of the range cannot be compared to a station on top of the range, or similar inland from the range.
God, it’s not that hard, honestly.
110
Greg, “Rutherglen
Neighbours are: Deniliquin, Wagga Wagga, Sale, Kerang, Cabramurra”
Rutherglen is an inland low lying town in Northern Victoria. Cabramurra is the highest permanently inhabited town on the Australian continent, situated at 1,488m AHD in the western Snowy Mountains of the Great Dividing Range, in the state of New South Wales.
Sale is a coastal town in Sth’n. Vic.
You would be hard pressed to find three towns with less similar climates. How on earth any one of these could be a proxy for the others defies imagination.
50
See my reply at kenskingdom
00
still singing the same song:
21 July: SMH: Peter Hannam: Climate models on the mark, Australian-led research finds
A common refrain by climate sceptics that surface temperatures have not warmed over the past 17 years, implying climate models predicting otherwise are unreliable, has been refuted by new research led by James Risbey, a senior CSIRO researcher…
The Bureau of Meteorology last week maintained its estimate of a 70 per cent chance of an El Nino this year. It noted, though, that warming sea-surface temperatures in the central and eastern Pacific had yet to trigger the constant reinforcing atmospheric patterns such as a stalling or reversal in the easterly trade winds…
http://www.smh.com.au/environment/climate-change/climate-models-on-the-mark-australianled-research-finds-20140720-zuuoe.html
51
Ahh, the all purpose forcing called “natural variability”, which is their way of saying, we got it wrong and we don’t even know why.
The Earth is heated and cooled by mysterious Natural Cycles, it’s a new force of nature.
Curiously, despite these 30 year cycles being so obvious 30 years in advance, the models didn’t predict what happened.
161
There is a curious history regarding timing of discovery of these 30 year cycles which I will mention.
Apparently the PDO ~30 year cycle was only discovered in the mid 1990s, straight AFTER Mann and others had been discovering and working on the AMO in the early 1990s, as well as formulating and preparing their hockeystick work and concurrently dismissing the AMO as affecting late 20th century warming. This work of Mann and others of the early 1990s, was what was spurring the 1995 IPCC report, which was changed to reflect the view within certain parts of academia that natural variation including the AMO, was not causing the warming. This view was formed before the PDO, which is more dominant than the AMO, was actually discovered.
The main players involved with Mann’s 1998 hockeystick and the various IPCC reports, particularly the 1995 IPCC report, NEVER integrated the ~30 year PDO, because they were not involved in its discovery and implications. It was also a case of bad timing, the PDO was discovered AFTER they had already written about and decided to right off the AMO, and on this basis as well as the evidence in the North Atlantic, to dismiss such things as local variations that do not affect regional world temperatures such as the LIA and late 20th century warming.
The climate models are still not infused with ~30 year PDO affects, because ownership and a precedent has set in to leave it out, like the QWERTY keyboard.
40
Keep up Pat,
Go read Bob Tisdale’s response to Risbey at Whats up with that
Right here
51
Here is Tisdale’s key animation.
See if you can spot the differences between the “4 Best models” and the real observed data
link here
31
read all from a pessimistic Shukman:
20 July: BBC: David Shukman: Shuttle diplomacy in climate countdown
A senior British minister is once again launched on a long-haul high-carbon mission of shuttle diplomacy in the cause of tackling climate change.
The target is to try to land an international deal on limiting greenhouse gases at what is billed as a major summit in Paris in late 2015…
Buoyed by a trip a fortnight ago to Washington – where President Obama recently announced his plan to limit emissions for power stations – Ed Davey, the Energy and Climate Change Secretary, arrives in China on Monday for his second major visit there and he will then fly on to India…
Mr Davey was not in the job at the time of the chaotic scenes in Copenhagen in December 2009 so he does not carry the wounds of that event and, to someone who was there, he sounds surprisingly upbeat.
So, I ask, is he genuinely optimistic that something might come out of all this?
“I’m more optimistic than I thought I’d be,” he says.
“I think there’s a desire in many capitals to do a deal – there’s been a real shift.
“People are now thinking about what’ll be in a deal not ‘will there be a deal?'”
Given the US Senate has never been supportive of a climate treaty and that China and India have long argued that too many of their people are living in poverty to contemplate any action on emissions, how does the minister come to this view? …
Mr Davey is also heartened by new figures on China’s use of coal. Instead of rising by 10% a year, coal use is now only increasing by 5%.
That does not mean less coal is being burned, only that the year-on-year growth in coal use has become smaller.
***This counts as success in the often strange world of climate diplomacy, where the smallest straws in the wind can acquire huge significance…
http://www.bbc.co.uk/news/science-environment-28375267
41
The old “If you can’t dazzle them with brilliance,baffle them with bs” climate model is not working apparently, <:o)
51
I cant believe someone hasn’t asked this question before, but I’ll be the sucker that asks it here.
If a temperature station requires two degrees of homogenization to get it right, in what sense can it be regarded as a “high-quality station”?
If they are supposed to be accurate to tenths of a degree, why do they need adjusting by two degrees?
If a “high-quality” site needs adjusting by two degrees to make it right relative to the surrounding stations, could it possible that the other “high-quality” stations need two degrees of adjustment too? and in what direction?
Is this post-normal science?
It suggests to me that this is an admission that the error bar of the “high-quality” stations is at least two degrees per century, and all this hundredths of a degree business is pure nonsene.
131
Precisely. Yet BOM uses data from the “less than high quality” sites to homogenise the “high quality” sites. I’ve looked at a heck of a lot of Australian surface temperature data and I wouldn’t trust any of it- raw or homogenised.
91
The error margin over 2 centuries is probably +- .5C (my guesstimate).
Regardless, I cannot see the logic in adjusting past recordings.
31
You are so right.
Why does high quality data need to be adjusted by 2 degrees to make it right, and what makes them think that this number is now “right”?
Yes, 2 degrees is the new margin of error in my opinion.
81
Last year was supposed to be the hottest year on record and for this year to surpass that record they will need to drastically introduce some creative book-keeping.
But what disturbs me the most isn’t the fact that this practise is going on but that our elected leaders are permitting it to happen.
Or is this all a matter of the symptomatic problem of our nation that our politicians know that all govt figures/stats are distorted and they permit it because in the future they will NEED to alter them as well?
71
Brisbane is a classic case of problems with homogenising data.
I grant that the earth has warmed over the last century (mostly natural), which means shifting latitudinal zones, meaning the subtropical climate north of Brisbane has shifted south.
But this DOESN’T necessarily mean temperatures will increase in Brisbane, because of the effect of increases in water vapour in the subtropics, which dampens temperatures. (This is why the tropics are not hotter than deserts
Brisbane sits very close to the warm temperate, subtropical zone, convergence; I would look at humidity levels and subtropical trade winds and see whether they have changed. The East Coast current might also be effected by a warmer earth and shifting latitudinal zones, as a warmer world might weaken this current which requires differential gradient across large areas of ocean; a weaker current might dampen temperatures, as the current has a warming effect. Rainfall is unreliable as an indicator of shifting latitudinal zones, as the effect of rainfall associated with east coast lows (which require cooler water to form) wouldn’t necessarily mean it would get wetter with shifting warmer latitudinal zones towards the south.
So Brisbane might not get warmer, even if the earth warmed and the subtropics shifted south, due to dampening effects on temperatures associated with water vapour, the Easts Coast current, and trade winds. But inland it might, so homogenising with inland sites ignores this, and you can see the problem.
31
The ocean is a big heat sink.
Compare Yepoon, Rockhampton and Blackbutt to see what I mean.
31
I wouldn’t say no to that subtropical zone moving further south to Melbourne,no more 45C temps in Summer and ffffreeezing winters.
41
Yes please; then maybe the Victorians will stay home for summer 🙂
51
Ooh that was cruel,if I had any feelings they would be hurt,but at the moment it is freezing and I am numb from the cold.
11
I’d be off to Noosa right now if we hadn’t too much to do atm here in freezing Victoria. There was a goodly frost this morning and my feet are like blocks of ice.
01
A new study has found there is more heat escaping to space at the top of the atmosphere. This is the opposite to the greenhouse effect that alarmist scientists have berated us with for decades.
http://hockeyschtick.blogspot.com.au/2014/07/new-paper-unexpectedly-finds-diverging.html
41
A C of Adelaide –
i’ve been reading Tisdale, but it amazes me how our MSM still doesn’t feel obliged to show the slightest scepticism towards alarmist claims. and not only our MSM, unfortunately:
20 July: NPR: As Polar Icebox Shrinks, Infectious Pathogens Move North
Science writer Chris Solomon tells NPR’s Arun Rath that global warming has caused an influx of new diseases in animals that could eventually spread to humans…
SOLOMON: There is something called phocine distemper virus, and it’s a relative of canine distemper. Phocine distemper has killed 50,000 seals over the last 25 years in the North Atlantic. And as scientists were trying to figure out why sea otters splashing in the Aleutian Islands were not doing so well, they found evidence of phocine distemper in them, and it became a detective story.
And they said, well, what’s it doing in the North Pacific? And their theory is that it has made its way through the fabled Northwest passage via a seal or its feces and met animals on the other side due to the dramatic level of sea ice reduction…
SOLOMON: Yes. In essence, disease is finding new lanes of travel. Existing disease up there is becoming invigorated. And new disease is hitchhiking on all sorts of wildlife, whether it’s fish or wild boars or ticks that are moving north in search of new habitat that’s cooler.
RATH: Wow. And in terms of land animals, I know with your article there is a photo of a big herd of very serious looking musk oxen. And they’ve been affected as well?
SOLOMON: Yeah. So this is another interesting case. Musk oxen – people may be able to visualize from a Disney or Pixar movie – they’re those smelly, kind of shaggy, horned relics of the Ice Age. And they’ve, for eons, had his relationship with this parasitical lung worm. It gave them a bit of a smoker’s cough.
But the lung worm was always kept in check because it never was able to thrive in the brutal Arctic environment too well. And now, with essentially longer, warmer summers, the lung worm can complete its life cycle in one summer instead of two. And it has proliferated and has expanded it’s range up to where 30 percent of the world population of musk oxen live. And this is not good for the declining number of musk oxen in the far north…
RATH: Christopher Solomon’s article “Sick In The Arctic” appears in the August issue of “Scientific American.”
COMMENT by a Phil Jones:
Another daily dose of NPR advocacy and fear-mongering.
http://www.npr.org/2014/07/20/333173754/as-polar-icebox-shrinks-infectious-pathogens-move-north
41
Hi Pat
I was probably a bit short with you and sounded like a criticism but was a bit over excited by Tisdale’s blink chart and in a hurry
Cheers
A C
01
i don’t agree with everything he says in here, but some good stuff nonetheless. Paterson is due to speak to
20 July: UK Telegraph: Owen Paterson: I’m proud of standing up to the green lobby
(Owen Paterson is a former secretary of state for environment, food and rural affairs)
Every prime minister has the right to choose his team to take Britain into the general election and I am confident that my able successor at Defra, Liz Truss, will do an excellent job. It has been a privilege to take on the challenges of the rural economy and environment. However, I leave the post with great misgivings about the power and irresponsibility of – to coin a phrase – the Green Blob.
By this I mean the mutually supportive network of environmental pressure groups, renewable energy companies and some public officials who keep each other well supplied with lavish funds, scare stories and green tape. This tangled triangle of unelected busybodies claims to have the interests of the planet and the countryside at heart, but it is increasingly clear that it is focusing on the wrong issues and doing real harm while profiting handsomely…
I soon realised that the greens and their industrial and bureaucratic allies are used to getting things their own way. I received more death threats in a few months at Defra than I ever did as secretary of state for Northern Ireland. My home address was circulated worldwide with an incitement to trash it; I was burnt in effigy by Greenpeace as I was recovering from an operation to save my eyesight. But I did not set out to be popular with lobbyists and I never forgot that they were not the people I was elected to serve.
Indeed, I am proud that my departure was greeted with such gloating by spokespeople for the Green Party and Friends of the Earth…
The Green Blob sprouts especially vigorously in Brussels. The European Commission website reveals that a staggering 150 million euros (£119 million) was paid to the top nine green NGOs from 2007-13…
Like the nationalised industries and obstructive trade unions of the 1970s, the Green Blob has become a powerful self-serving caucus; it is the job of the elected politician to stand up to them. We must have the courage to tackle it head on, as Tony Abbott in Australia and Stephen Harper in Canada have done, or the economy and the environment will both continue to suffer.
http://www.telegraph.co.uk/news/politics/10978678/Owen-Paterson-Im-proud-of-standing-up-to-the-green-lobby.html
20 July: Breitbart: James Delingpole: UK Government Minister: I Had More Death Threats From The Greens Than IRA Terrorists
Since his departure it has been announced that Paterson will deliver the prestigious Annual Global Warming Policy Foundation (GWPF) Lecture in October…
http://www.breitbart.com/Breitbart-London/2014/07/20/UK-government-minister-I-had-more-death-threats-from-the-greens-than-IRA-terrorists
31
the “For Now” in the headline doesn’t show up in the google results. i thought wow, a positive CAGW story on NatGeo! how wrong could i be?
19 July: National Geographic: Stefan Sirucek: Global Warming Boosting Reindeer on Norwegian Island—For Now
On the remote Norwegian archipelago of Svalbard (map), reindeer are bucking the trend followed by other animals affected by global warming: The population of reindeer is growing—even thriving—according to new research…
In the Arctic, including Svalbard, there’s been a well-documented increase in temperature over the past 20 years—and the main effect on the reindeer appears to be that their populations are increasing, said Jonathan Codd of the U.K.’s University of Manchester, whose team assisted in the annual reindeer census.
The largest recorded population increase yet—a striking 30 percent—occurred in 2014, with 1,300 reindeer recorded in Adventdalen…
While it’s difficult to rule out other factors that could account for the growth, Codd said that climatic changes can definitely influence animal populations. (See “Ten U.S. Species Feeling Global Warming’s Heat.”)…
While Svalbard’s reindeer population is growing, milder winters could also hurt reindeer populations in several ways, noted Perry Barboza, a biologist at the University of Alaska, Fairbanks, who was not involved in the study.
For example, milder temperatures actually lead to heavier snowfalls, since warmer air can hold more moisture. Deeper snow can make it difficult for animals to access food. (See “Mysterious ‘Rain on Snow’ Events Tracked in Arctic.”)…
http://newswatch.nationalgeographic.com/2014/07/19/animals-science-global-warming-climate-change-svalbard-norway/
11
Please be patient. We are only able to determine what the past should have been for a few places at a time. Soon all the past will be properly aligned with the new improved truth.
. Your eternally truthful government
41
Say look, I want you all to forgive me of my amateurism on this point, but something has always bothered me a little here.
I’m not going to quote actual figures here for actual places, but just some ballpark figures.
Let’s go back a lot of years, when this weather forecasting business was in its infancy, and here I’ll just take for example when our family moved here to Queensland, back in 1960, now 54 years back.
Mum and Dad liked us to have some sort of grasp on what was happening around us, so they would get us to watch the news each night, even though I was the eldest at only 10. I would always like to watch the weather report, no real big thing there, but it was always a kewl thing to hear the neat place names for Queensland, being relatively new to us, and I would often have a playful little kids bet for nothing on which of the towns here in Queensland would have the maximum temperature, because the place names were always strange sounding, and there was usually only 4 of them to choose from, Thargomindah, Urandangie, Longreach, Cloncurry with occasionally Mount Isa in there as well. The coldest spot was nearly always no contest as that was nearly always Stanthorpe.
So, here we had 4 places, in a somewhat pretty vast area. Nowadays, when you watch the weather, they show the temperatures for anything up to 42 towns and cities (on the nightly ABC) weather report here in Queensland, and while the State minimum is still usually Stanthorpe, the daily maximum can be in any number of places, and it would be almost impossible to guess where these days.
So, in those early days there was just the 4, and now there could be any number.
Now to the little (amateurish on my part) exercise.
Say (back in 1960) we have three places where the daily Maximums are 31, 33 and 35. Just those three in and around a relative area. Now, let’s do what is so commonplace today, to quote the average, and that comes in at 33.
Now, scroll forwards to 2014, and instead of just three places in that same area we are taking the temperatures for, say, 10 of them. Those temperatures are still around a similar vein, with now probably one of them a little higher, by just the one degree. We now have this. Ten towns with temperatures of 33, 35, 34, 31, 36, 35, 32, 35, 33, and 35.
The average is now 33.9, almost one full degree warmer.
Can you see the point here?
Even though the daily maximums are still relatively similar across that similar area, we are now recording in more places than before, and the average has risen.
Do that often enough in (what is now) a plethora of places, and the average maximum temperature will rise.
I know that the same applies with the minimum temperatures, but the MAJOR concentration is on hotter temperatures.
I await to be flamed mercilessly for this, but I told you I was only an amateur.
Tony.
81
Amateur answer to an amateur question… Tony that’s not how they would determine the average temps. And anyway even if it was it’s just as likely you’d end up with a colder average than a warmer one.
110
“And anyway even if it was it’s just as likely you’d end up with a colder average than a warmer one”
Depends how they infill the data. 😉
42
Matty B
“They”,
as in BOM would:
1. Take at least a degree or two off pre 1990 temperatures
2. Add at least a degree or two onto post 1990 temperatures
And you convert that simple No Temperature Change raw Data
into this
41
Hi Tony
All else being equal, having more long term sites recording temperatures will give a better idea of average temperature (and trends)and will not affect temperature trends very much. This is because anomalies are used for comparison of sites in different locations. However, all else is rarely equal. Reasonable quality, long term data records with few gaps in remote locations are very hard to find, so comparisons can’t be made.
TV weather is mostly about news rather than information, though the new synoptic charts showing wind strengths are pretty good.
31
Thanks Ken.
It always puzzled me, and back in the late 60’s, an old Air Force Instructor once told me, “there’s no such thing as a stupid question. Never be afraid to ask.”
Tony.
30
Tony,
I used to believe that about stupid questions until I started listening to MSM churnalists …
00
I would be very surprised in the ACORN algorithms used to “adjust. homogenise, infill, zombie [ BOM zombie maybe? ] and etc the Australian temperatures differed very much to the USA’s NCDC’s algorithms.
The output from the NCDC is then further “processed” and “adjusted” by GISS and CRU and Hadley [ combined CRU and Hadley known as HADCRU; Hadley processes ocean temperatures .GISS and CRU process and further “adjust” the NCDC land data ]
All of these weather data organisations including BOM are members of the UN’s 191 member World Meteorological Organisation
As such they are quite likely sharing the basic data adjustment algorithms across most of those 191 members of the WMO.
So what we are seeing here is highly likely to be very closely connected to the very similar problems that have been the subject of a very acrimonious argument about the actual adjustments and the realities of the claimed temperatures after all those adjustment algorithms have worked the original data over multiple times.
After Anthony Watts had, through his volunteer based station survey in the USA, shown just how seriously bad and comprimised the USHCN [ US Historical Climate Network ] stations were in locations and UHI across the whole of the USA, the American’s very quietly brought in a new entirely electronic based temperature measuring system called the CRN [ Climate Reference Network ] using the resistor based MMTS [ Minimum , Maximum Temperature Series ] in around the early 2000’s.
Now this CRN MMTS based system itself has some very serious questions hanging over it as well as to it’s actual accuracy at measuring temperatures and this is BEFORE any processing of that temperature data is done by the first port of call for all data, the NCDC .
The resistors used in the MMTS stations have quite large deviations from the temperatures as measured by the LIG’s [ [ Liquid In Glass ] thermometers. Those differences vary between stations but generally range from recording minimums about 0.37C above the of LIG’s and around 0.4 C below the maximums recorded by the LIG’s which then of course leads to further adjustments.
Consequently it is being asked now by a number of sources; Just what are the real temperatures they are now supposedly trying to measure?
I don’t know how many Australian stations now use the MMTS type system but all automatic stations would do so and those that do would need further algorithm based adjustments to bring their temperature data into line with the older LIG’s.
And if the MMTS varies considerably and unpredictably across the temperature range from the LIG’s then the data is hardly worth the electrons expended on it as far as using for a base to make hundreds of billions of dollars worth of policy decisions based on this what could be eventually seen as spurious and
mal-adjusted data.
It is also worth pointing out that due to very minor changes in manufacturing processes between manufacturers in the production of the electronics of the MMTS system then there will be differences in response rates, in durability, in the amount of drift over time in measurements as the resistors age and etc and etc.
Problems in instrumentation which are not yet resolved in even the highly sophisticated oceanic ARGO deep diving float system which are used to measure a claimed hundredth of a degree differences in deep ocean water temperatures [ Yeh ! Right! ]
The ARGO system has had three adjustments to it’s data already [ always warmer ] and that after just a decade of operation.
MMTS and some of it’s problems explained here by Anthony Watts.
_______________
And here ;
Air Temperature Comparison between the MMTS and the USCRN Temperature Systems
Abstract
A new U.S. Climate Reference Network (USCRN) was officially and nationally commissioned by the Department of Commerce and the National Oceanic and Atmospheric Administration in 2004.
During a 1-yr side by-side field comparison of USCRN temperatures and temperatures measured by a maximum–minimum temperature system (MMTS), analyses of hourly data show that the MMTS temperature performed with biases:
1) a systematic bias–ambient-temperature-dependent bias and
2) an ambient-solar-radiation- and ambient-wind speed-dependent bias.
Magnitudes of these two biases ranged from a few tenths of a degree to over 1
41
Darn or much worse!
Lost the rest of the post unfortunately when I moved on too quickly from pressing the Post Comment button
01
Ok! I’ll have another stab at the rest of this post;
Re-posting the complete abstract and conclusions from that 2004 paper on the difference between the LIG’s and the USCRN’s MMTS electronic system of temperature measurement.
Air Temperature Comparison between the MMTS and the USCRN Temperature Systems
ABSTRACT
A new U.S. Climate Reference Network (USCRN) was officially and nationally commissioned by the Department of Commerce and the National Oceanic and Atmospheric Administration in 2004.
During a 1-yr side-by-side field comparison of USCRN temperatures and temperatures measured by a maximum–minimum temperature system (MMTS), analyses of hourly data show that the MMTS temperature performed with biases:
1) a systematic bias–ambient-temperature-dependent bias and
2) an ambient-solar-radiation- and ambient-wind-speed-dependent bias.
Magnitudes of these two biases ranged from a few tenths of a degree to over 1
11
Looks like there’s a glitch somewhere in the system.
Ah well you can go to the URL and read it for yourselves
11
First we had “Science”, then we got “Settled Science” and now we get “Adjusted Science”, sorry but Global Warming is forever an abomination, to all but the zealots and the newly indoctrinated, young and naïve.
31
I see a new report all over today’s news that the Great Barrier Reef is doomed! It will never recover! By 2050 it will disappear! mmm seems to me it must be that time of the cycle for applications to be submitted for more funding grants.
51
New paper from the Netherlands on C02 emissions
61
I’ve said this before about US temperatures, but it applies equally to Australia.
If we have a reasonably large number of well-sited instruments, why do we need to do all this homogenisation and playing with the numbers?
If there is a clear trend, it must show up in many of the individual records – it is absurd to say that it is not there unless we homgenise and in-fill and adjust.
41
Okay, Jo, you’ve proven your point. I can get more outraged about adjustments when there’s a bunch of them all going in the politically correct direction.
For every Acorn station trend to be steeper than “the raw data trends of the closest neighbours in the Acorn dataset” implies that every station has been artificially warmed over time. That may be to correct for occasional cooling events such as stations being occasionally moved deliberately further away from a slowly expanding town. On the face of it that seems plausible. Correcting for each move’s cooling without also correcting for the UHI warming in between moves will introduce bias. So the credibility of Acorn depends on whether it fades in the warming correction prior to the cool jump correction. When I next checked McIntyre’s site to see what he says, it turns out that’s basically how he explains the problem too.
Then there’s the issue of treating negative jumps differently to positive jumps and correcting for non-UHI jumps, highlighted by Eric Thompson’s comment.
Reading through BoM’s Acorn Acquittal linked at Ken’s 12.1.2 I can’t help but notice it uses the infamous Mennian Slice’n’Dice technique, a known post-facto heater of warming climates for basically that same reason as above – that it detects jumps in the opposite direction of a prevailing trend more easily than in the same direction, with the consequence it will amplify the prevailing trend with biased corrections.
That still doesn’t explain how Carnarvon, a tiny coastal town, would get the Goanna Oil treatment.
Never mind why towns 500km inland are considered peers with homogenous trends.
Definitely coming down with a mild case of outrage now.
41
Re: towns 500km apart, I will post shortly about Carnarvon’s neighbours, and also about whether cooling outliers show the same effect- greater cooling than neighbours.
31
Ah right. Well you can ignore everything I said above about Acorn being the same as the Menne technique, because I’ve just looked at your blog post and obviously some declining trends were converted into warming trends. That’s not what I’ve heard about the original Menne 2009 method.
BoM said they changed the method from Menne slightly but I didn’t think the 3 differences would change the behaviour that much.
So in some ways that’s actually worse. How do they justify turning cooling into warming? There’s the issue.
21
It’s simple, the temps do not follow the models, so the temps have to be adjusted. Choosing sites that cover large area’s makes for the largest Global change, with the minimum number of sites. Since these are remote sites, its easier to have reasons to adjust, and no close proxies to require additional justification.
31
I don’t get it. Why should there be any adjustment regardless of the conditions and reasons they postulate? If the reason is due to the surrounding area (eg, urban heat island effect) then discard the readings altogether and re-locate the sensors to a more suitable location. If the reasoning is they need to be adjusted due to seasonal and/or regional factors to forma a more homogenous large area view of the temperature, then why bother taking the readings in the first place if the intent is not to measure the and record the actual temperatures at each location as is? Simply take the raw readings over as many locations as possible (but away from airports, car parks, next to air conditions, etc.) and stop fiddling with the data. I suppose next they will adjust sea levels due to some mystical effect from the gods. It’s about time the AGW alarmist scientists be made accountable for allowing the biggest hoax in history to become the biggest financial scam.
41
PeterS
July 22, 2014 at 12:43 am
“I suppose next they will adjust sea levels due to some mystical effect from the gods”
Peter! Peter!, they ARE adjusting sea levels by adding 0.3 mms per year and it is done to compensate for the so called “isostatic rebound”, the way in which the earth’s ocean basins are supposedly expanding as the rocks of the earth’s surface rebound from the melting of the great ice sheets and are therefore the ocean basins are of a larger volume each year and therefore with a fixed volume of water to fill them, the water levels, the sea surface levels that you and I always have accepted as the actual sea levels will be lower each year by a modelled minus -0.3 mms a year.
So a totally invented and totally spurious plus +0.3 mms is added to the official sea surface levels each year to compensate for that isostatic rebound.
So in a decade we then have a 3 mms of sea surface rise that doesn’t actually exist.
In a century we have 30 mms of sea level rise that doesn’t actually exist.
So the ocean swimmers and surfers of 2100 will be swimming about 30 mms lower than the official sea surface level and therefore likely to be scientifically more likely to be involved in a climate modeled drowning which they will no doubt walk away from.
Plain stupidity is an increasingly noted characteristic of a large part of warmist climate science and warmist advocating climate scientists.
That official sea level is no longer what you and I see on a tide gauge or against some rock that hasn’t shifted for the last half a million years.
That old common sea level you and I and every sensible person knows has become a Sea Level that is now is adjusted and changed and modeled to be directly related to the centre point of the earth.
So that newly discovered isostatic rebound challenged sea level now needs lots of adjustments and models and lots of extra staff and scientists and lots and lots of tax payers funding to keep everybody in the style to which they have become accustomed. [ sarc ]
We are discussing a science and scientists who appear to have little in the way of scruples when it comes to distorting and corrupting some part of climate science they control to further their own brand of a climate catastrophe ideology and their own personal advancement and enrichment.
It is now obvious that so many of these spurious and from a lay persons and an engineers and business persons perspective, totally irrational and arbitrary and without any credible foundation so called adjustments that are coming to light throughout the warmist run organisations responsible for maintaining the global data base on the whole gamut of climate related scientific data.
The whole corrupting of the climate science data thing as seen in this sea level isostatic adjustment example plus climate science’s total reliance on increasingly dis-creditied models and modelling all used to enforce highly damaging social economic and society de-stabilising policies onto the populace, a completely corrupted climate science is on the way to ensuring that in the longer term, it will take a couple of generations to get most of the rest of science back to a modicum of a level of public respect.
You can read all about the isostatic sea level adjustements in the URL below which is the formulator of the isostatic adjusment meme from the official and most quoted sea level research group, the Colorado University Sea level research group’ isostatic rebound adjustments of 0.3 mm increase per year in the official sea level data here ,
What is glacial isostatic adjustment (GIA), and why do you correct for it?
And just for information; despite the claims of the activist Colorado group that sea levels are rising by 3 mms per year plus that spurious plus +0.3 mm adjustment, satellite and tide gauge data is now showing that global sea level rises are now running at somewhere between 1.3mm to 1.6mms a year at the maximum and maybe a lot less than that..
21
As this post is on temperature adjustments one of the world’s major keepers of global temperatures is NASA’s GISS [ Goddard Institute of Space Studies; Robert Goddard was a 1930’s period pioneering American rocket researcher ] previously run by that paragon for an advocate of catastrophic global warmiing and the now “retired” James Hansen.
So GISS is right up to date with it’s data and everything is technically correct particularly coming from an organisation with the [ fast fading ??? ] reputation of NASA.
Well think again!
. EM Smith has been messing around in the publicly available and now quite ancient GISS data files from 2011 which are the latest GISS data files available even though they are now 3 years old and haven’t been updated, thats if an update exists let alone if it is publicly available
And this how GISS and no doubt CRU process and keep the global temperatures and then proceed to pontificate at length on the modeled rise or fall or what ever of the current global temperatures.
Considering the truly catastrophic nature of the what apparently passes for record keeping and the processing of the data , all seemingly done without much in the way of any documentation that the NCDC, GISS and CRU are prepared to release to the public, I am seriously doubting now that they actually have any real clues on just what global temperatures are doing at present.
Roy Spencer’s satellite temperature data has problems but at least Spencer has a very good reputation for integrity and honesty and has copped bucket loads of c**p from the warmists for that honesty and integrity and his refusal to sell his soul to the warmista cultists.
Quoted from E.M.Smiths Chiefio blog
____________________
GIStemp – who needs Antarctic data or temps near ice.
Example in reference to Antarctica, the fifth largest continent at 13,720,000 sq kms out of the accepted seven global continents.
Quoted ;
“Since GIStemp smears data via ‘homogenizing’ to places where it has no data, from places where it does have data, and since those places can be up to 1200 km away (though it does this smear in three different steps, so really might be ‘smearing a smear’ from up to 3600 km away) it can just fill in the temp data using ‘nearby’ stations
In the final steps GIStemp adds in the Hadley Sea Surface Temperature.
So what is wrong with using cold temps from near the ice to fill in over the ice?
Well… How about if you decide to just not use temperatures from places where the water is near the ice?
In Conclusion
I’ve got some more on GIStemp, but that will wait for another posting.
The big lumps are just that the source code is out of date, the data looks like it is missing a chunk from ‘down south’, and in 2011 the code was modified to avoid water temps from near ice.
One can only wonder what possible rationalization could exist for that change. IMHO, it is totally unwarranted by any means.
Might as well just start dropping any thermometers in cold places…
___________________
[ quote end ]
11
I asked the BOM why they were adjusting temperatures via their helpdesk service.
this is the response that I received (within 3 days)
The Bureau of Meteorology has put together an extensive package of information in relation to the homogenised temperature datasets. This information, including basic explanations of homogenised data and a range of scientific technical reports, can be found at the following dedicated website:
http://www.bom.gov.au/climate/change/acorn-sat/
The Bureau collects and publishes a broad range of weather and climate observations and data and produces multiple temperature data sets, all of which are publicly available. These include the basic raw station data, spatially homogenised gridded temperature data and temporally homogenised data based on a sub-set of the total temperature network. In making these available, the Bureau provides a comprehensive set of temperature data that is fit for a wide variety of applications.
Each set of data is subjected to different quality assurance processes according to the purpose for which it is either being collected or produced. Our analysis techniques are based upon best-practice scientific methods, and are documented in the form of technical reports as well as published in high-quality international journals. Technical reports are internally peer reviewed by experts within the Bureau, while the preparation of published data is additionally peer reviewed by external experts arranged by the relevant journal. This means that most data has passed through two review processes.
The preparation of the homogenised temperature data has passed through four levels of scientific peer review, this includes two internal review processes and the external review process associated with the publication of methodologies and results in the international literature. The latest homogenised temperature dataset, the Australian Climate Observations Reference Network – Surface Air Temperature (ACORN-SAT) has been subject to an additional, dedicated international peer review. This review assessed the Bureau’s practices in collecting and preparing temperature data as amongst the best in the world. All material relating to this review can also be found at the link above.
The data, technical reports, and the findings of the panel were published as part of the supporting documentation.
Regards,
Climate Analysis Section
National Climate Centre – Bureau of Meteorology
| email: [email protected] | fax: +61 3 9669 4678
Please consider the environment before printing
10
Carnarvon airport only seems to have records to 1945. Could that be related to an adjustment… ie a shift from one site to another and then a correcting of records?
00
Mattb:
I hope to post more detail about Carnarvon later today or tomorrow at kenskingdom. There was sufficient overlap between 1945 and 1950 (despite many missing months) to make a good splice or combined record. After about 1946 the old Post office site was recording warmer temperatures especially in autumn and winter, but during 1945 and 1946 monthly mean temperatures were virtually identical to the Airport, so the old Post Office data does not need adjusting apart from 1947-48-49 when I adjusted down by 0.4C for my splice. Acorn has a very small adjustment in the early 1940s (-0.2) so the massive difference in trend has nothing to do with overlap adjustments.
00
Ken,
As per Jo’s comment I would like you to know I appreciate the time it takes to put all this data together.
It is a massive effort.
Thank you very much.
00
You’re welcome. I enjoy the sleuthing.
00
I don’t know if you allready have this:
https://openlibrary.org/books/OL7221939M/The_climate_and_weather_of_Australia
[Thanks! I shall forward it on to the independent BOM audit team – Jo]
00