Years before Climategate, THAT email, from Phil Jones to Warwick Hughes told us everything we needed to know about the scientific standards at the Climate Research Unit of East Anglia. THAT email was the tip of the iceberg, and below is what lay underneath the surface — the things that were said behind the scenes at the time. Geoff Sherrington has pieced together a sequence of climategate emails, his own emails, and parts of Warwick Hughes work to recreate the sequence.
And for the true skeptic-aficionados, here’s a new layer of history to the skeptical chronology. Where did this volunteer audit movement begin?
Who would have guessed that at least one skeptic, Hughes, was asking for the data Phil Jones worked with, as long ago as 1991? (That was way back in the days where people worked with hard copy print outs, and drew graphs by hand!) Does Hughes rank as volunteer Skeptic Number 1?
UPDATE: I asked Warwick, and he thinks the first unpaid skeptic was Fred Wood in 1988*. — Jo
——————————————————————————
Guest post by: Geoffrey H Sherrington, Scientist.
This is the longer story behind one of the more anti-science quotes in the short history of people attempting to be ‘climate scientists’, definition unclear. The pivotal short quote is in the opening email.

“Why should I make the data available to you,
when your aim is to try and find something wrong with it.”
…
Here is a series of emails and articles with my interspersed comments in italics. Each email number is the one assigned in Climategate One and Two, presumably by the donor named FOIA. The Climategate emails are indented below, so the source can be picked up easily. There are sections cut from other emails as well. They are not indented. We start with the famous email, the one that some say was the start of the difficulty that scientists in general found when they tried to access data from some climate scientists.
———————-
From Phil Jones to Warwick Hughes.
1299. Between July 2004 and Feb 2005. (Exact date not on my copy of the email.)
I should warn you that some data we have we are not supposed top (sic) pass on to others. We can pass on the gridded data – which we do. Even if WMO agrees, I will still not pass on the data. We have 25 or so years invested in the work. Why should I make the data available to you, when your aim is to try and find something wrong with it. There is IPR to consider. You can get similar data from GHCN at NCDC. Australia isn’t restricted there.
ACRONYMS
WMO = World Meteorological Organisation.
IPR = Intellectual Property Rights.
GHCN = Global Historical Climatology Network.
NCAR = USA National Centre for Atmospheric Research.
WWR = World Weather Records of the World Meteorological Organization.
MCDR = WMO’s Monthly Climatic Data for the World.
Phil had had some prior thoughts about this.
0688. 16 July 2004.
The reason for emailing though is that I’m also being hassled by Warwick Hughes for the CRU station dataset. We put up the gridded fields, but not the station data. Over the last year or so, I’ve told people they can’t have the station data – go to the GHCN site and get it. I knew that avenue has been closed, but it got some of them off my back. I’m not that inclined to release it to Hughes (who Mike knows and maybe Tom). All he wants to do is to show how I’ve made some mistake or used some incorrect data for some stations.
There are a number of issues, though:
1. Should Res. 40 stop GHCN data being released?
2. Should I be hiding behind it too?
3. When does IPR kick in with the work I’ve put in on the CRU data?
4. Should people like this be able to request this kind of data?
5. NCAR release a precursor to GHCN – just WWR/MCDW+lots of other data, but in an unfriendly format.
From Phil Jones to Tom Peterson.
Thomas Peterson was near the top of NOAA, USA National Oceanic and Atmospheric Administration. See http://www.noaaworld.noaa.gov/scitech/sep2008_scitech_4.html
Jones seems to be unsure of the efficacy or legality of ways to avoid a direct answer to Warwick Hughes. Jones appears to know that he is deliberately telling people to go to a place where they will not find the answers they seek. Note the term “unfriendly format”.
Why was Warwick Hughes seeking certain data in 1990?
In Warwick’s words:

Warwick Hughes
“I started reviewing Prof Jones work in 1991 and I have a timeline of my work and published papers in those early years – many links. People have asked me how I got started looking into temperature data.”
“I first got curious about GW through media reports up to 1990 and wanted to check Australian data for myself – at that point I had never used a PC. I went into the BoM in Lonsdale Street and paid for hard copy printouts of stations from here and there – no idea how I selected sites – just places I knew and maybe the counter staff suggested stations. I drew a series of charts on graph paper and seeing a variety of disparate trends – being unable to find GW – showed them to some ex mining industry contacts. One guy gave me an intro to people at the Tasman Institute in the Melb CBD and about April 1991 I breezed in there with these hand drawn charts and showed a staffer – who said; “..you will have to get all this material onto disk – you can come in here and learn to use a PC.”
They gave me a little cubbie of a desk and a 286 PC with Win3.1 and I began pestering staff as to how to get some work out of this box thing. Anyway – the worst phase probably only took a few weeks and I could get some work out of Excel – my early data was entered to disk from my sheaf of hard copies printouts. Sometime in winter 91 I made contacts in the BoM and somebody gave me a copy of the US DoE TR027 report – which details – station by station – Jones et al Southern Hemisphere compilation of GW.
The Australian component of their Appendix A – was my basic source to track down Australian long term stations – I built on from there – for example work done building the data for the Balling, Idso & Hughes 1992 paper – that caused the BoM so much heartburn.”
“This work lead on to my construction of the two contrasting temperature histories from circa 1882, Graph 1 for 25 regional and remote Australian stations and Graph 2 for the six Australian capital cities.”
“City Reviews takes you to many instances of urban heat island UHI contamination of city temperature data still used by Jones/UKMO/IPCC.”
About a half dozen people or more, like me, from larger companies, would meet monthly to distribute funds to Tasman and to review work in progress. Warwick made a presentation in 1991-2. He was more prescient than I was. I left the climate scene early in 1993 and did not reconnect until about 2005. The work presented to Tasman Institute contained several graphs. These two persist, see http://www.warwickhughes.com/1991/targw.htm for a longer discussion.
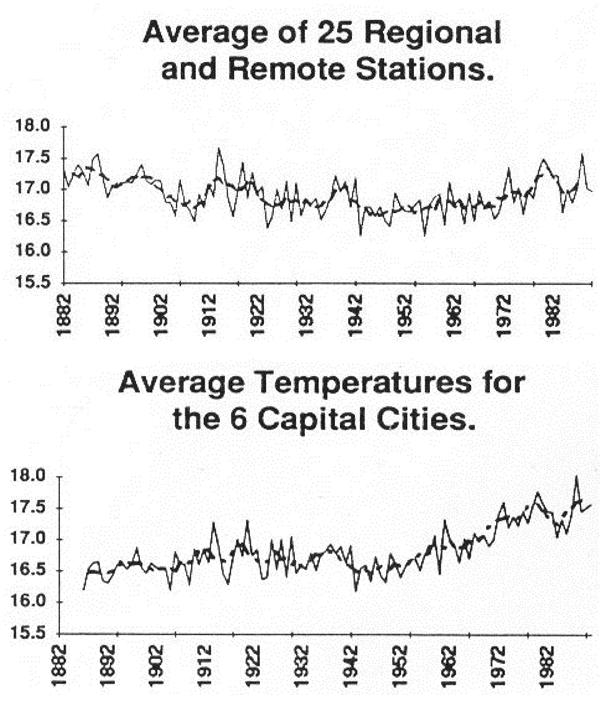
Top graph: Geraldton, Narrabri, Hay, Albany, Rottnest Island Lighthouse, Walgett, Deniliquin, Bourke, Cape Naturaliste Lighthouse, Coonabarabran, Echuca, Cooma, Darwin, Moruya Heads Pilot Station, Omeo, Dubbo, Alice Springs, Gabo Island Lighthouse, Bathurst, Strathalbyn, Mt. Gambier, Yamba, Wilsons Promontory Lighthouse, Newcastle Signal Station, Cape Otway Lighthouse.
Lower graph: Sydney, Melbourne, Brisbane, Perth, Adelaide, Hobart
It was Warwick’s contention that the search for UHI had been less that thorough as to choice of Australian stations. Here he shows that the temperature change in the average of several large Australian cities was positive, whereas that of a selection of rural sites was negative to level. (Temperature is in Celsius, Tmean annual compiled from half of the sum of Tmax and Tmin daily). Somehow, Phil Jones had concluded from figures similar to these that UHI was negligible in Australia, a finding that is still being quoted in 2011.
In 2004- early 2005, Warwick wrote a number of emails to CRU and WMO, which do not appear in Climategate records, but which are on file here. Some of them detail efforts by Phil Jones to stop bodies like the WMO from cooperating with Warwick. Much of his interest was in the raw data behind two papers from University of East Anglia, being –
Jones, P. D., S. C. B. Raper, T. M. L. Wigley, 1986: Southern Hemisphere Surface Air Temperature Variations: 1851–1984. J. Climate Appl. Meteor., 25, 1213–1230.
This first main paper involved an assembly of data for the USA DOE (Department of Energy) for CDIAC. (Carbon Dioxide Information Analysis Center, Oak Ridge national Laboratories, Tennessee, USA.)
http://dx.doi.org/10.1175/1520-0450(1986)025<1213:SHSATV>2.0.CO;2
The second main paper:
Jones, P.D., P.Ya. Groisman, M. Coughlan, N. Plummer, W.-C. Wang and T.R. Karl, 1990: Assessment of urbanization effects in time series of surface air temperature over land. Nature 347, 169-172
.
This second paper dealt with data from China, Russia and Eastern Australia and it was one of the key papers promoting a stampede of thought under the Global Warming banner. It is an important paper, but it is wrong.
Warwick subsequently had the following papers published and a few more rejected, perhaps because they questioned the orthodoxy.
1992 Robert C. Balling, Jr., Sherwood B. Idso, and Warwick S. Hughes. “Long-Term and Recent Anomalous Temperature Changes in Australia.” Geophysical Research Letters, Vol. 19, No. 23, pp. 2317-2320. [Abstract]
1995 Robert C. Balling, Jr. and Warwick S. Hughes. “Comments on “Detecting Climate Change Concurrent with Deforestation in the Amazon Basin: Which Way Has It Gone ?” Bulletin of the American Meteorological Society, Vol. 76, No. 4, 9. 559.
1995 Warwick S. Hughes. Comment on D.E. Parker, “Effects of Changing Exposure of Thermometers at Land Stations.” International Journal of Climatology, Vol. 15, pp. 231-234.
1996 Warwick S. Hughes and Robert C. Balling, Jr. “Urban Influences on South African Temperature Trends.” International Journal of Climatology, Vol. 16, No. 8, pp. 935-940. Online at [2]http://www.john-daly.com/s-africa.htm
1997 Warwick S. Hughes. Comment on, “Historical Thermometer Exposures in Australia.” by N. Nichols et al. International Journal of Climatology, Vol. 17, pp. 197-199.
In year 2005, the Global Warming discussion was leading to many unscientific statements. I became involved, writing a letter to the national newspaper here. ‘The Australian’ 15 February 2006:
“THERE is an excellent argument for curbing the public statements of scientists like those from CSIRO, a former employer of mine. Scientists, like the public, cover a spectrum of beliefs, some of which are based on emotion rather than science.
An example is the selection of Australian weather recording sites used to construct the temperature measurements of the continent, which play a big part in southern hemisphere weather models. From the beginning, most sites that showed little or no temperature rise or a fall from, say, the 1880s to now were rejected. The few sites selected to represent Australia were mainly from capital cities and under suspicion for “heat island” effects. I could give example after example as it was one of my employment functions to distill the best results from the bogus on many mattersrelated to energy/greenhouse/nuclear etc. I found few truly objective submissions among those masquerading as science.” Geoffrey H Sherrington.
This created a storm, because the Climatic Age of Innocence in Australia was again under threat.
For example, http://jennifermarohasy.com/2006/03/geoff-sherrington-responds-to-chattering-class/
Also, I sent emails to Phil Jones. These are too long to reproduce in full, so later I collated them for the Climate Audit blog. The first one starts a few paragraphs down from here, datde 24 March 2006. The “missing graphs” to which I refer are those in the text just above here. The Jones+Sherrington email exchange is not in the Climategate sets. Two recurrent themes are the evasion of a direct answer by Jones; and as we shall now see, the way in which data disappear, reappear, are available, are not available, are reliable, are not reliable. This might seem like fun, but it is not like Science.
The URL is http://climateaudit.org/?s=Sherrington+Jones+emails
At about this time, the subject of Freedom of Information law, especially in Britain, started to become mentioned more often.
——————-
5133. 20 Jan 2005.
From Phil Jones to Tom Wigley, CRU.
On the FOI Act there is a little leaflet we have all been sent. It doesn’t really clarify what we might have to do re programs or data. Like all things in Britain we will only find out when the first person or organization asks. I wouldn’t tell anybody about the FOI Act in Britain. I don’t think UEA really knows what’s involved…..
I got a brochure on the FOI Act from UEA. Does this mean that, if someone asks for a computer program we have to give it out??
As Phil Jones warms to the subject of Freedom of Information, he seems to have learned enough to become expert in advising others:
———————-
3341. 3 Dec 2008.
Phil Jones to Tom Wigley, CRU.
When the FOI requests began here, the FOI person said we had to abide by the requests. It took a couple of half hour sessions – one at a screen, to convince them otherwise showing them what CA was all about. Once they became aware of the types of people we were dealing with, everyone at UEA (in the registry and in the Environmental Sciences school – the head of school and a few others) became very supportive. I’ve got to know the FOI person quite well and the Chief Librarian – who deals with appeals. The VC is also aware of what is going on –
CA = Climate Audit blog (Steve McIntyre). VC = Vice Chancellor
Most of the following is self-explanatory parts of emails from Climategates One and Two.
——————-
0377. 9 December 2003.
Ian “Harry” Harris, CRU programmer to Keith Briffa, CR
Aaaaaand it’s obviously not just me having trouble with it 🙂
…including additional documentation, fixing of minor typos in the
descriptions of different datasets, and providing some additional
minor methodological details of the MBH98 analysis. We are also
providing the full raw instrumental University of East
Anglia/Climatic Research Unit surface temperature dataset 1854-1993
(Briffa and Jones, 1992), because CRU has since updated their surface temperature dataset, and no longer archives the version that
we used when we began our study in the mid 1990s.
Ooh! Are we being scolded?
U.
Harry had reason to be concerned. Here are selected extracts from Climategate One as reported in ‘The Daily Inquirer” newspaper on 2 Dec 2009, http://www.thedailyinquirer.net/harry-read-me-the-climategate-report/127123
Harris is a climatologist/programmer at the CRU and his “Harry Read Me” documents his efforts to update a huge statistical database (11,000 files) of important climate data between 2006 and 2009. What’s scary is Harris admits that much of the center’s data and applications are undocumented, bug-ridden, idled with holes, missing, uncatalogued and, in short, utterly worthless. Here are some of the programmer’s comments (with the page number in the parenthesis):
– “Am I the first person to attempt to get the CRU databases in working order?!!” (47)
– “As far as I can see, this renders the (weather) station counts totally meaningless.” (57)
– “COBAR AIRPORT AWS (data from an Australian weather station) cannot start in 1962, it didn’t open until 1993!” (71)
– “What the hell is supposed to happen here? Oh yeah — there is no ’supposed,’ I can make it up. So I have : – )” (98)
– “You can’t imagine what this has cost me — to actually allow the operator to assign false WMO (World Meteorological Organization) codes!! But what else is there in such situations? Especially when dealing with a ‘Master’ database of dubious provenance …” (98)
– “So with a somewhat cynical shrug, I added the nuclear option — to match every WMO possible, and turn the rest into new stations … In other words what CRU usually do. It will allow bad databases to pass unnoticed, and good databases to become bad …” (98-9)
– “OH F— THIS. It’s Sunday evening, I’ve worked all weekend, and just when I thought it was done, I’m hitting yet another problem that’s based on the hopeless state of our databases.” (241).
– “This whole project is SUCH A MESS …” (266)
Having established some reason to doubt the accuracy of the CRU data, we turn now to the “now you see it, now you don’t” aspect. Here is my first attempt to gather data from CRU. It overlaps with Warwick’s requests. This is not in the Climategate emails, it is personal.
——————
24 March 2006:
From Geoff Sherrington to CRU.
I seek the figures which were used from Australian weather stations at the start of your climate modelling work in the 1980s. I seek to know the first set of Australia weather stations used in modelling, plus the set that was rejected and if possible, the span of data by years (or the data itself) for each of the stations considered and eventually used initially. Is it possible to obtain this information?
—————-
March 25, 2006:
From CRU to Geoff Sherrington.
Dear Geoffrey, We no longer have the Australian station date we were using in the early 1980s. At that time we had a limited network. In the 1990s, the Australian Bureau of Meteorology began issuing a lot more station data each month. Up to that time it had been about 40 stations internationally. Through contacts with personnel in Melbourne, we got access to the back data from all the new stations, so added these. In order to use temperature data, we need historic series with at least the 1961-90 base period. We now have access to over 100 stations from BoM in real time … Australia is the only country to make additional data (additional to the about 1500 exchanged by Met Services) to us in real time.
Warwick tried to get information from the USA Government. This related to the first main paper quoted above, from data collected by CRU for the US Government, who paid Phil Jones & Co on an ongoing basis. The response was negative.
http://www.warwickhughes.com/blog/?tag=phil-jones
In Oct 2005 I (Warwick Hughes) wrote to DoE CDIAC asking for the Jones et al/CRU station data and was told:
“.. Phil was not obligated under the conditions of past or present DOE proposal awards to provide these items to CDIAC. I regret we cannot furnish the materials you seek.”
Phil Jones tells others that an Australian BOM officer is ignoring Climate Audit and Warwick Hughes.
————————-
2143. 19 June 2007.
From Phil Jones to Tom Wigley.
Just looked at the CA web site, and their latest is a real go at
the Jones et al. (1990) paper. When Wei-Chyung got the email from
Keenan he was going to Norway for a meeting. Maybe he’s back now.
It seems as though they didn’t give him much time to respond.
I have a JGR paper to review by a number of Chinese on temp trends
there. Warming looks much greater than CA would believe. They refer to a
J. Climate paper (which is either in press or resubmitted – depends where
it is referred to in the paper !) which reckons that 30-40% of the warming
there is urban related. Not keen on it being said this way, but need to
read the paper beyond the abstract and the urban section.
As for pointers, yes stress this is just USHCN and not global. Maybe
also point out that work on assessing homogeneity is best done within
the country (even if Russ doesn’t agree), so could mention Lucie re
Canada. There are apparently some Australian pictures as well on the
CA website. I had an email from David Jones of BMRC, saying they will
be ignoring anything on CA and anything from Warwick Hughes.
The other aspect to point out is that the SSTs are warming around most coasts,
and the open ocean as well, so UHIs can only be a small part of the overall
warming. There is a sentence or two on this in Ch 3, in the ES if I recall
correctly.
Could also point out that there are many totally rural sites around the world
which show strong warming.
More Acronyms
CA = Climate Audit blog.
BMRC = (Australian) Bureau of Meteorology Research Centre
SST = Surface Sea Temperature.
UHI = Urban Heat Island. (Natural temperatures artificially elevated by man-made developments near weather stations).
The puzzle deepens. Phil had the data after all!
————————–
2581. 27 February 2007.
Phil Jones to Thomas Karl NOAA USA.
I have had a request for the data from McIntyre, but I am not sending
the data. I am already tried and convicted, so there is no point
in sending them anything. I will not bother replying as well. I might
as well act as expected. They will run out of steam in a week or two
and move onto something else.
There is a clear thread running through the comments. By the way,
CRU isn’t changing any of the current data that is coming in on the
CLIMAT system, except where it is wrong. We are getting Australia
directly as their CLIMAT messages don’t calculate monthly means
as they used to pre-1994, and for a few sites in eastern Canada,
where Lucie Vincent developed homogeneous series – but adjusted
them to the pre-1960 period.
By the way, I do have the data from the study on disk! I was wise even when Steve McIntyre first requested the data many years ago. I think I could replicate the study if I had that rare commodity – time.
The penultimate paragraph of the 1990 paper was mainly written by
Tom – thanks. It even has pre-IPCC definitions of likelihood!
Neil – can you pass this on with my best wishes to Mike.
CLIMAT = a collective system of periodic climate reporting by countries under an arrangement of the World Meteorological Organization.
At this stage Phil is still sticking to his story that CRU no longer has the data sought by Hughes, Keenan (for China) and self (for Australia). Then in the Climategate Two:
—————————-
3114. March 27, 2007
From Phil Jones to Dave Palmer, FOI officer, CRU.
Subject: Re: FW: Freedom of Information Act / Environmental Information Regulations. request (FOI_07-13 ; EIR_07-03)
I have found all the input data for the paper from 1990. This includes the
locations of the sites and the annual temperature values. If I were to get
someone in CRU to put them on our web site, do you think that would
keep them quiet, or just spur them into more requests?
The 1990 paper data isn’t that much, just 6 small files, each of about a half
an A4 page.
My earlier email about the other request (the first one) for all our data still
stands.
Phil loses data – again. Reported in “Guardian” newspaper. 15 February, 2010.
“In an interview with the science journal Nature, Phil Jones, the head of the Climate Research Unit (CRU) at the University East Anglia, admitted it was “not acceptable” that records underpinning a 1990 global warming study have been lost.
The missing records make it impossible to verify claims that rural weather stations in developing China were not significantly moved, as it states in the 1990 paper, which was published in Nature. “It’s not acceptable … [it’s] not best practice,” Jones said.
I cannot understand what Phil means, as he has previously stated in 3114 , three years before, that the data are not lost.
Then we get this expose. The Australian data have a serious error in any case.
————————–
2963. 3 March 2009.
From Phil Jones John Kennedy, a Canadian official, by way of mention.
Earlier today we got an email from Australia – see below. So, Australia is still
issuing the wrong CLIMATs as far mean T is concerned.
In the files I gave you last week, all Australian data post-Nov 94 has mean T calculated the way
it should be using (Tx+Tn)/2. Using the correct data warms Australia as a
whole by +0.15C compared to what is released.
—————————
2963. 3 March 2009.
To David Jones BOM from Blair Trewin BOM Australia
Australian temperature data [SEC=UNCLASSIFIED]
I’ve finally had a chance to have a look at this – it turned out to be more complicated than
I thought because a change which I thought had been implemented
several years ago wasn’t.
Up until 1994 CLIMAT mean temperatures for Australia used (Tx+Tn)/2. In 1994, apparently as part of a shift to generating CLIMAT messages automatically from
what was then the new database (previously they were calculated
on-station), a change was made to calculating as the mean of all available
three-hourly observations (apparently without regard to data completeness,
which made for some interesting results in a couple of months when one
station wasn’t staffed overnight).
What was supposed to happen (once we noticed this problem in 2003 or thereabouts) was that we were going to revert to (tx+Tn)/2, for historical
consistency, and resend values from the 1994-2003 period. I have, however,
discovered that the reversion never happened.
In a 2004 paper I found that using the mean of all three-hourly observations rather
than (Tx+Tn)/2 produced a bias of approximately -0.15 C in mean
temperatures averaged over Australia (at individual stations the bias is
quite station-specific, being a function of the position of stations
(and local sunrise/sunset times) within their time zone.
Perhaps this is a good end point. It shows that CRU and some of its people were unprepared to participate in the normal conduct of science; that they tried to thwart progress; that they invented reasons to explain disarray of their data, which disappeared and reappeared episodically; that they were prepared to flaunt Freedom of Information laws; that as Harry the programmer wrote, they were prepared to fabricate data; that they were manipulative; that they were Hell-bent on pushing a cause to the extent of rejecting wise counsel.
Perhaps, in regard to the start of this article, Warwick should have asked “Are your data worth having” before he asked if he could have some. There is good case that they were wrong then; and that they are wrong now, 2 decades later.
Credits:
Besides Warwick Hughes and trivial me, there were others seeking data from CRU. The list is too long for complete mention, but several stand out. These include Steven McIntyre of Canada, whose “Climate Audit” blog shows sophisticated analytical prowess. They include Douglas Keenan, whose legal investigations of the Chinese component of Jones at al 1990 paper were most revealing; and Willis Eschenbach, whose article on the Anthony Watts blog “Watt’s Up With That?” is on somewhat similar lines to my article above. (see http://wattsupwiththat.com/2011/11/27/an-open-letter-to-dr-phil-jones-of-the-uea-cru/ )
Willis wrote, inter alia, about Phil Jones –
“Rather than just saying that, however, you came up with a host of totally bogus reasons why you could not give me the data. Those were lies, Phil. You and David Palmer flat-out lied to my faceabout why you couldn’t send me the data.”
This makes an appropriate ending to my piece.
——————————————————————
Disclaimer: Apart from verbatim quotes by others, views expressed in this guest post are those of the author.
*Of course Sherwood Idso, Richard Lindzen, Roy Spencer, John Christie, Pat Michaels etc were all skeptics tackling this from professional positions at the time.