Was 2010 “the hottest year ever” as the PR machine repeats ad nauseum? Yes — but only if you ignore three of the four main global datasets and those awkward questions about why nobody thought to put thermometers in better places.
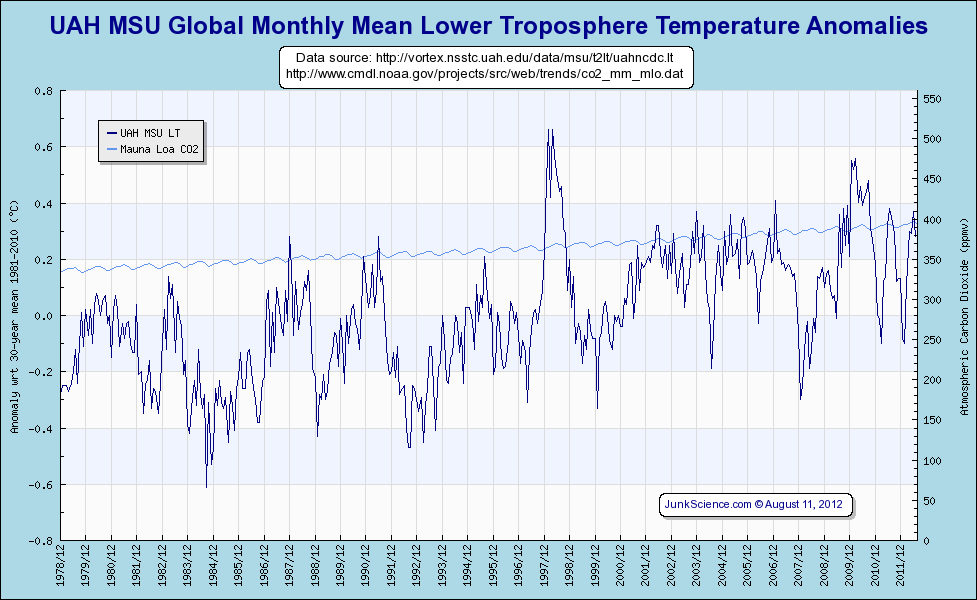
Run your eyes down this page to see how the GISS temperatures pan out compared to all the other compilations. This is James Hansen’s group, and GISS stands for the Goddard Institute of Space Studies — and in the topsy-turvey world of climate change, that’s apt — the space centre and hot bed of rocketry calculates world temperatures by ignoring … satellites. For GISS, measuring the world temperature, calls for irregularly spaced, unique, non-standardized temperature stations (sometimes near air-conditioning vents and concrete). And no sir, not the satellites that scan the Earth 24 hours a day, over land and sea, and which are usually not too close to exhaust vents, or buildings, or (thank goodness) fermenting vats of sewage either.
So, indeed, the only sane answer to the cherry picking crowd who crow triumphantly about their outlying most favorite result, is that “No” 2010 was not hotter than 1998, not according to the satellites. And even if it had been, the world was warmer for most of the Holocene. Get over it.
*PS: People still write to me and ask me how to reply to the oft repeated line about 2010. It’s also handy to mention that the world has been warming since before Napolean bought all those SUV’s. (The warming started before our emissions became significant, and at least since measurements began, the trend hasn’t changed and the models don’t know why. We also discussed this point in the here too, with other graphs.)
PPS: Vote here on the word “denier”, the ABC is wondering. (Thanks Bernd)
The four big temperature sets
Scientists owe a debt to Junkscience (the site) which has been the staple place to see quick, up-to-date graphs the same format. The site has had a big rewrite and these key graphs had moved. I’ve put the new links on my links page, and here as well. Junkscience Global Warming at a Glance is the central page for the whole fruit salad array of comparison graphs.
See also the JunkScience blog: All the Junk That’s Fit to Debunk.
The satellite sets are UAH and RSS, BTW.
UAH
RSS
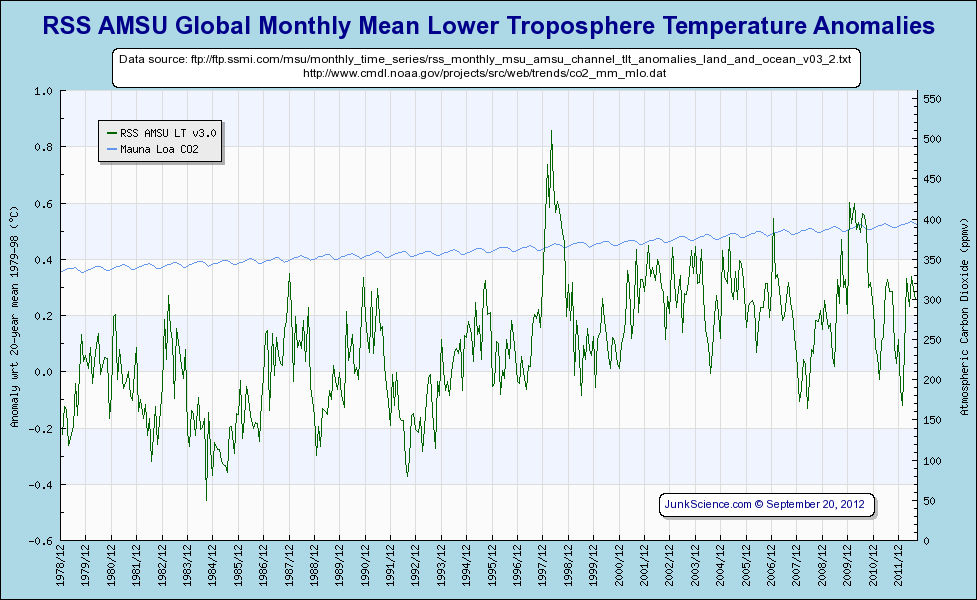
[Junkscience RSS MSU Source page]
GISS
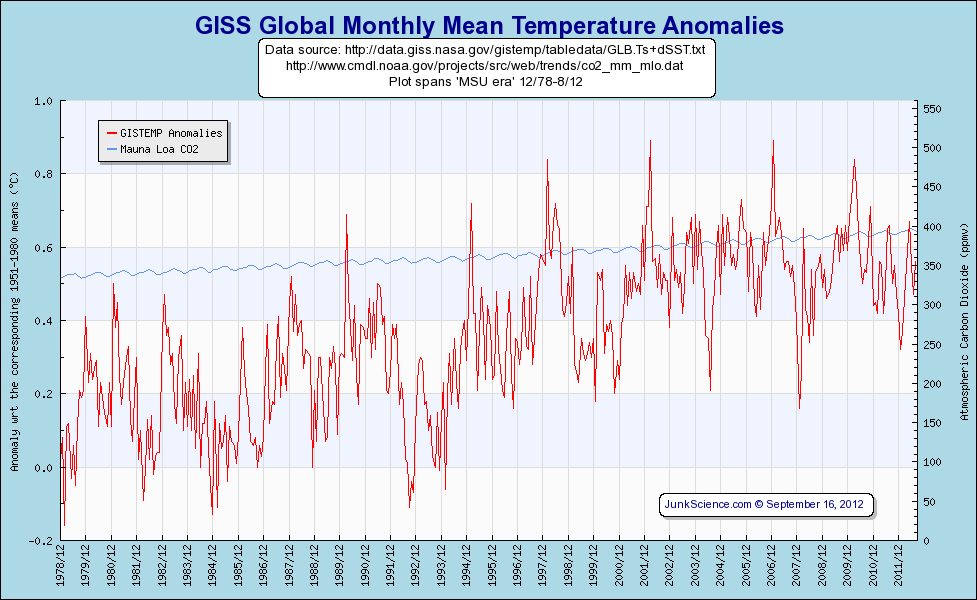
[Junkscience GISS Source page]
Hadley
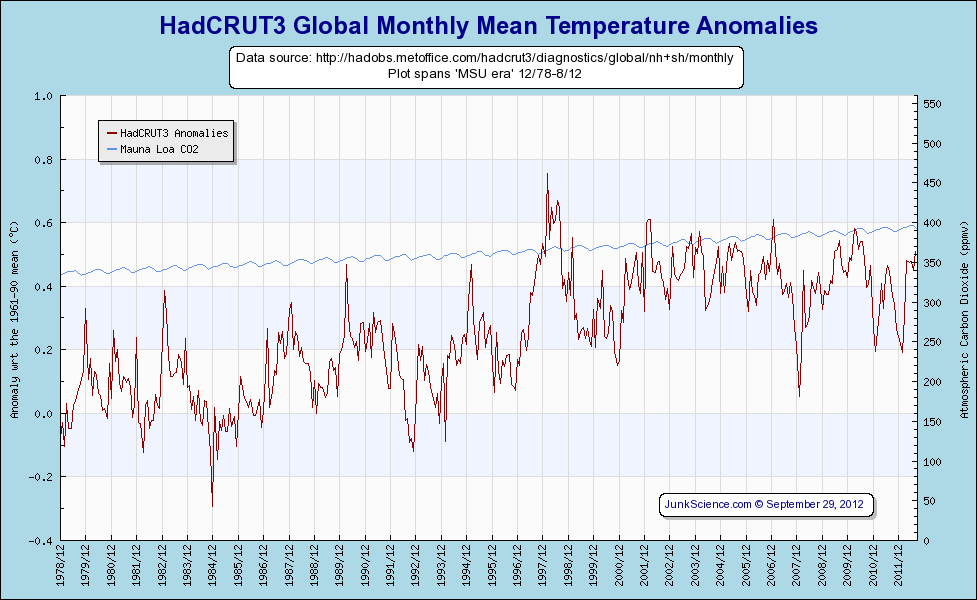
[Junkscience Hadcrudt Source page]
ADDENDUM: Dec 2012
When SkepticalScience says that 2010 is the hottest year, point out that satellite data is much better and it disagrees. It’s only highly adjusted records that rely on surface thermometers near carparks that says 2010 was hotter. When (un) SkepticalScience says that skeptics cherry pick and ignore the longer trend, you can tell them that the skeptics cite the longer trends all the time. The world has been warming for 300 years, seas have been rising for 200, and none of that fits with claims that CO2 caused it. Most of our CO2 has been emitted since World War II.


Hockey sticks no fiddle sticks?
20
Jo,
be patient. In a couple of months, after a nip and a tuck and a bing and a bong and a ‘hide the decline’ and a ‘the dog ate my data’ and a ‘beat the crap out Michaels’ here and a ‘bristlecone divergence’ there, gatekeeper Phil Jones and gatekeeper Tom Karl will ensure that 2010 is the hottest year ever.
20
Apparently, your chart source had something to hide and did a very poor (being generous here) job of graphical presentation. The CO2 plot is in the same place on each chart but the zero for the temperature plot is different for each chart. Without close inspection of the numbers, the visual reference line automatically becomes the CO2 plot. This makes the GISS temperature plot “look” very high. Thereby making it all to easy to agree that 2010 was the hottest year on record. Actually it is, if your records started January 1, 2010.
At the very least, the scale and zero reference for temperature should be the same on all charts. That way it becomes vary easy to see that the GISS data was cooked very differently from the other three charts.
Personally, I don’t believe any of the temperature and CO2 plots are even close to the truth. All the data has been cooked by far too many hands for my taste.
20
The link for RSS chart is wrong. It refers to GISS. The link should correctly be : http://www.junksciencearchive.com/MSU_Temps/RSSglobe.html
Thanks for a good job, Joanne!
10
It isn’t possible to put the zero reference for the four temperature sets in the same place for the simple reason that they use different reference periods to estimate the anomaly from. And it’s not just a matter moving the zero point up our down either, since the reference temperature is different for each month.
The CO2 plot is in the same place since in this case we are dealing with absolute values, not anomalies.
10
Re ABC Drum vote, currently the NO score is 38%. For ABC that’s high? Unfortunately many ABC fans live in a bubble and have no idea that views represented through the ABC channels do not represent the views of the majority of Australians.
10
Apologies, I meant Climate change term is offensive = YES = 38% agree.
10
The MSN UK’s Message Boards have shut down. First it happened in the US now its the UK’s. Is the Green Gestapo finally getting their own way? And to continue their designs of world domination they openly write about? What is happening?
Here’s the link
http://news.uk.msn.com/forum/board.aspx?board=00000071-0329-0000-0000-000000000000
10
One still has to wonder how conclusions that 2010 was so hot can be arrived at given the experiences of weather extremes in the opposite direction. Over vast areas of the NH during the past few years there have been record breaking lower temperatures and record breaking snowfalls for record lengths of time. In places where they have not broken records they have been equal to the previous records. In Australia we have had some very mild summers in most parts, very cool winters and good snowfalls. Looking generally I find the same pattern in S. Africa and S. America. The La Nina is a result of almost record cold water upwelling off S. America. Al Gore has the hide to say his predictions of less snow were wrong because warming increased evaporation which fell as snow. If anyone is a denier then the AGWs are the best at it.
10
By my calculations, the 12 month running mean of UAH anomalies shows October 98 was +0.52, and Oct 2010 was +0.51, so 2010 was cooler than 1998… by 0.01C!
10
tty @ 5,
All four temperature plots span the same time interval and have the same vertical resolution. They are all offsets from some reference value. If the reference value for the computation of the anomaly is different for each, that should have been stated and the comparative offsets indicated on the charts. Even normalizing to their mean values have the same defect as your complaint. If their reference values are different then their means will also be different. The offsets are not given so all one can assume is zero is zero is zero is zero.
Like I say, the chart maker had something to hide. The data is cooked and none of it carries any known or knowable relationship to reality. Especially not one strong enough to justify terminating technological civilization by prohibiting the use of abundant cheap energy from the only sources of them that exist: coal, oil, gas, and nuclear energy. My proposal would simply show that the GISS data set is the most cooked of the bunch.
20
This is re-posted but seems to fit here
“How much has the world cooled since 1998?”
Check the blink comparison at
http://stevengoddard.wordpress.com/2011/03/08/how-much-has-the-world-cooled-since-1998/
10
On the subject of surface stations, at http://data.giss.gov/gistemp/station_data one can click anywhere on a world map and bring up temperature graphs of the surface stations in that area used by NASA’s GISS to help calculate global mean temperature.
For Tasmania it appears that up until 1993 there were 25 stations being used. At the end of 1992 most of those stations were dropped for data gathering purposes, leaving only the ones at Launceston and Hobart Airports for the next six years. This wiped out many rural areas, all our high stations and also those on the colder, more exposed West Coast.
Two coastal stations appear to have been resurrected around 2008 – Eddystone Point on the warmer north-east tip of Tasmania and Cape Bruny on Bruny Island south of Hobart in the D’entrecasteaux Channel. They are probably now automated.
I have no idea why so many stations were dropped all at once, but interestingly, in examining the charts I found that almost all had recorded a sharp drop of between 1.2 to 1.4 degrees Celsius in the four years from 1988 to 1992, which of course would have been a rather uncomfortable fact for those pushing the AGW theory. Without the colder areas and combined with the known UHI effect at airports, Tasmania would presumably have been contributing warmer mean temperatures to the global calculations after 1992.
However, at the risk of being accused of “cherry-picking”, Launceston Airport may still be an inconvenient truth for the AGW lobby, particularly Tasmania’s “catastrophic man-made global warming” alarmists, Christine Milne, Bob Brown and the Greens. The trend line has been remarkably stable and refusing to record any local or global warming in that area. The first recorded annual mean temperature was 12.1 degrees in 1939 and 70 years later in 2009, 11.8 degrees. The 1939 mean temperature has only been exceeded five times in that 70 years and only twice with any significance – by 0.4 of a degree in 1962 and 0.6 in 1988.
A brief look at other parts of Australia show that many stations were dropped after 1992.
It would be interesting to see the results if other posters here checked the stations in their own areas. Any takers?
=================
I have also noticed that the NASA GISS website has 2 data sets for each station. One set is ‘after combining sources at the same location’ and the second set is ‘after homogeneity added’.
The first data set seems to be close to the original raw data but the second data set is their adjustment to the first. In many cases, the second set has the earlier temps decreased so that the warming looks worse than the original data set.
However, sometime in the past month or so, I noticed for many Australian stations the second data set has been changed to reflect the first set.
Try this. De Bilt in Holland is the only station used for that country. Check the ‘adjustment’ from data set 1 to data set 2.
http://data.giss.nasa.gov/cgi-bin/gistemp/gistemp_station.py?id=633062600003&data_set=1&num_neighbors=1
http://data.giss.nasa.gov/cgi-bin/gistemp/gistemp_station.py?id=633062600003&data_set=2&num_neighbors=1
10
Jo Nova,
In your last post you eloquently argue it’s all about the science. Then the very next post you demonstrate that for the Labor/Green coalition it’s about anti-science. It’s about strategically waging a Machiavellian campaign of fear and misinformation on the Australian public for political gain.
The Labor/Green coalition has couched the climate debate in a cynical Orwellian strawman argument. Why? Because they (at least the clever ones, like Combet) no more truly believe in CAGW than we do. That’s why they won’t engage in a rational scientific debate. They know CAGW is indefensible. Ah, but irrational apocalyptic fearmongering, that’s the Green/Labor strong hand.
Labor/Greens McCarthyites ask—
That’s the cleverest smear/fraud campaign in the history of Australian politics. You say we have to fight this on the science. OK, fine. Then Abbott and his mob of cowering wimps better get up to speed on what this debate is really about. They must take back the language by exposing “belief in climate change” for what it really is—a cynical tactic to expand the power of government regulation into every corner of our lives. When an unelected technocracy in Canberra can tax the very air you breath, you are no longer free.
When asked whether you “believe” in the tautology of “climate change.” The answer can only be: “Hang on a minute, are you intentionally degrading the debate into demagoguery to suit your statist political agenda or are you simply ignorant of the scientific basis for the climate debate, yet another pathetically clueless victim of ABC groupthink?”
We all know the question is really—
The hard scientific evidence is profoundly negative. Furthermore, there is no evidence that increasing taxes in order for the Green/Labor coalition to redistribute the wealth to their mates will guarantee fine weather for anyone. However, it will make our grandkids poorer and less autonomous.
It’s like we’re trapped in some absurd upside-down society that Gulliver visited on his travels where the weather has been transformed into a political weapon for bashing your tribe’s enemies.
It’s time for the our loyal opposition to locate their nads and get on with deconstructing the most insidious of the Labor/Green lies in public for all to see and judge.
10
The more they beat the 2010 being the hottest ever drum, the more they undermine their own credibility.
This summer has been unusually cool and EVERYONE has noticed and commented, at least on the eastern side of Australia anyway.
But this is just the way they twist and spin.
The big story used to be the way temperatures have diverged away from tha long-term trend.
Now that that is no longer happening and temperatures are moving back onto the long-term trend line they going with it (the possibly technically correct) hottest ever story.
But even that won’t wash by about 2015, because if previous patterns continue (and I can see no reason why they won’t) that is about when the temperatures will pass back below the long-term trend line. Until about 2030 when they will start to turn up again.
I’m sure these people are intelligent enough to work that out, and that is why the rush is on. Especially because the temperature could pass back through that long-term trend line as early as next year.
Julia has nothing to gain politically by stiring up the voters, trying to drive this tax through right now.If she thought the situation was going to become more definite in terms of AGW she would allow things to spin out until the next election, and then fight the next election campaign on the basis of AGW.
AGW is fast becoming a political liability and the Greens in particular, realise they have to milk it for what they can, while they can.
10
I didn’t bother to vote on whether the term “climate change denier” is offensive because I really don’t care if anyone calls me that. I could only be offended if someone I respect calls me something I object to being called. I still prefer “global warming denier”.
Like almost all these polls, the question is so open to misinterpretation that the results show nothing more than the bias of the person setting the question. ABC groupthink which demonises dissent frightens me a lot more than global warming.
10
OK, so the Kangaroo Man didn’t exactly speak those words, but would anyone be surprised if he did?
http://finance.yahoo.com/news/Chavez-says-capitalism-may-rb-3915449179.html?x=0&.v=1
10
wes george: @13
google ‘Dr Baliunas on weather cooking’
There is nothing new under the sun, it’s all been done before.
The only thing we learn from history is we don’t learn from history.
I guess we should be thankful that the world’s populations are not under ‘real’ climate pressure,
like Europe in the middle ages.
Otherwise the executions would already have begun.
10
They’re hiding the decline. Always have, always will.
Cheers,
Speedy.
10
Well I know 2011 won’t be the hottest year ever. SOI is very positive and the Sun has been in its deepest snooze since the Dalton Minimum.
I wonder how Mr Combet is going to explain his great big tax to fix global warming when the temperature is plummeting.
10
Climate4you have created a comparison of all charts.
http://www.climate4you.com/images/AllCompared%20GlobalMonthlyTempSince1979.gif
10
I wonder if people are aware of how Hansen makes the world look warmer in his graphs:
Go to Nasa’s GISS global surface temperature page:
http://data.giss.nasa.gov/gistemp/maps/
Change the smoothing radius to 250km and click make map. It takes a little while for the map to appear. Note how much of the map is missing data (grey areas) and how little warming there is.
Now go back and do it again except change the smoothing radius to 1200km this time. The red parts (warming) are a result of Hansen’s assumptions & resulting adjustments.
Conclusion: Hansen and the GISS’s surface temperature records are a joke. The GISS satellite record in this article isn’t too far off ridiculous when compared to the other satellite records, even though it’s apparent that the boys at GISS have tried their hardest to make 2010 the hottest year. The main problem with the GISS surface record though, is that their own satellite record disagrees – no wonder they don’t like trumpeting that one around, although it does drive the AGW crowd almost as nuts as the missing hot spot when mentioned in a debate. Try it for yourselves
10
I didn’t vote on “Denier” either. Focus on the facts, and ignore that crap, it takes away from the debate (what little they allow of that).
10
I see Julia referred to the Libs in Parliament as a party led by a “denier.” When Mr Pyne objected to the House saying it had a connotation relating to the Holocaust, needless to say the Labor Speaker hosed it down. Channel 7 this morning (which I don’t watch, but caught that blip while switching channels) covered the incident and none of the presenters thought “denier” had anything to do with the Holocaust and that Pyne was a pratt.
Nothwithstanding that Pyne is a bit of a pratt I think Channel 7 presenters should do a bit of research before putting the entire Jewish population off side:
http://en.wikipedia.org/wiki/Holocaust_denial
Third link off Google Australia when you search “denier.” It’s not that hard really is it? Oh wait this is Channel 7 we are talking about…
10
I just noticed the ABC poll and voted – Yes vote is 40%. How should one interpret such a vote? Surely if only a small fraction of the population finds it offensive it shouldn’t be used? Hopefully this is a sign that they are reacting (at last) to the numerous requests to abolish the offensive term on their web site.
10
It’s still a colder than normal year here. Overnight frost in the middle of March is something I can’t remember ever seeing before. But we had some more frost on Thursday night. I keep hoping someone can tell me where on Earth it’s been so warm as to qualify as the warmest year on record. But no one seems to know. Disaster is upon us and no one knows where it struck.
10
Was 2010 the hottest ever?
No, but Joanne Nova is the hottest skeptic ever! Talk about your beautiful minds…
10
Janama:
I wonder why they’d do that…
You don’t make bad data better by mixing in good data, you make it better by tossing it out and starting again, as in the Berkeley project. That is a pointless graph… it would be equivalent to me averaging orange and apple production in Australia for the last 30 years. Or like the folks who create hockey sticks by mashing all kinds of proxies together…
10
Not sure what you’re bitching about Nova, you are one of the pre-eminent cherry pickers and peddlers of strawmen and snake oil in the business. Not to mention misrepresentation and down right lies (or maybe it is Monckton that does the outright lying), whatever. The horse-do you regurgitate has been debunked for so long and so often it really is tiresome.
10
“No 2010 was not hotter than 1998, not according to the satellites.”
What you don’t mention to your readers is that according to the satellites 1998 was statistically tied for warmest year on record with 1998. So while it’s true it was not hotter than 1998, it was joint warmest. Kind of a big deal considering 2010 is supposedly in a cold negative PDO and deep solar minimum.
You also wrongly claim that GISTEMP has 2010 as warmest year on record. Actually like the satellite record GISTEMP has 2010 tied warmest with another year – in this case 2005.
And remember folks, this warmth in 2010 is despite the negative PDO, deep solar minimum and weaker El Nino. Taking all that into account 2010 should not have tied with 1998, it should have been much cooler.
Obviously there is a warming effect in play that has offset all of the expected cooling. Wonder what that might be…*cough* co2
thxbye
10
Jo:
Erm, you can’t actually say that.
Yes, 2010 was not hotter than 1998, according to the satellites. But then it is a logical inconsistency to then compare 2010 with the Holocene in the same paragraph, because there were no satellites during the Holocene.
Leave no gaps in the armour …
10
July:
Like baseless trolling much?
10
July: #26
Ah, you’ll be here for the horse-do then?
10
Could the MSM become any more moronic? Here’s the latest Michelle Grattan idiocy:
“TONY Abbott will risk being linked to prominent climate deniers …”
Source: http://www.theage.com.au/national/labor-tries-to-tie-abbott-to-deniers-20110322-1c56l.html
“Climate deniers” … we are denying climate exists now? The MSM is in terminal decline if this is the level they are pitching at … an IQ of a moron?
If you have the stomach you can read the rest of the article, but realise the “D” word is now accepted by the Labor party as the preferred way to address sceptics. And there I thought it would be difficult for the debate to sink any lower…
10
lolwot: #27
OMG, lolwot has proven that 1998 actually equalled …… itself.
Must be a journalism major.
10
The Australian reports that the Labor Party is now labelled all carbon tax protesters as extremeists:
http://www.theaustralian.com.au/national-affairs/climate/carbon-tax-protesters-labelled-extremists-as-they-rally-in-canberra/story-e6frg6xf-1226026565064
Labor is showing its disdain for anyone who does not show deference to their new carbon tax overlords. The problem is that this kind of rhetoric is going to piss off the middle ground voters. This kind of language will backfire.
10
Surely the more important issue is the heat content of the oceans where more than 95% of the heat resides. The atmosphere above can flip-flop around with the solar cycle, cosmic rays, and out-gassing from of passé politicians but that can change rapidly from one year to the next.
The UN must love it when good sites such as this get diverted into largely meaningless discussions about the four data-bases of air temperature without linking it with the ocean capacity.
This would be a good topic for them to divert a few sock-puppets to, even ‘friendly’ ones fuelling discussion.
“July” @ 26
Please supply direct examples to go with your negative remarks.
10
Does anybody else suspect that “July” is a reference to the time the Greens take over the senate, the government +/- a carbon tax will go into legislative constipation mode & the “anarcho-syndicalist-communists”(apologies to Monty Python if I got that wrong) will take over?
10
Bulldust #25
‘Nuther hopeful sign at our bigger national broadcaster – the coverage of the anti-tax demo in Canberra was handled pretty evenly in the lunchtime news, and they crossed live to Tony Abbott when he addressed to crowd. Maybe the ABC is starting to get the message, which is 50% plus 1 vote is required to fund their budget.
10
Roy @ 23,
Here in Oz (i assume you are here)was the coldest since 2001, the point you are missing is that whilst it may have been cold where you were it was really hot somewhere else, now shut up and pay your TAX or AGW is gunna gitcha.
Gator, could not agree more.
John….sorry July where is this debunking you speak of? Please explain to me how GISS can adjust the temps from over 50 years ago to a lower value, on what scientific basis could this action be justified? I know you cannot justify such actions because like all religions they are founded on faith not facts. So crawl back into that stinking hole of yours and never return.
10
Quick reply to Lionell Griffith:
Your points about scale are well-made, which is why the embedding pages bear this:
Additionally the temperature time series page has a section A Word On Scale specifically advising casual viewers to be aware of scare distortion.
Further, the time series page features sections on each of the major series with links to original source material and notes on anomaly reference periods. We don’t adjust the data, merely graph it as provided. The CO2 series are included because William Connolley complained about their absence when we first established the page, the scaling is explained in the special note on scaling. Not sure what else you think would be appropriate but
is somewhat less than generous, don’t you think?
Regards
Barry Hearn
Editor, JunkScience.com
10
pattoh:
Could be Pattoh … of course that implies the assumption there isn’t an election before then.
10
Bulldust
My feeling is that the legislative constipation will bring about a federal election around the first quarter of next year.
With Windsor sipping the poison chalice of the MDB & the other power intoxicated indis away with the pixies it would only take an errant bus to bring about a “Senator Fields” like scenario.
Heres hoping!
I am looking foward to an update on the BoM/CSIRO data audit request.
10
Every data graph you showed gives a clear warming trend.
10
Am I right to have the impression that these AGW guys are getting very desperate in Australia? Reading some of the comments on Andrew Bolt’s site –so many of them are in the same tone and useless content as July @ 29. I also note that in recent days they have “all been out in force” where normally you get a few each day. All I can think of is panic ( on their part)
10
Bulldust ((N0 34) Michelle au Gratton should have retired years ago. Why would anyone care what she writes?
10
One thing is for sure – if I was trading that uptrend I’d be pulling my cash off the table about now.
10
There will not be an election until we are due one, The one who lies will continue to lead a merry dance until the green tax demands can be voted through both houses. The useless independants may kick up a stink but by then they would have already destroyed their own political futures (siding with labor to begin with), so as they say in for a penny, in for a pound and there is nothing a bit of pork barrelling cant fix.
Its time face facts we will get this useless tax, the only thing that will stop it is a labor MP crossing the floor or a revolution i prefer the latter but we shall see.
10
That’s a really good point brc, I often think of that analogy when I hear people bang on about how the climate is cooling when it is so bloody obviously in an uptrend and has been for years. Only data point cherry picking would alter that trend. I pity anyone who traded shares on that basis, selling in a steady up trend. I doubt even a day trader would be quitting this trend yet.
Still, never underestimate the stupidity of the redneck brigade.
10
I agree crakar24#46.
Nothing much is going to change soon.
The only hope for some change is a massive advertising campaign by a cashed up corporation that percieves their future at risk.
We will get a carbon tax.
10
July – in your haste to build upon your confirmation bias and find someone who agreed with your rantings you didn’t even read my comment.
I said I would be selling because the uptrend is dead. An uptrend is a series of higher highs and higher lows. That no longer fits the pattern. So I would sell out.
Now I’m not trying to say temperatures move like share charts, what I’m trying to say is that the uptrend has finished or paused at the least.
And thanks for insulting me and calling me a redneck, you comprehensionally challenged co2 phobic halfwit. I never overestimate the intelligence of trolls.
10
I wonder if there is any surprise in the temps recovering somewhat from the little ice age, you know the one they try to eliminate with”corrections”? the fact is it is still cooler than the 2 warm times in the last 2000 years , go see if the roman vinyards are growing grapes in northern England? go look at the Viking farms under the glacier. Thankfully those things a a little hard to “correct” also if you delete a couple of hundred thrmometers from Canadas permafrost you up the average, why else do it? The graphs shown hide nothing except some “corrections” on the land based ones.
Anyone who thinks it is getting warmer (hotter get a life!) must be simple, there has been historic ice in the northern hemisphere and snow in places worldwide where it is rare, 2 years running there have been devastation of hardy livestock in parts of asia at least, grain harvest?? there is only corrupt data showing it warmer, the reality on the ground says cooler.
10
Lional in 3,
This what is said at the bottom of all charts
“Note: These script-generated graphs are auto-scaled by default. Users must be aware that scales vary such that the Y1-values virtually fill the plot area and that this might (probably will) distort the impression gained from casual perusal.”
Does this answer your question?
BRC
“comprehensionally challenged co2 phobic halfwit” this has made my day :-))))
10
@ July 29 and 49
Look, I know you are dying for some attention but you won’t get any unless you post an intelligent comment.
10
I’m going to go on a guess that Lionel Griffith didn’t click the link to the source site, for if he did he might have noticed this right underneath the graph:
So the point that the chart maker is “trying to hide something” is false.
Also there is the Source page on the JunkScience site that gives links back to where data is taken from:
http://www.junksciencearchive.com/MSU_Temps/Sources.html
Also anyone that has been seriously following the AGW debate should by now know the base periods each group prefers:
GISS: 1951-80
HadCRUT3: 1961-90
UAH: formerly 81-2000 now 81-2010
RSS: formerly 81-2000 now 81-2010
You can find those out from each datasets own sites.
Also Jo missed one of the main datasets/analysis (Yes there is 5 not 4): NCDC. NCDC uses a Base period of 1901-2000 for their anomaly dataset analysis and the 1971-2000 base period for their gridded global analysis.
If anyone wants to run a comparison of each dataset on the same base line it is not that hard to do. First download the LOTI dataset from GISS, the Annual Anomaly dataset from NCDC, The HadCRUT 3 dataset from either CRU or the UK Met office, the UAH dataset from UAH and the RSS dataset from RSS (Basically copy and paste into a word processing program and save). Once you do that just copy the annual anomalies from GISS, NCDC and CRU into a spreadsheet program. Now convert the anomalies back into absolute temps by adding in the number 14 to the anomalies for GISS and CRU and add in 13.9 to the ones from NCDC (You can find these numbers by digging through each of their websites, GISS is easiest to find, CRU hardest). Once you do that you need to set them to the new baseline of 1981-2010 by adding those 30 years together and dividing by 30, do each dataset one at time. Once that is done subtract that average, for each dataset, from every temp in the entire dataset. Repeat this for the other two datasets. That now gives you the three surface datasets in anomaly fashion on the Satellite base period.
Now for the two Satellite sets they give monthly anomalies but not an annual one, so you have to figure those out. First pick either RSS or UAH and average the anomaly for each year (add the 12 months of 1980 together and then divide by 12, repeat for every year). Once you got that done repeat for the other satellite dataset. When both UAH and RSS are done you now have all 5 datasets with annual anomalies on the 1981-2010 baseline and you can use your spreadsheets graph function and there you go: A graph with all 5 on the same graph, with the same baseline. You can compute linear trends and compare them to each other.
10
Jo, the best chart I’ve seen you post, in my humble opinion, is the one that showed the temperatures for the Holocene interglacial. The graph showed the average temperature peaking in the Bronze age and it has been downhill since then. If CO2 is such a dominant forcing, shouldn’t temperatures be higher now then they were earlier in this current interglacial since CO2 levels are the highest they have ever been during this interglacial? Every time I ask a warmist this question all I get in response is the deer in the headlights look followed by a segue into sophistry.
Another thing that irks me is the faith that the catastrophists place in the work of Jimmy “The Fudger” Hansen. The guy has adjusted his numbers so many times it resembles a modern rendition of the Boy Who Cried Wolf. If you look at rural temps in the U.S. where there has been no UHIE, the amount of temperature increase has been almost indiscernible. You look at Jimbo’s numbers and not only are they often being ‘adjusted” but almost always in a way to show cooling in the past years and warming in recent years. How do you spell fraud? J-A-M-E-S H-A-N-S-E-N, of course! The GISS temp records will be used someday in a criminal justice course on history’s greatest swindles.
10
“If CO2 is such a dominant forcing, shouldn’t temperatures be higher now then they were earlier in this current interglacial since CO2 levels are the highest they have ever been during this interglacial? ”
I guess you only know dumb people Eddy:)
CO2 is a forcing. Current science tells us how it will likely impact the planet if we keep increasing it as we do. This of course has nothing to do with why things may or may not have been warmer in the past at which time any number of other reasons for temps to have been higher may have existed. My quick research suggests to me that the warm period to which you refer is a reasonably well understood result of the Milankovitch cycle.
10
It was nice to catch up with Jo, David, Matt, Janet, Anne-Kit and a few others at Parliament House. There were a couple token media reps and one token pro-AGW heckler who refused to be polite throughout all the talks. Eventually he left on his bike, not having made one serious comment, let alone anything bordering on polite.
July you will be happy to know that Dr David Evans is quite capable of giving a flowing speech which seems to run counter to your accusation the other day … but then that is hardly surprising. He has a handful (+1) degrees and you are an anonymous troll.*
All in all they were pointed presentations, but it seems inevitable that there will be no balanced coverage in the MSM. No doubt they shall focus on the pro rally instead.
* It is rare that I pull out such a tag for anyone, but when you make no points whatsoever with respect to the science or economics, and continue to make baseless claims and insults, then troll is the appropriate tag.
10
60% now voting “denier” of “climate change” not offensive. it would be hilarious if it weren’t so tragic for the future of science.
never watch the commercial tv stations (or almost never) but was watching a comedy on one of Seven’s stations last nite when a news update came on about the controversy over “climate change doubters” being called “climate change deniers”. are only idiots employed by the MSM? no need to respond.
as for the anti-carbon tax protests, why were they organised for mid-morning, mid-week?
also, how to protests when…
23 March: Australian: ‘Puppet’ PM the target of tax protesters labelled extremists by the government
UPDATED Ben Packham and Lauren Wilson
Trade unions today got in ahead of the anti-carbon tax activists, delivering a supportive petition to Climate Change Minister Greg Combet in Canberra this morning…
http://www.theaustralian.com.au/national-affairs/climate/carbon-tax-protesters-labelled-extremists-as-they-rally-in-canberra/story-e6frg6xf-1226026721285
union members should refuse to pay their dues. why don’t they get it?
Feb: UK Telegraph: James Delingpole: The real cost of ‘global warming’
For every one of David Cameron’s “green jobs” created in the renewable energy sector (mainly solar and wind), another 3.7 jobs are being lost in the real economy, says the independent study by Verso Economics…
http://blogs.telegraph.co.uk/news/jamesdelingpole/100078040/the-real-cost-of-global-warming/
10
i gather our PM visited a wind farm during the Canberra protest!
22 March: UK Register: Andrew Orlowski: WRONG kind of WIND blamed for renewable red-ink FAIL
It doesn’t blow, it sucks
Windfarm operator the Renewable Energy Generation Group has blamed “abnormally low wind speeds” across the UK for greater-than-expected losses…
Despite the bullish statements, the wind industry remains vulnerable on Government kindness, in the shape of feed-in tariffs (FITs)…
The current UK FIT schedule – introduced in 2009 – sees solar, not wind, as the most-specially-favoured: with 43.3p per kWh guaranteed (for retrofitted small installations). But wind isn’t far behind at 36.2 per kWh for small installations and 28p for larger ones. These are the highest in the EU, nine times higher than Denmark. The wholesale spot market only very rarely exceeds such numbers, meaning that for most of the time consumers pay more than they should.
This generosity can’t go on forever. All across the EU, subsidies and sweeteners are being pulled. Germany, Spain, France, Slovakia and the Czech Republic have scaled back their FITs. Last month, the government indicated that it would too, announcing a review of solar FITs for large solar installations (large is relative here, meaning greater than 50kWh). Two major investors that favoured solar have pulled out of the market: Ingenious Media and Matrix.
“Suddenly the rug has been pulled,” observed CEO of eco-energy Good Energy Group plc…
http://www.theregister.co.uk/2011/03/22/wind_abnormal_fail/
10
Pat – mid morning mid-week means you get the news coverage at 6pm prime time.
10
MattB’
Just in case Eddy is too busy to respond can i ask you a question?
Ed claims the temps were higher during the Bronze age when CO2 was lower and asks how can this be so.
You respond with the obligatory insult and then a statement that CO2 is a forcing which of course simply makes Ed’s question even more respectful.
You then say it could have been caused by a number of reasons (and by inference they are not applicable now) and you then claim it is all due to Malkovitch cycles.
OK lets take a closer look if CO2 was lower but the temps were higher that would mean the Earth must have been closer to the sun….yes? I am no expert on M cycles but i think the Earth goes from a circular to an elliptic orbit, we are currently in a circular orbit. Now the bronze age was approx 5,000 to 5,800 and i dont think the orbit would have changed that much in such a short time and lets not forget the temp must have dropped significantly if we factor in the rapid recent warming from CO2.
In short MattB would you care to take another guess at the answer to Ed’s question?
10
@ mattB 57
Matt, it is always good to see you post. Judging by your comments I see you must have run out of smart pills. I wish I could email you a shoe horn so you could dislodge your foot from your mouth. What part of the Milankovitch Cycle caused us to start to transit out of the Pleistocene prior to the dive back into the bone chilling cold period known as the Younger Dryas? Was it the tilt, wobble or obliquity? You mentioned other reasons, what are they? Are you saying there are a lot of things we don’t know about the climate? There are obviously a lot of other factors influencing climate or we wouldn’t see such wide temperature variations (e.g. the LIA and MWP) as we have seen during the current interglacial. If there were no other forcings to account for the warm and cold periods, why isn’t CO2 making it warmer today than at any other period during the current interglacial? If the AGW hypothesis is correct, then either it was warmer during the Holocene Maximum because of forcings other than CO2 or there are forcings keeping it cooler now than what it should be with the amount of CO2 in the atmosphere. I am waiting with bated breath for your “logical” explanation.
Actually, Matt, I was referring to the warmists I know so your statement has some validity! 😉
10
@ Crackar24
Thanks Bro. If i fall asleep before MattB posts a reply after finishing his diligent research (for which he is a legend) then, if you are still on the site, please feel free to put his feet to the fire. Thank you in advance!
10
Garnaut has found the taxation magic pudding! Now the “carbon tax” is going to generate $30 billion over 10 years for renewable technology research development – line up all ye rent seekers:
http://www.theaustralian.com.au/national-affairs/climate/garnaut-calls-for-30bn-of-taxpayers-money-to-be-spent-on-green-technology/story-e6frg6xf-1226026802947
No doubt this comes as a blow for the BZE crowd who wanted $37 billion PER YEAR for ten years. Sucks to be them…
It is simply amazing how the carbon tax is going to:
1) protect jobs by giving free permits to EITE industries;
2) make low income earners and pensioners as good or better off through tax cuts and pension increases; and
3) find $2-3 billion per year for renewables research and development.
This tax is truly the gift that keeps on giving … a veritable economic perpetual motion machine. Garnaut should patent the idea and sell the rights to the rest of the world.
10
Bulldust,
At first i thought the lack of detail forthcoming about this TAX was because what the Greens had in plan for us would scare the shit out of the most brave. However the more i see in the drips and drabs that they let slip the more i realise there is no detail. Remember the one that cant be trusted said she wanted community consensus before she would act….well this is how she is getting it. She tells us all she wants a TAX then lets us bitch and squabble amongst ourselves about what the detail might be so she can form a policy that is most popular.
Earlier on i said we will get a TAX unless we revolt but maybe i was wrong, the liar has so far made many consessions, firstly the poor and pensioners will get a rebate now we are all getting a TAX cut (well maybe not all) so now it is a tax reform. They may even cut fuel excise and reimburse big emmitters, the point is the more consessions the liar makes the less chance she has of keeping the greens on side which is good news for us.
10
Vote here on the carbon tax guys; and apologies if anyone else has put it up:
http://ninemsn.com.au/
10
desperation on the cusp of madness?
http://blogs.news.com.au/heraldsun/andrewbolt/index.php/heraldsun/comments/labor_goes_the_giant_sneer/
10
Just voted Cohenite
14543 Yes
72618 No
Pretty conclusive i would say
10
@ MattB
Hey MattB, since you are such a big fan of wikipedia I thought you might appreciate the following.
From http://en.wikipedia.org/wiki/Pleistocene
It would appear that you “quick research” was a lumpen query!
10
Crakar: 1st up I am well aware when I said “dumb people” I was referring to Eddy’s warmist mates. Is making fun of Eddy’s mates ,who he clearly thinks are a bit dim himself since “all I get in response is the deer in the headlights look followed by a segue into sophistry”, an ad hom? Not so sure.
you are referring to only one component of the cycles being the eliptical nature of the orbit of the sun. Axial tilt, precession, and so on. http://en.wikipedia.org/wiki/Milankovitch_cycles
excuse wiki but convienient on web – suggest if you want a better source you do some research.
Again from Wiki on the holocene optimum: “The effect would have had maximum Northern Hemisphere heating 9,000 years ago when axial tilt was 24° and nearest approach to the Sun (perihelion) was during boreal summer. The calculated Milankovitch forcing would have provided 8% more solar radiation (+40W/m²) to the Northern Hemisphere in summer, tending to cause greater heating at that time. There does seem to have been the predicted southward shift in the global band of thunderstorms called the Intertropical convergence zone.
However, orbital forcing would predict maximum climate response several thousand years earlier than those observed in the Northern Hemisphere. This delay may be a result of the continuing changes in climate as the Earth emerged from the last glacial period and related to ice feedbacks. It should also be noted that different sites often show climate changes at somewhat different times and lasting for different durations. At some locations, climate changes associated with this event may have begun as early as 11,000 years ago, or persisted until 4,000 years before present. As noted above, the warmest interval in the far south significantly preceded warming in the North.”
Conveniently for Eddie there is also a nice little piece on the causes of the LIA: http://en.wikipedia.org/wiki/Little_Ice_Age#Causes
10
Just a heads-up, not sure if this was posted in the other thread, but the Sunday Times PerthNow website has a poll asking if we ought to develop the waterfront with a loaded question:
“Should we rethink beach front development plans over fears for rising sea levels?”
Pop in and cast your vote, http://www.perthnow.com.au/.
10
Sledgo – indeed what an absurd poll. Only the third option makes sense in terms of well if I agreed I’d vote for it. I think we should develop there and just plan (as they have) for potential sea level rises… there is no box for me! I can only answer “yes develop there” if I agree that the science may change! truly mind bogglingly appalling poll.
10
If CO2 follows a warming period does that mean that CO2 cools things down?
10
no
10
Poll on http://ninemsn.com.au/
Do You Support the Carbon (DIOXIDE) Tax ?
Results as at 23/03/2011 17:15 :-
yes 15135
NO 75395
10
@ MattB 71
Your link on the LIA mentioned the year without a summer and Tambora in discussing the potential effect of volcanic activity. The effects of the biggest volcanic blast in 16 centuries only effected climate for a few years. The effects of volcanism are minimal unless there is a massive amount of activity, which there wasn’t. With the exception of Tambora, there was nothing unusual about the volcanism of the LIA. Take the recent eruptions of Mount St. Helens or Pinatubo. The effect on temperatures were miniscule. The link also mentioned the thermohaline circulation. That hypothesis has been thoroughly debunked. See http://www.eeescience.utoledo.edu/Faculty/Fisher/Lowell_etal_EOS05.pdf and http://www.sciencedaily.com/releases/2005/04/050428180401.htm.
But what was really telling was the section on the ‘inherent variability of climate”.
You should read before you cut and paste, Matt! As far as the rest of your post, you must have hit the “submit comment” button before you read my post at 70 or you wouldn’t have embarrassed yourself with such a contradictory post.
10
Completely off topic for this thread but good reading
http://www.spiegel.de/international/germany/0,1518,751469,00.html
10
Hey MattB, while you are at it, please address my questions at #63. Also, how do you explain the Younger Dryas and the suddenness of the temperature change? Especially as the Younger Dryas occurred ca. 12.9–11.6 ka which was fairly close in time to ” 9,000 years ago when axial tilt was 24° and nearest approach to the Sun (perihelion) was during boreal summer.” The climate is a chaotic and non linear system. I am waiting to see the usual “MattB shuffle”!
10
@MattB (post 73) Yes, keep your head buried in the sand. The fact is that sea levels are NOT rising, despite what all the chicken littles keep telling you. If the sea levels are indeed rising, why hasn’t the poster-boy of the AGW camp, the “manbearpig” himself sold his coastal properties? Answer, he knows it’s a scam, and is just manipulating the property market with scare tactics to snap up some nice coastal property bargains.
All the research I’m aware of state there aren’t any significant levels of rise. There is no reason NOT to develop along the coast, in fact, if these idiots want to scare people to sell their beachfront properties at a loss, I’d be more than happy to snap up some bargains myself!
10
Eddy our posts were submitted the same minute as eachother, so clearly I was typing before you’d even submitted 70. I’m afraid none of your extensions and rants about other eras have any relevance to the 1st comment, you can;t just saying “Look over there, a bear!” while you shift the goalposts.
Your post in 63? was there a question there? Lost in incoherent rambling sorry Eddy… you’re out of practice mate, lost your touch.
10
Sledgo FFS I was agreeing with you about the poll. Clearly I know you don;t agree with my particular reasons, but you know what, who gives a rats clacker – no reason for you to spout of endlessly on some rambling dribble.
10
Eddy – the earth’s history is long… every time I give you an easily accessible answer are you just going to throw a dart at the timeline and say “what about this matt what about this!” It’s a recurring timewaster.
10
From my post at 63. I highlighted the question marks for you.
And don’t forget my question at 79
Yep, the MattB shuffle!
10
The Adelaide protest was successful despite the inclement weather, with over 100 people turning up at Parliament House to listen to a number of speakers while standing in the rain. At the start a local entertainer sang the Beatle’s “Taxman” much to the enjoyment of us all. I’d say most of the crowd remembered when that song first came out although there was a smattering of younger people there.
Not a Greenie to be seen and the whole thing went off smoothly. Come to think of it I didn’t see any police there either but I guess they were nearby “just in case”. Channel 10 turned up and maybe another TV station and The Advertiser photographer got us all on the steps for a group photo and he managed to get us to be rowdy for that shot.
10
Bit of debate on the younger dryas: http://news.discovery.com/earth/why-the-younger-dryas-matters.html
The end of the Pleistocene – shrouded in some mystery.
next?
So Eddy, why do you think these events happened?
10
@MattB No need to cuss, mate. I know you’re a warmist, and you chose option 3 to not develop, just as well, but a bunch of people were clicking option 1, “yes, sea levels are rising”, yet the sensible answer ought to be 2, as anyone who’s opened their eyes to the truth would do.
I’m not waxing lyrical about what has been posted umpteen times in this blog, let alone the hundreds of responses you have had to a lot of your comments, yet you are unable to see past your own warmist bias to look at the facts. Why did you choose option 3? I can justify my reason for choosing the “no” answer, can you?
10
Since you are feigning obtuseness, again i will connect the dots for you!
me at 56
J
you at 57
My post at 70 showed that the Milankovitch cycles, according to your beloved Wikipedia, have an effect more on the ice age and not the interglacial. It was also pointed out to you at 79 that the Younger Dryas and the maximum effect of the Milankovitch cycle (quoted from your cut and paste) were very close in time.
Then my questions at 63 reiterated at 84. Of course, you evaded and didn’t answer them because you can’t. You can’t because it is illogical for temperatures to be higher when CO2 levels were lower, absent other forcings, which have been debunked (i.e. your LIA wikipedia link I demolished at 77).
so, Matt, are you going to answer the questions (see #84)?
10
MattB:
March 23rd, 2011 at 5:15 pm
Great question, Matt! Nobody knows! And thats the point! The Younger Dryas was a few thousand years prior to the Milankovitch Cycle’s maximum effect (your quote from Wikipedia) and yet the temperatures plunged. The MWP was followed by the LIA and CO2 levels were fairly consistent. Which still begs the question, absent other forcings, why isn’t it warmer now then during the holocene maximum during the Bronze age if CO2 is a dominant and powerful forcing?
10
Sledgo – I am very familiar with the Perth Waterfront project and I voted 2 – that they should develop, but my reasons are not that water level will not rise, rather that the state govt has (as you’d expect) designed it to cope with rises.
10
“Which still begs the question, absent other forcings, why isn’t it warmer now then during the holocene maximum during the Bronze age if CO2 is a dominant and powerful forcing?”
Milankovich cycles:)
See after all your fluster and bluster we are back at the start. Where will you point now?
10
Officer – do you know why a ford Anglia crashed in 1979 in Suffolk UK? No, then how do you know that I crashed because I was drunk and speeding!!!
10
Matt you are still a greased weasel. The fact is there are no other forcings at work. It was warmer during the holocene maximum and CO2 levels were lower than today’s. There were no other forcings to account for the fact it was 4 to 5 degrees warmer than it is today. Unless you can come up with something, and you haven’t, to explain it then your cherished CAGW theory is falsified or is the simple logic too difficult for you to grasp? No matter, anyone with a double digit IQ who follows this thread will see the truth.
10
Officer, did you see how I demolished Matt’s feeble arguments to which he had no response? Still, Matt thinks it is safe to play on the freeway and wonders why the vessel of facts, common sense and logic have run him down!
10
Your cut and paste brain dead zombie BS arguments have been eviscerated. And yet you stand there wondering what happened and making idiotic false analogies like the one at 92!
10
The poll at 1740 EDST is running at 85220 to 17260 which shows a trend of approx 10,000 no votes for every 2,000 yes.
10
“It was warmer during the holocene maximum and CO2 levels were lower than today’s. There were no other forcings to account for the fact it was 4 to 5 degrees warmer than it is today.”
There must be something Eddy, or do you vote “magic”
10
Matt from your link at 86 regarding the Younger Dryas
One more time Matt, the Atlantic Conveyor is a myth, BS, poppycock! Reposted from 77. http://www.eeescience.utoledo.edu/Faculty/Fisher/Lowell_etal_EOS05.pdf and http://www.sciencedaily.com/releases/2005/04/050428180401.htm. Read the links this time before you embarrass yourself with another “cut and paste” run!
10
Also Eddy, if you look at what we know of the Holocene maximum you’ll find it was nowhere neare 4-5 degrees warmer than today globally. I’ve already given you the wiki reference.
Youre reply in 63 says nothing to counter my claims. Other than point to other unrelated cliamte events. You specifically asked about the holocene and got a clear answer. The answer no less.
10
MattB:
March 23rd, 2011 at 5:43 pm
Glad to see that your two watt brain is beginning to throw some illumination. If you can’t do better than that why don’t you quit embarrassing yourself? What were the other forcings that caused the temp to be 4 to 5 degrees warmer? Put up or shut up! If you and the climate scientists can’t explain it then your CAGW theory is falsified or are you too ignorant to realize that? Do you need me to explain it to you like a child?
10
Eddy – for your benefit I will quote my answer in 98 about which you make an absurd reply in 99.
I said “Bit of debate on the younger dryas: http://news.discovery.com/earth/why-the-younger-dryas-matters.html”
I’ll highlight the key bit
“A BIT OF DEBATE ON THE YOUNGER DRYAS”
I thought my link explains there is some debate, and also the Nature article linked to is more recent that your links, so nothing there changes that there is some debate.
10
Eddy in the bradman – It was not 4-5 degrees warmer, globally,
10
“If you and the climate scientists can’t explain it then your CAGW theory is falsified”
untrue. False leap of logic.
10
Hey Eddy, I’ve found you a reputable reference. (BTW you accuse me of cut and paste jobs but when have you ever believed anything I type myself I’d have thought you’d like references).
http://www.ncdc.noaa.gov/paleo/globalwarming/holocene.html
I quote, with pleasure:
“In summary, the mid-Holocene, roughly 6,000 years ago, was generally warmer than today, but only in summer and only in the northern hemisphere. More over, we clearly know the cause of this natural warming, and know without doubt that this proven “astronomical” climate forcing mechanism cannot be responsible for the warming over the last 100 years. “
10
@ MattB
http://www.nipccreport.org/articles/2010/sep/29sep2010a2.html
10
@ MattB
Here is the grapph they used. http://www.ncdc.noaa.gov/paleo/globalwarming/images/polarbigb.gif
Hmmm.2 to 4 degrees celsius? Looks pretty close to 4 to 5 degrees, Matt!
10
one degree celsius equals 1.8 degrees fahrenheit! 2 to 4 C is 3.6 to 7.2 degrees F! Why don’t you average the graph and determine the average, Matt!
10
at least you got beyond wikipedia, a site known for bias!
10
A killer blow to AGW; if someone was writing a paper reviewing recent peer reviewed papers which profoundly contradict AGW, this paper would make a good addendum 🙂
http://www.climatesciencerevealed.com/www.climatesciencerevealed.com/Home.html
10
Include the 1940’s in those plots and the CO2 series becomes meaningless.
Then include IPCC GCM hindcasts and the basis for a carbon tax is exposed as bogus.
Then include the IPCC predictions and the AGW hypothesis is nullified.
Handy plots.
10
Eddy 105: lol you giggle at Wikipedia as biased, but have the audacity to link to NIPCC!!! Funny guy. Sorry no way from that link for me to wonder how they came up with that number.
Eddy 106: That is the northern hemisphere polar region… not the globe. The NCDC link covers that, maybe you should read it.
Eddy 107: oh sorry you are using F are you:) lol. Good wriggle, but still read above.
Eddy 108. NIPCC lol thanks for the repeat laugh – funnier than my Charlie Sheen gag!
10
A turnout of over one hundred in Brisbane. A warmunist started heckling a speaker and the crowd shouted him down and he quickly left!
There was no march to Parliament House, though.
I was one of the speakers and it was an honour.
The big one in Brisbane will be in May, can’t believe Labor called people who normally go about their lives but are so insensed about this tax with no mandate to protest, “extremists”.
I suppose the left are only allowed to protest. Funny that.
10
Cohenite 109 – how is a link to a pay-content site, with some reference to a movie starring our Jo and The good lord (Sounds like it is a Nicole Kidman/Hugh Jackman Australia type flick) a killer blow to AGW? Where’s the paper?
10
Hey Matt, even if we were to use your numbers where is the evidence for the forcings to account for the higher temperatures?
So, Matt, you don’t like the NIPCC? Well, at least they quote papers like Briner et al! The IPCC quotes backpacker magazines and 30 % of their crap is non peer reviewed. As usual, you segue into your usual half witted jokes.
10
You never did answer my question or Crackar’s either. You are nothing but a joke and the site idiot.
Good night all!
10
Eddy the NIPCC uses a study on Baffin Island, which may well say that Baffin Island was warmer, and NIPCC use it as though it proves the world was all that much warmer. I highly doubt that Briner et al says anything about global, and in terms of the title of the Briner et al work (ie Baffin Island in the Arctic) then it is TOTALLY CONSISTENT with my link to NOAA, in that the arctic was 4C warmer there or thereabouts… Wow you’ve really lost this debate today Eddy. Not that it debunks opposition to AGW… just your specific opposition.
Your question was answered BTW, you just don;t like the answer, and Crackars post demonstrably did not comprehend the varying Milankovitch cycles. He/she didn’t even pose a question other than to say I should have another go at yours as he/she had demonstrated I was wrong – but I’ve shown that Crackar had no clue so back at square 1.
10
OK lets vote who here thinks that Briner et al as per the NIPCC link Eddy provided is evidence that the globe was 4 deg C warmer in the Holicene Optimum?
Or is it just Baffin Island… consistent with the NOAA site I linked to.
10
Btw, a silly little spat has broken out over whether or not human CO2 emissions are 30% or 3% of the total. Anyone with half a brain could see that Alan Jones muddled the TOTAL AIR percentage of manmade CO2 (0.001%) with the total amount of manmade CO2 (3%). The 3% being the amount ‘in flux’ that is not absorbed by ecosystems.
How these scientists have come up with this new 30% is beyond me (I’ll leave that for others). But, judging from recent warmist blogs I thought the 3% was pretty much accepted by both camps, and was only a side issue to what was being argued.
Please enlighten me. Where has this 30% figure come from?
The warmist blog:
“Although our CO2 emissions are only a small part (about 3%) of the total flow into the atmosphere, they account for all of the excess. And that excess has accumulated, so that since the start of the industrial revolution the CO2 concentration in the air has risen from about 280, to about 390, ppmv.
Dishonor among deniers
http://tamino.wordpress.com/2011/03/11/dishonor-among-deniers/
The Media Watch episode that started the spat:
“That’s one of Australia’s highest rating radio hosts with a very odd figure. The fact is that almost 30% of the carbon dioxide in the air is there because of human activity in the past two hundred years – and that’s thirty thousand times more than Alan Jones’s point 001%”
AND
“Perth’s 6PR – Drive host Howard Sattler. He likes a bit of maths too.
Howard Sattler: 0.038% as a fraction of what is in the atmosphere – that’s CO2 – that’s the carbon we’re talking about – 1/27th of 1%.
— 6PR Perth, Drive with Howard Sattler,14th March, 2011
All of them, naturally, are vehemently opposed to the government’s proposed carbon price – although few are quite so vehement as 2GB’s Chris Smith, who seems intent on personally leading the people’s revolt.” – Jonathan Holmes, Media Watch
Media Watch/ Balancing a hot debate
http://www.abc.net.au/mediawatch/transcripts/s3169309.htm
The Spat:
Humans account for 30pc of CO2, say scientists
http://www.theaustralian.com.au/news/nation/humans-account-for-30pc-of-co2-say-scientists/story-e6frg6nf-1226026367172
Activist group take on Jones over climate
http://www.news.com.au/breaking-news/activist-group-take-on-jones-over-climate/story-e6frfku0-1226026491393
10
MattB; just seeing if you were awake; try this:
http://www.jcronline.org.pinnacle.allenpress.com/doi/pdf/10.2112/JCOASTRES-D-10-00157.1
10
But the cat’s out of the bag on the Jo Nova movie:)
FYI Jo Angry Anderson was in Mad Max 3 so is used to working in the outback.
10
A nice paper that. I expect NIPCC to use an obscure quote in it to indeed say the nail is in the coffin:)
10
But the cat’s out of the bag on the Jo Nova movie:)
So, donate.
10
D R E A M I N G
10
@ Vincent 8:
No conspiracy theories please. Aside from personally hating them, I have inside knowledge that NineMSN is undertaking a massive investment in another part of the web. Ergo, they’re probably abandoning their website focus for this new project. Can’t say more.
10
A nice paper that. I expect NIPCC to use an obscure quote in it to indeed say the nail is in the coffin:)
There is a power point version of the paper; I have asked Jo to post it for reference; I think you are misreading the import of this paper MattB; it means that the so-called increase in ice-loss from Greenland and Antarctica can’t be happening; now go and research GIA.
10
I’m not sure it does say that to be honest Cohenite, but for sure those who have made predictions will have to see if this data is consistent with what they thought would happen. We all know at the moment there is decreasing sea ice in Arctic, but increasing ice in Antarctic… so could be consistent… but the conclusions sugggest the authors don’t think it is consistent.
I note the paper does not draw your conclusion.
10
scaper – glad to see the Brisbane one went well. I was considering going but decided against it as I wasn’t sure what sort of people would be there. The people waving idiotic placards around Tony Abbott in Canberra reinforced my decision. I only wish people could just stick to the topic of removing the carbon tax and not descend into conspiracy theory wrangling and airing all their grievances.
If you are in contact with the organisers of Brisbane in May tell them to learn the lessons from Canberra. They made themselves a ridiculously easy target for the Labor name-callers and in doing so took a lot of the power out of the message in an own-goal.
I posted about this a few times – I just knew that this type of thing brings all types out of the woodwork. It’s the same on the other side of the debate – cue the ridiculous skeletons breathing carbon – but I was hoping for the skeptics side to at least look like a serious meeting of adults. There are so many easy facts to poke holes in the tax, but people go looking for all sorts of stupid things to yell and wave about and in doing so offer themselves up as easy targets and stain the rest of the people there.
Message being : if you want ordinary people to protest, get some focus about the rallies.
10
@lolwot 30:
Should, could, maybe, perhaps. Whatever. The earth’s climate is a non-linear system.
BTW, you’ve messed your syntax up. It’s kthxbye. I guess you’ve got some debugging to do in a number of areas.
10
No, it shouldn’t have tied with 1998 – with the much higher co2 levels it should have been way hotter. You mean co2 forcing isn’t stronger than natural variation after all? Well knock me down with a feather.
PS You forgot strong La Nina at the end of the year at strong El Nino at the start of the year. Remember all those people bleating on about how warm it was for January through March ’10?
Whatever. Even if this year is hotter than the last, it doesn’t prove co2 did it.
10
I see MattB is off his meds again! Dont quote wiki aas truth, just open your eyes and look, it is not hard to see.
10
brc, I did not concentrate on the science, my focus was more on the economics and politics of this tax.
I tell you what…I’ll send the outline of my speech onto Jo and if you are interested she can send it on to you.
10
Matt B, Eddie, etc.
I am surprised no references to Dr Roy Spencer’s website.
I think he has some pretty compelling science to explain forcings and the assumptions IPCC’s prefered modelling uses and fails on explaining past climate, the 5-10yrs hence – let alone 50-100 years into the future.
Also, C7S Idso’s cross-referenced research based on “observations” rather than theoretical modelling. Nothing like looking out the window to see if its sunny or raining or if the sea is rising.
10
You’re a legend MattB, but let’s face it trying to explain climate science here is like trying to explain the Black/Scholes model for option pricing to a bunch of chimpanzees. But keep at it, you never know your luck, stranger things have happened at sea.
10
By the way, 100 people at the ant-tax rally. Wow, were they on their way back from the dole office? How many people live in Brisbane and Adelaide? Rough guess 3 million? Two hundred out of 3 million, nice going guys. You’ll be able to hire a phone box for your next meet.
(Okay maybe 2.5m, whatever)
10
Re “Denier” – This comment by
Aynsley Kellow says:
March 23, 2011 at 1:12 am
at http://wattsupwiththat.com/2011/03/22/abc-news-asks-is-the-phrase-climate-change-denier-offensive/#more-36453
“One could be charitable and suggest that PM Gillard and her ministers do not know what they are saying. But this would be to say that they are rather reckless in throwing about such terms.
Let’s be quite clear where the term came from. As I wrote in Science and Public Policy, the link was quite deliberate in a ‘review’ of Lomborg’s book:
‘Pimm and Harvey also resorted to the tactic of likening Lomborg to a
Holocaust denier in pointing to the virtual nature of most of the species
supposedly becoming extinct annually:
“The text employs the strategy of those who, for example, argue that gay men
aren’t dying of AIDS,that Jews weren’t singled out by the Nazis for extermina-
tion, and so on. ‘Name those who have died!’demands a hypothetical critic,who
then scorns the discrepancy between those few we know by name and the
unnamed millions we infer. ”
‘This is a fallacious argument.While any individual would be hard-pressed
to name more than a few Holocaust victims, the identities of the over-
whelming majority of them areknown, or were known by those who sur-
vived.They had lives,families,birth records,bank accounts,friends,and so
on.There is copious evidence that they existed and that they suffered at the
hands ofthe Nazis. With claims by Norman Myers or Edward Wilson that
40000 species supposedly become extinct every year, we have no strong
evidence that they exist, or that they have ever existed, or ceased to exist,
outside a mathematical model relating species and area.
‘What was more disconcerting was that IPCC Chairman Rajendra
Pachauri later likened Bjorn Lomborg to Adoph Hitler in the Danish news-
paper Jyllandsposten on 21 April 2004.’
After this, there was much discussion at sites like Grist as to whether ‘sceptic’ was a strong enough term, and many started using ‘denier’ quite deliberately to liken sceptics to Holocaust deniers.
The term is deeply offensive for this reason, especially to those of us who have family or friends who suffered in the Holocaust. I should add that I do not support censoring the likes of David Irving (I think his claims are readily falsifiable), but any attempt to liken anyone of a sceptical frame of mind to him is clearly seeking to silence dissent.
10
“I note the paper does not draw your conclusion”
Get fair dinkum MattB; if eustatic sea level rise rate is declining how can melt water from the alleged melting of the Greenland and Antarctic ice caps be occurring; perhaps the Eskimos are drinking more water in their scotch? If not, then where is the water going? It is the only conclusion one can draw from the paper; and GIA offers the answer; and since you are too lazy to research GIA, it, glacial isostatic adjustment [GIA], refers to 2 processes by which ice levels can be misinterpreted by satellite measurement; the first is weight with increased ice actually depressing the underlying bedrock and giving a false impression of ice loss; the second is an increase in underlying viscosity where increased overhead ice compaction causes, through friction and general motion generated energy, the underlying ice to melt.
Neither of these 2 aspects of GIA are to do with AGW; and the point remains if freshwater melt is increasing from Antarctica and Greenland it would have to be going into the ocean; the Houston and Dean paper, along with the Ablain and Cazaneve papers show it is not.
Neither is there an increase in steric sea level rise rate; steric is to do with an increase in stored heat or OHC in the ocean; this has been contradicted by the work of Knox and Douglass who show OHC is decreasing at both depth and near the surface which is also confirmed by NODC.
If sea level is not increasing and OHC is not increasing then there is no delay in climate response; the climate sensitivity does not have a delayed equilibrium and Spencer’s conclusions about short term negative feedback from clouds means that AGW is wrong in both the short term and long term.
10
Wes,
Typing th
10
Wes,
Typed it on the IPad. Sigh.
Spot on with your first post here.
10
Not a great fan of Bishop but this is what Abbott should be saying.Maybe the Age is trying to cause mischief but at least here is one Coalition member who is happy to say that the science is not settled. Pity Abbott is such a flip flopper:
http://www.theage.com.au/opinion/blogs/the-bishops-gambit/what-the-government-doesnt-want-you-to-say-on-climate-change/20110323-1c5o2.html
10
Gotta love the tried and true Australian method of quieting dissent: name calling. Julia is resorting to it in spades.
Meanwhile the ineffectual Libs will remain ineffectual while Abbott tries to maintain a political fence-sitting pose supporting human induced climate change, but deploring the proposed taxes. Way to go Abbott! That position will ensure three things. First, the Labor taxes will be introduced. Second, the Libs will remain in opposition while you are their head. Third, you will never be prime minister. What Abbott will see if he continues in this vein is a pronounced shift in Australian politics as public opinion moves left with the Greens seen as occupying the left wing and Labor seen as occupying centre and right. Libs will be seen as a radical, ultra-right wing fringe group. If Labor is to be defeated, the Liberals will need a new leader. Abbott has passed his use-by date.
10
the
Liberals will needcountry needs a new leader10
Hey silly Matt Australia is in the southern hemisphere and the sea level was 1.5m or 5 feet higher 4,000 years ago you dummy.
http://www.abc.net.au/catalyst/stories/2278381.htm
Also the temp rise after the end of the younger Dryas was a staggering 10C in just 10 years, or an average of 1C per year for 10 years. (CSIRO scientist Barry Pittock’s claim. )
The temp has increased by 0.7C over the last 100 years or 0.007C per year, a bit wimpish by comparison.
10
What was Julia Gillard doing today? Was she explaining how the carbon tax will improve the world, perchance? Nope. Informing us of the compelling science that underpins her policy? Nope. Telling the voting punter how it will benefit the country? Nope. Outlining the total cost of the carbon tax in exquisite detail? Nope. Iterating how a tax can modify society’s behaviour at zero cost to the public? Nope. Releasing a cost-benefit analysis of the carbon tax? Nope.
And guess what. She won’t do it tomorrow either.
Cheers,
Speedy
10
I admit Cohenite I assumed you just had a GAIA typo and were dissing me and my peeps
10
Also you’ll note I didn’t dismiss the paper, and I am well aware of the connotations you imply, and am happy to see how it pans out. I am not addicted to AGW science and am comfortable that someday indeed someone may debunk it, or show it is happening but essentially by completely different mechanisms. I don’t believe anyone has done that yet but I could be wrong who knows.
10
” ‘Name those who have died!’demands a hypothetical critic,who
then scorns the discrepancy between those few we know by name and the
unnamed millions we infer. ”
Classic Andrew Bolt re: stolen generations FYI.
10
Further – I even suggested you;d need to examine the impacts of the increasing ice mass at Antarctica vs decreasing in Arctic to see if that may explain variance to predictions. I just think you need to bide your time Cohenite… just how many utter rubbish nails in the coffin can you get away with until no one will listen. Discipline is needed.
10
I’m Canadian, and “global warming” is really starting to scare the crap out of me. I’m worried about my igloo and how I’ll get around if there’s no snow for my dogsled. But worst of all, my maple syrup might disappear! /sarc.
In Canada, the summers have been very cold and short. Summer really only starts in early/mid-July and fall is creeping in noticably by the end of August. The winters have been long, cold and snowy. There was an enormous snowstorm not that long ago in which one city had over a metre of snow. The town had to literally shut down! Snow used to be gone by March, but now it lasts well into April. I’d love for a bit of global warming, because it’s f*cking cold here.
10
Replying JULY’s baseless whining at post #29:
Not sure what you are bitching about July,you are THE pre-eminent knuckledragging drooling troll and peddlers of steaming factless bullshit.Not to mention your glaring inability to articulate on why you dislike the posted valid data based temperature charts and your unwarranted personal attacks and ad homonyms.The bullcrap you spew out here in the blog entries never needs any debunking at all,since you post nothing of value to debunk.
10
Bulldust@68:
I told you I’d be at the rally, and that I wouldn’t say anything funny. It was weird, listening to the bullshit. I couldn’t believe some of the tired old stuff. Like being so shocked that a politician would say one thing before an election and do another thing afterward – like that’s never happened before. And then there was the “just 0.038%”, how could such a little bit have such a big effect? Strangely enough followed later by, “crop yields had increased by 15% in the last century because of more CO2”. Hang on, “just 0.038%”, surely that is too tiny an amount to boost crop yields by 15%? And then of course, all the corrupt scientists.
But I was rude, and in the end felt like I was ruining other people’s enjoyment, so, public meeting or not, I left.
Ultimately action on reducing ghgs in the atmosphere will have to happen without you guys. To be truthful, I don’t really believe that the ALP and the Greens can actually get a carbon tax up, let alone sell it successfully. I don’t think the US can either. And I guess that is in part due to the hard work you guys put into a campaign of misinformation. Take a bow.
10
Our Australian Prime Minister has just posted this article in todays Sydney Morning Herald (SMH). So I guess most of us here except the likes of ‘Brookesy’ and ‘July’ are extremists?
http://www.smh.com.au/opinion/politics/extreme-views-must-not-decide-carbon-tax-20110323-1c6ky.html
But there is still hope. Also in todays SMH, the Productivity Commission has knocked the carbon tax on the head on the basis of its economic credibility.
http://www.smh.com.au/environment/climate-change/gillard-suffers-climate-setback-20110323-1c6t5.html
10
brc@#127:
I agree about your comment on people waving idiotic placards. I was not at the Canberra rally but based on what I have read, heard and seen (TV), the crazies were greatly outnumbered by normal concerned middle class Australians of varying backgrounds. In any case I don’t think there were people burning effigies, destroying public property, attacking police or their horses and the like, pretty much what we have come to expect from left wing crazies at every “peace” march, OECD or G8 meetings these days!
I understand there will be further protests arranged in Sydney and Melbourne where much greater numbers could be expected, especially if arranged on a weekend so work is not a hindrance to attending. If so lets hope they can stick to the key messages and avoid counter productive images.
10
The title of Jo’s previous post was “Yes, it IS about the science”. Reading through all the comments, the consensus would seem to be that the proposed Australian Carbon tax needs to be attacked on two perspectives, ie; the Economics (see my previous post referencing the Productivity Commission ruling) and the Science. Also in today’s SMH is a heartening article posted by Julie Bishop – Australian deputy opposition leader (linked below). Finally we have the Australian political opposition pointing out there really are highly qualified scientists who doubt the big scare campaign!
http://www.smh.com.au/opinion/blogs/the-bishops-gambit/what-the-government-doesnt-want-you-to-say-on-climate-change/20110323-1c5o2.html
10
2010 THE HOTTEST YEAR ON RECORD?
By Steve Goddard | February 15, 2011
Dr. James Hansen of NASA’s Goddard Institute for Space Studies (GISS) has announced that 2010 was the “hottest year on record” – by 0.01 degrees. His claim has been widely touted in the press as strong evidence that the climate is rapidly heating – due to human generated CO2 emissions. Dr. Hansen has also stated:
“I would not be surprised if most or all groups found that 2010 was tied for the warmest year.”
Unfortunately as this paper details, Dr Hansen’s pronouncements cannot be relied upon. There appears to be plenty of evidence to suggest that Hansen has selectively collected and interpreted data to satisfy his political and ideological position.
His claims regarding 2010 are not supported by independent sources of surface temperature data. The CRO Hadley Centre temperature data, HadCRUT, shows 2010 cooler than 1998. Satellite data from UAH also shows 2010 slightly cooler than 1998. A graph of the four main world temperature datasets shows 2010 monthly temperatures produced by Hansen at GISS was out of kilter with other data sources. The HadCRUT graph shows that 2010 was not a remarkable year for temperatures, and was cooler than 1998. In fact, HadCRUT also shows that temperatures have not warmed appreciably (if at all) since 1998. By contrast, Dr. Hansen claims that temperatures have increased steadily since the mid-1970s.
“Global temperature is rising as fast in the past decade as in the prior two decades”
However, even his own data shows no significant trend since 2002, and chances are that the GISS January, 2011 anomaly will be one of the lowest of the past decade. So, was 2010 a record hot year? There is little evidence to support that. For example, the UK Met Office reported that 2010 was the coldest year in England since 1986. Temperatures there have dropped significantly over the past decade.
Dr. Hansen has a long history of exaggerated warming forecasts.
Hansen said the average U.S. temperature had risen from one to two degrees since 1958 and is predicted to increase an additional 3 or 4 degrees sometime between 2010 and 2020. The Press-Courier (Milwaukee) June 11 1986
“Within 15 years (before 2001),” said Goddard Space Flight Center honcho James Hansen, “global temperatures will rise to a level which hasn’t existed on earth for 100,000 years”. The News and Courier, June 17th 1986
Pursuing present plans for coal and oil, Hansen found, the climate in the middle of the 21st century “would approach the warmth of the age of the dinosaurs.” The Leader-Post, January 9th, 1982
(Hansen’s 1988 forecast for Manhattan in 2008) “The West Side Highway [which runs along the Hudson River] will be under water. And there will be tape across the windows across the street because of high winds. And the same birds won’t be there. The trees in the median strip will change.” Then he said, “There will be more police cars.” Why? “Well, you know what happens to crime when the heat goes up.” http://dir.salon.com/books/int/2001/10/23/weather/
[Since Dr. Hansen made that prediction, NOAA tide gauges show less than one half inch rise in sea level near Manhattan.]
“How far can it go? The last time the world was three degrees warmer than today – which is what we expect later this century – sea levels were 25m higher.” http://www.climateimc.org
Manhattan is not disappearing under water, but Dr. Hansen continues to project similar bloated forecasts into the future.
Dr. Hansen functions in the roles of global warming head coach, cheerleader, referee and score keeper. Temperature measurements need to be made by neutral third parties in the global warming debate because the keepers of the temperature data have shown they can’t be trusted.
Read entire paper here:
http://scienceandpublicpolicy.org/images/stories/papers/reprint/the_hottest_year_ever.pdf
10
I have never been a political animal, however I don’t remember a serving Prime Minister ever having to write articles for papers or propaganda blog sites in the past to woo the public.
Am I right, is this a first? If it is a first for Prime ministers then it can be explained only as desperation on her part.
10
How about this………
Oh My! 2010 tied for ‘hottest’ year?! Relax, it is ‘purely a political statement’ — Even NASA’s Hansen admits it is ‘not particularly important’ — Prof. mocks ‘hottest decade’ claim as ‘a joke’
http://climatedepot.com/a/9435/Oh-My-2010-tied-for-hottest-year-Relax-it-is-purely-a-political-statement–Even-NASAs-Hansen-admits-it-is-not-particularly-important–Prof-mocks-hottest-decade-claim-as-a-joke
10
Bob Malloy
I read Julia’s little spiel. Even assuming a schred of personal integrity, the intellectual dishonesty in her argument is appalling.
She takes “her science” from the CSIRO – and ensures that heretics within the CSIRO get sacked. She probably also takes her opinions from “her” ABC.
The rest of her piece is about argument from authority and motherhood statements – fairly ironic coming from her.
Cheers,
Speedy.
10
It would be known by many here that there is a project underway to compile a temperature set which will satisfy all interested parties, the BEST project. Anthony Watts has given it a “tick” at this point. Some data (2%) was released on the understanding that it should not be taken as representative of the whole. Better to read the story at WUWT.
Some warmists will clutch at any straw, such as Ian Ash who went off on one of his typically lip-spittled, foamy-mouthed rants at Judith Curry’s site. Fair dinkum, this bloke really has an anger management problem. Such hate directed at anyone who dares express the slightest doubt of his religion.
10
I applaud your efforts MattB but I fear you are beating your head against a thick wall.
10
I always find it ‘funny’ that these graphs get offered up for consumption with less than the minimal of supporting contextual information to allow them to actually be practically worked with. Combine that with the degree of data plastic surgery going on behind the scenes and I have little confidence that they really demonstrate anything truly scientific you would want to base the future of the planet on.
As regards all the greens going over the top – they know the only way this will all hold together is if nobody really starts looking at it in detail and asking awkward fact based questions and talking to each other about it without them in loop. The grass roots ‘WTF’ response to the Carbon Price/Tax scares them to the core and they will do anything to stop it spreading.
Go forth and talk!
10
[…] URL to article: http://joannenova.com.au/2011/03/was-2010-the-hottest-ever/ […]
10
Keith, the graphs are explained in beautiful detail on the junkscience site (see the link above the graphs). There’s more information on this page that’s relevant than you get in most glossy government brochures.
10
Thicker than you imagine, Ian — Since it is built of demonstrable facts that MattB’s false “argument from authority” and strong opinions can’t breach.
10
I am very late on this one, but there is a detail of interest.
NASA OMITS INCONVENIENT FIGURE
The NASA Earth Observatory has it’s own graph of temperature anomalies annual average temperature anomalies going all the way back to 1880. There are 4 data sets superimposed – GISS, NOAA, Hadley and the Japanese Met Agency.
One of the data sets clearly ranked 2010 as the third warmest yea, behind 1998 and 2005. But not on the chart.
See http://manicbeancounter.wordpress.com/2011/04/05/nasa-excludes-an-inconvenient-figure-on-2010-temperatures/
10
just noticed that your link under RSS graph is the same as the GISS link. Since the linked page provides the source of the data it would be good get it corrected. 😉
[REPLY _ Thanks. Link Fixed. I wonder why no one noticed that before. Cheers — JN]
10
BTW a couple of guesses found the right link:
http://www.junksciencearchive.com/MSU_Temps/RSSglobe.html
10