Here in the sunburnt country, floods are running rife, temperatures are so low some people might have a White Christmas, indeed many people are wearing clothes that are from the wrong season, and all of this of course is just weather.
Luckily we aren’t getting as much weather as the UK and Europe.
This is not a real post, that comes tomorrow, but I thought it gives you some idea of the transformation going on downunder thanks to the PDO switch. If only our policy makers had seen it coming. They might not have thrown so much money at desalination plants to boost water supplies in Dams that on the Eastern Seaboard are all now suddenly full.

Bear in mind all this rain recorded above was before the current December floods
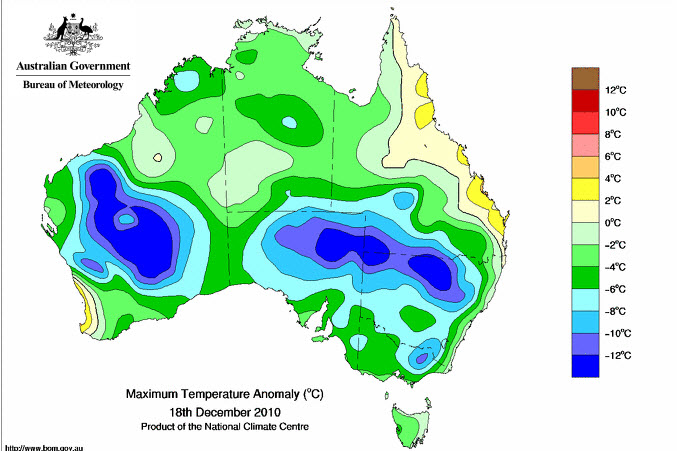
Stephen Goddard, captured this map from yesterday at the BOM.
..
Note the minus 12 degree colour… (That’s 12 degrees below the usual, not 12 below zero.).
To give you some idea of what it means, Binny really captured it in a comment on Goddard’s blog:
Laugh. I’m in western Queensland – ‘the fridge’ is right I just looked outside to notice my two work dogs sleeping on the lawn in full sun. That is the sort of thing you see in mid-July. Their normal mid-afternoon, mid-December position is in their water troughs with just their noses poking out like a couple of crocodiles.
No, I’m not drawing too much meaning out of one day, one flood, or one season.
Warnings for Queensland
- Flood Warning – Fitzroy River,
- Flood Warning – Burnett River,
- Flood Warning – Mary River,
- Flood Warning – Lockyer, Bremer, Warrill & Brisbane below Wivenhoe.,
- Flood Warning – Condamine-Balonne Rivers,
- Flood Warning – Moonie River,
- Flood Warning – Warrego River,
- Flood Warning – Paroo River,
- Flood Warning – Bulloo River,
- Flood Warning – Thomson/Barcoo/Cooper Ck,
Warnings for New South Wales
- Warnings current:
- Coastal Waters Wind Warning for New South Wales waters between Montague Island and Gabo Island,
- Cancellation of Local Waters Wind Warning for Sydney Closed Waters,
- Flood Warning – Peel and Namoi Rivers,
- Flood Warning – MacQuarie River,
- Flood Warning – Bogan River,
- Flood Warning – Lachlan River,
- Flood Warning – Murrumbidgee River,
- Flood Warning – Murray River,
- Flood Warning – Culgoa, Bokhara, Narran,
- Flood Warning – Warrego River,
- Flood Warning – Paroo River,
- Flood Warning – Barwon-Darling US Bourke,
And you get the idea. The endless drought is now an expanse of flood. There is even a flood on the West Coast in Carnarvon. (That’s about 1000 km north of Perth).


I must admit I was surprised to see a low in the Great Australian Bight a couple of weeks ago with cycles of troughs all the way up to NW.
Is this the first time that such dramatic changes have come around the end of a solar cycle?
My gut feeling is that it is not, but the MSM ( & David Jones )would not get as much mileage by admitting that.
You have to wonder how much post editing/homogenization will change the current figures for political reasons in the future.
10
Looking at the rainfall map, you will see all that rain has soaked the desert, which at the moment is teaming with water birds and wild flowers (some pics would be good Jo).
The systems that travel from west to east usually travel over bone dry hot desert before reaching the coast. Now they will travel over moist warm land picking up moisture and dump some of this as it reaches the great dividing range.
The worry, and the possibility, is if the ocean T’s along the east coast drop, these systems travelling from the west will clash with cool air from the oceans dumping all sorts of precipitation over the populated areas.
Anyone not preparing for extreme weather between now and next April has rocks in their heads.
I’d like to see some BoM charts from the 70’s
10
The alarmists and perhaps classical (if we can be so kind) meteorology needs to think up a better definition of climate than the defensive one usually trotted out about it being long term weather. It would seem that climate could be defined as the set of factors that produce the day to day weather. Given the combinations and permutations of those factors, climate, even along those lines, is probably almost as useless as the present nonsensical definition in telling us what the weather will be like. I’ve notice two bets, from the classicists, for Christmas day in Melbourne; 35C and 24C. Wonder if BOM has a double headed coin?
10
I recently checked the rainfall for Observatory Hill in Sydney (has been taking measurements for 150 years), and sure enough the mean rainfall over 150 years is almost exactly equal to the mean over the previous 30 years (to within 1%).
People might want to check other stations that have done more than 100 years in the same spot, probably find much the same thing.
10
From an article in the Sydney Morning Herald MARCH this year
Not ten years mate, not even ten months.
10
The table of flood levels on the Murrumbidgee River is below:
http://www.wagga.nsw.gov.au/www/html/303-murrumbidgee-river-and-floods.asp
Plot it yourself against the solar cycle. However, it’s probably worth noting that there have been several dams built since the 1800’s and strictly speaking it’s not natural for water to tunnel itself under a mountain and pop out the other side… so the experimental conditions have been tinkered with on a number of occasions. You would have to look up all the key dates for those and mark them on the plot as well.
10
I now predict a forthcoming wave of global warming jokes.
10
By its nature cricket is probably the sport more affected by the weather than any other. In my ten year involvement as a junior coach, team manager and now umpire I have never seen the first half of the season up to Christmas so affected by rain. In Adelaide players are very frustrated at being unable to get a two-day match (over successive weekends) in. It’s all been one-day limited over and Twenty-20 play and believe me, they’d all prefer to play real cricket. In Melbourne it’s been even worse, with only a couple of rounds completed.
There are strict heat policies for junior cricket. In March 2008 the cricket finals were all cancelled (to everyone’s dismay) because of a 15-day heat wave, described as a one-in-3000-year-event. At the time we thought this would become the norm as there was lots of talk in the media about tipping points. In early November 2009 there was a week of hot weather and the games were cancelled. However that seems to have been the last of it. This current season could well be the first one in ten years to have no heat-related cancellations.
10
So we’re NOT going to dry up and wither away because of AGW? Well then it MUST be that these floods and wet periods are because of AGW.
I just know someone will step forward and say they predicted AGW caused desert flooding. Start the count down clock…….
PS It sure is pretty what nature does all by herself isn’t it?
10
Gee, I wonder if these weather patterns are unusual for Australia. Let’s check with some early poets.
My Country – Dorothea McKellar 1908
and one of my favourites ..
Said Hanrahan – John O’Brien 1921
Nope … seems pretty normal.
10
Baa @ 2
I gather you are in SEQ ( my old stomping ground ).
I can still remember a famous long term forecaster featured in a TV ad for “Geometric Lawn Sprinklers” late in 1973 predicting a particularly dry summer for 1974.
Perhaps some of his students are running BoM at the moment!
10
Pattoh
I doubt it. I just checked solar cycle 20, which petered out in 1976 but was well on the way out by october 1973.
The thing with solar cycles is that anecdotally, short cycles match up with warm periods, and long drawn out cycles match up with cool periods. the down side of a cycle seems to be most influential.
Cycles 17, 18 and 19 were all shorter and more intense than 20, especially 18 and 19. What happened during cycle 20?
From the Oz BoM
So we had a fairly strong El Nino during a long solar cycle, much like we had 2009-2010. So what happened next?
Again from BoM
So what do we have now? We’ve had a fairly strong El Nino right up until the middle of this year followed by a strong La Nina which we are experiencing now. Though Solar Cycle 24 started about a year ago it is very quiet following a long drawn out cycle 23.
So IMHO, instead of relying on super computers, I would look at these historical events and suggest people should prepare for a very very wet summer/autumn season with cool temperatures.
If the fools leading us had of done this, they would have built a dam or three to capture all this wonderful H2O for future drought proofing instead of burning a few billion on useless desal plants.
10
So are we saying that the weather runs in cycles, who’d have thunk it.
10
Baa Humbug, Ian H especially, and others above. My thoughts exactly. I’m thinking more like 78-79 than 73-74. And it’s also cool in Antarctica. In the new year I intend to replot raw temps for Australia including 2010 and see what happens. I’m also going to look at historical cloud cover data which has started to appear at BOM.
Thanks Jo for putting this up, and thanks for your support and encouragement this year. You do a mighty job.
I’m turning into a pumpkin for the duration of the silly season (visiting grandchildren, Christmas, beach… hope we don’t get caught by floods!) so…
Merry Christmas and a Happy New Year to Jo and all readers!
Ken
10
I live in the SW corner of Western Australia and here in the Swan River valley night times are decidely cool -I have not yet turned on the air conditioner! Usually the air con is on and its “hot”.
However the BOM predicts that December 25 Perth will have a temperature of 38 degrees Celsius, predicted yesterday (Monday 20th) on the radio news service.
We will wait and see whether the BOM gets it right.
10
So essentially, to sum it all up for all them river hippies, and disregarding all them colorful rainbow connotations you use, if your last name is” River” run for high ground.
(Now everyone else just sit back and enjoy the show, the herd is going that a way.)
10
as the CAGW fantasy collapses thanx to nature, the media and the unions continue with the madness. CFMEU members need to know what their union is up to with their hard-earned, outrageously high, membership fees.
the URL says this is “opinion”, but whose opinion is not clear:
21 Dec: Australian: Black coal must become green
WITH the Queensland government’s decision to write off $150 million on the ZeroGen experimental clean coal power plant, we have to hope for positive results from other projects under way around the country. This is because cleaning up coal emissions is our single best hope of reducing the amount of carbon we pump into the atmosphere…
This is not to deny the case for cutting the amount of greenhouse gas Australia produces, nor to argue against establishing a market mechanism that sets a price for carbon to encourage cuts…
http://www.theaustralian.com.au/news/opinion/black-coal-must-become-green/story-e6frg71x-1225974124182
20 Dec: ABC: Dumping ZeroGen plan threatens coal industry: union
The Construction, Forestry, Mining and Energy Union (CFMEU) says the State Government’s decision to scrap plans for a multi-billion-dollar clean coal power station in central Queensland puts the industry’s future in jeopardy…
http://www.abc.net.au/news/stories/2010/12/20/3097218.htm?section=business
10
pat 16, I still have not heard anymore about the Cape Otway pilot sequestration plant. It was opened in fanfare by PM Howard. Has it failed? USA has also abandoned its plans to trial CO2 sequestration. Germany started but near riots in the towns nearby stopped the project. I have yet to hear any scientist, even AGW supporters, still believing CO2 burial is possible with safety. The amount of water needed to do it is very great. Then there is the risk of CO2 erupting centuries later causing death. That makes CO2 burial more of a danger than responsible radioactive waste disposal. Anna Bligh would have known all this before wasting money to placate the Greens for votes. The issue of CO2 burial is dead and buried. Pun intended.
10
Tel, comment 4, a year ago I read a newspaper report about a farmer in the Lockyer Valley west of Brisbane. He was complaining that his crops that needed a small amount of frost for good results were not as good because frosts were becoming less and less. This as supposed to be evidence of AGW. I checked on BOM with a station nearby that had been recording for about 100 years. Tallying all the figures I found that in 100 years there had been a huge rise in morning minimum temperatures of 0.01 degrees. Someone was telling porkies. Funny though, after I wrote that on the Courier Mail green blog I could no longer find the BOM page with those statistics I used. Maybe I’m just paranoid…but as Henry Kissenger said, “Even paranoids can have enemies.”
10
Pat:
“as the CAGW fantasy collapses thanx to nature, the media and the unions continue with the madness.”
That’s what scares me the most; they’re beyond totally ignorant of what is happening. Unfortunately, they’ll be long gone from their office(s) after the damage they’ll be inflicting is done.
10
*** BREAKING NEWS ***
Ken Henry (Treasury Secretary) is quitting in 2011 to be replaced by Climate Change Department Secretary Martin Parkinson:
http://www.smh.com.au/business/henry-to-exit-early-in-2011-20101221-193m0.html
Make of that what you will…
10
Hi all it snowed yesterday in Katoomba NSW, briefly, last winter was unbearable. I expect next year to be worse.
Co2 is like a shock absorber for climate change-not the driver. It wont be too long before this is made obvious.
10
Looks like you’re due for at least another week of 10mm/day+ rain. This was forecasted a month ago and should last into next year.
Why is this news to government? Doesn’t this happen every thing the ENSO shifts and in regular cycles. The fishing industry sets it clock by it; see: http://www.fish.wa.gov.au/wf/articles/Elnino.php?9999 and [Natural] Climate Changes and Fish Productivity alexeylyubushin.narod.ru/Climate_Changes_and_Fish_Productivity.pdf
10
broken link:
[Natural] Climate Changes and Fish Productivity http://alexeylyubushin.narod.ru/Climate_Changes_and_Fish_Productivity.pdf
10
Warwick Hughes has been keeping some good records of the BOM at his blog that may be useful for your post.
here is the spring comparison between the BOM prediction and measured
10
The Daily Telegraph is running a poll:
http://www.dailytelegraph.com.au/
so far it’s 92% NO!
10
subject: It’s ‘the hottest year on record’, as long as you don’t take its temperature – Telegraph
Hansen has been caught out boosting temperatures this year by as much as 0.50 degrees
SOMEONE ARREST HIM !
http://www.telegraph.co.uk/comment/columnists/christopherbooker/8211948/Its-the-hottest-year-on-record-as-long-as-you-dont-take-its-temperature.html
10
Snowfalls recorded in NSW from 1836………………
http://members.ozemail.com.au/~donwhite/today.html
Current Interesting Weather Facts & Information
________________________________________
Snow in NSW
Snow is probably the most unreliably documented weather phenomenon. On 19 August 1996 there were widespread light falls throughout the ranges of NSW. Reports of up to 20 cms were received from the Barrington Tops. Hunter Springs had 15 cm on the ground at 9am on the morning of 20 August 1996. Light falls extended to Stanthorpe, on the Granite Belt of southern Queensland. Although this fall was the most widespread for a few years, it no way matched some of the events in the past.
Major Snow Event 1: 28 June 1836
The earliest reported snowfall and the only significant fall in Sydney’s history occurred on the morning of 28 June in 1836. According to the report in the Sydney Morning Herald, the city experienced freezing weather “of a type never before occurring in the colony.” At 6am the temperature was 32 degrees F (O degrees C) and light snow continued to fall until mid morning with little change in the tempertaure. By mid morning, the hills down to the shores of the harbour were white and the SMH report went on to say that “the terrified state of the natives indicated the rare nature of such a visitation.” An examination of the records indicate that this was the only real snowfall in the city’s history although press reports indicated that snow fell again on 2nd and 5th July 1836 – it must have been a very unusual week.
Major Snow Event 2: 5 July 1900
Perhaps the single most exceptional snowfall in the state’s history dumped up to 1 metre of snow on the central west of NSW at the turn of the century. The snowstorm of 5 July was described by the Government meteorologist at the time, Mr H.C. Russell as “a phenomenal snowstorm, in some instances the experience unprecedented, in which all the higher parts from the northern to the southern boundary of the state participated. Railway traffic became paralysed, passengers being shut up in their carriages, unable to reach hotels, by snow in places up to 8 feet (2.5 metres) deep on the rails. Telegraph wires were down everywhere… Bathurst had the unique experience – all business was suspended, roofs, verandahs and lightly constructed buildings collapsed under the weight of snow.” Some depths of snow reported at the time would cause amazement today. Forbes had 25 cms on the ground, Parkes 10 cm and Mudgee 55cms. Blayney had 68 cms, Carcoar 90 cms, Bathurst 70 cms and Rockley 80 cms, while Orange, despite it higher altitude, escaped with just 45 cms – still more than they have ever recorded since.
Other Significant Snowfalls in NSW
Other “snowy days” in NSW have been 18 July 1949, 27 August 1949, 26 June 1959, 22 October 1959, 19 July 1960, 26 September 1960, 21 August 1962, 18 July 1965, 17 August 1970, 1 September 1970,19 July 1982, 4 July 1984…. and watch this page for more details on these events.
10
Natural warming drives CO2 out of the oceans. The combination of warmer temperatures and the increased CO2 stimulates plant growth which results in increased evapotranspiration which transports heat into the upper atmosphere where it is released during condensation. The condensation leads to cloud formation (plus rain and snow) which blocks the sun, reducing solar warming.
10
The explanation for the rain in Australia is simple. England brought their weather with them. They didn’t bring their cricket with them though – except in Perth – but that was just a temporary aberration – weather isn’t climate.
10
I know this is way off topic but the MRRT policy transition group has just released their report on how the government can ease into the policy of gouging the mining industry. Swannie’s statement is here:
http://ministers.treasury.gov.au/DisplayDocs.aspx?doc=pressreleases/2010/096.htm&pageID=003&min=wms&Year=&DocType=
and the 179-page insomnia-busting page-turner is here:
http://www.futuretax.gov.au/pages/resourcetax_PTG_reports.aspx
I like how Swannie is confident that we are heading for “Mining Boom Mark II.“
10
“Rod McLaughlin”, believes in faries at the bottom of his garden, in Sana Claus, and……
in the man made global warming FRAUD………
Credibility – ZERO!
QED
10
Colin @ #28
So what you’re saying is that increased atmospheric CO2 has a net cooling effect?
10
Jo’s opening line would remind many Aussies of the poem ‘My Country’ written by Dorothea McKellar (1885–1968) in the early 1900’s (before the global warming bandwagon). She wrote it as if to people from ‘Mother England’ basically saying while you may like the green soft land of England, she would take harsh, stark, beautiful Australia any day. I find it embarrassing that our Government and main stream media act as if extreme weather events are somehow new or worse now than in the past. All historians know that is not so and it is reflected in our famous literature. Anyway, I thought I’d share this wonderful iconic Australian poem for those who don’t know it.
My Country
The love of field and coppice,
Of green and shaded lanes,
Of ordered woods and gardens
Is running in your veins.
Strong love of grey-blue distance,
Brown streams and soft, dim skies –
I know but cannot share it,
My love is otherwise.
I love a sunburnt country,
A land of sweeping plains,
Of ragged mountain ranges,
Of droughts and flooding rains.
I love her far horizons,
I love her jewel-sea,
Her beauty and her terror –
The wide brown land for me!
The stark white ring-barked forests,
All tragic to the moon,
The sapphire-misted mountains,
The hot gold hush of noon,
Green tangle of the brushes
Where lithe lianas coil,
And orchids deck the tree-tops,
And ferns the warm dark soil.
Core of my heart, my country!
Her pitiless blue sky,
When, sick at heart, around us
We see the cattle die –
But then the grey clouds gather,
And we can bless again
The drumming of an army,
The steady soaking rain.
Core of my heart, my country!
Land of the rainbow gold,
For flood and fire and famine
She pays us back threefold.
Over the thirsty paddocks,
Watch, after many days,
The filmy veil of greenness
That thickens as we gaze.
An opal-hearted country,
A wilful, lavish land –
All you who have not loved her,
You will not understand –
Though earth holds many splendours,
Wherever I may die,
I know to what brown country
My homing thoughts will fly.
10
Re my post @ 33, I should have noted that the poem is under copyright and to reproduce it, permission must be sought from the copyright owners C/- Pippa Masson at Curtis Brown (Aust) Pty Ltd. E-mail address ([email protected]) which I did.
10
Good article on Andrew Bolt’s website today!
“Delay is denial”………
http://blogs.news.com.au/heraldsun/andrewbolt/index.php/heraldsun/comments/delay_is_denial/
10
Snowed before, but snowed under now………
An interesting trajectory in British reporting on global warming (http://thegwpf.org/uk-news/2073-warm-bias-how-the-met-office-mislead-the-british-public.html) :
Children just aren’t going to know what snow is (http://www.independent.co.uk/environment/snowfalls-are-now-just-a-thing-of-the-past-724017.html) . –Dr David Viner, Climatic Research Unit, University of East Anglia, 20 March 2000
Why did the Met Office forecast a “mild winter”? (http://www.thegwpf.org/opinion-pros-a-cons/2077-boris-johnson-why-did-met-office-get-it-wrong-yet-again.html) –Boris Johnson, Major of London, The Daily Telegraph, 20 December 2010
December 2010 is “almost certain” to be the coldest since records began in 1910, according to the Met Office (http://www.independent.co.uk/news/uk/home-news/coldest-december-on-record-puts-brakes-on-start-of-the-big-getaway-2163615.html) . –The Independent, 18 December 2010
The Transport Secretary, Philip Hammond, is seeking the opinion of the chief scientific adviser about whether the government should be planning for more severe winters in future (http://www.bbc.co.uk/news/uk-politics-12032681) . – BBC News, 19 December 2010
http://blogs.news.com.au/heraldsun/andrewbolt/index.php/heraldsun/comments/they_were_snowed_before_and_are_snowed_under_now/
10
so taxpayers wasted $100m on the clean coal power station which is being scrapped; $1bn on the desal plant at Tugun on the Gold Coast that is being mothballed; untold millions on the insulation scheme which went wrong, and now gillard has announced the govt
21 Dec: Lauren Wilson/AAP: Australian: Gillard Labor pulls plug on Green Loans scheme
THE Gillard government has pulled the plug on the troubled Green Loans program and its proposed Green Start successor scheme…
http://www.theaustralian.com.au/national-affairs/gillard-labor-pulls-plug-on-green-loans-scheme/story-fn59niix-1225974514315
yet, from the above, we get more taxpyers money to be wasted:
“The government has set $30 million aside to for compensation and retraining costs for contracted Green Loans assessors.
Assessors will receive a 50 per cent refund of their tuition fees, up to $2,500, to upgrade their qualifications to the new Certificate Four in home sustainability.
Direct financial support of up to $3,000 will also be provided to non-contracted Green Loan assessors to cover the costs incurred during the accreditation process.”
then we ask the Greens to comment!!!
The Australian Greens said it would have been a waste of money to continue the badly designed and implemented scheme.
“We now need a national energy efficiency target,” deputy leader Christine Milne told reporters.
“It needs to be a market-based mechanism because the department of the environment has shown more than capably why the government shouldn’t be running these programs.”
and nowhere does the ‘journalist’ or AAP mention all the other “green” schemes that have cost taxpayers mentioned at the start of this post! why not? surely u would link them together. guess not when u r following an agenda.
as for the communique on Bolt’s blog (link above) from Gillard’s committee on climate change, it is the most unintelligible piece of writing i’ve ever read.
enough is enough.
10
Here’s our ABC publishing another article on the rising sea levels (or lack thereof), complete with ad-hom and deriding sceptics with their favourite “d-word”.
http://www.weatherzone.com.au/news/rising-sea-levels-a-threat-to-some-coastal-suburbs/15670
If this is such an issue, why the hell are coastal property values rising?
I think I’ll say “BAH, HUMBUG!” to that lot.
Have a Merry Christmas and prosperous, happy new year, Jo, and all the regulars of the JN blog. For those of you travelling, keep safe and well.
Cheers,
El Sledgo
10
wendy:
December 21st, 2010 at 12:46 pm
Wendy you really need to STOP attacking commentors so causticly at every opportunity.
It’s rude, uncalled for and doesn’t reflect well on you at all.
Stop it!!!!!
10
Good on you El Sledgo (I’m glad you spelt bah humbug correctly)
Merry Christmas and a happy new year to you and yours as well.
10
[…] years. A Denier claim is that science either does not admit to this fact, or cannot explain it (eg here). Actually the lag was predicted by Lorius et al before it was discovered, and is well understood […]
10
All I can say is Baa Humbug and Fiddlesticks!!!!!!!
10
I’m going to EXPLODE if these f..king global warming nutters keep promoting their BS!!!!!!
http://www.youtube.com/watch?v=BlK62rjQWLk
10
Why Earth may be entering a new Ice Age ………
http://www.helium.com/items/1837151-why-earth-may-be-entering-a-new-ice-age
10
Post @ 42
So the fact that temperature preceeds CO2 changes by about 800 years is well known by hte alarmist tribe/industry. Good. Then why did Al Gore in his “Inconvenient Truth” (which was neither inconvenient – for him – nor truthful) suggest otherwise? When will the Alarmists finally develop enough self respect to disown this charlaton?
In the post you refer to, you forgot to mention that if CO2 does follow temperature, and if increased CO2 will drive higher temperatures, then we have a runaway greenhouse. Unfortunately, the author of that post chose not to continue with this logical train of thought, but instead decided to start labelling people who questioned his views as “deniers” and liars. Perhaps, if we put the personal abuse to one side for a while, he could tell us why we haven’t had a runaway greenhouse already? It is the logical extrapolation of his belief.
A wise man (not me) once said that we see the world, not as it is, but as we are. When alarmists start calling me a liar and a denier, then it presents a very interesting window into their pysche.
Cheers,
Speedy
10
#42 – thanks for the nice link. Once people start looking at it, you may get a few thumbs down!
Oh, and Merry Christmas Wendy! Don’t take it all too seriously, after all, we’ll all be dead one day….
10
Speedy@46: Al Gore made a very interesting and confronting movie and book. Did he really say, “CO2 does not follow warming with a lag of about 800 years”? It would be somewhat surprising if he did.
You will NOT get a runaway greenhouse just because CO2 causes temperature to rise, and temperature causes CO2 to rise. Feedback can amplify an initial signal without spiralling every upwards. Besides the T^4 blackbody radiation term means even runaway feedback would just mean arriving at another stable temperature.
As for using the term deniers, I think his point is this: Some people continue to use arguments which are known to be faulty. They do so in the full knowledge that the argument is faulty. They decide the merit of new arguments based solely on whether the argument fits their beliefs, not on the merit of the argument. They are not interested in furthering their, or anyone elses, understanding. All they seek to do is deny anything that implies we might have to question our “business as usual” model of the world.
I think deniers is a good label for this mindset. There are 9/11 deniers – people who cannot accept 9/11 for what it actually was. There are holocaust deniers – people who only want to find evidence which suggests that the holocaust didn’t happen, or wasn’t as bad as others say. There are people who, despite the evidence, don’t see any harm in a high fat, low exercise regime. They ignore or rationalise the evidence away. They don’t want to have to give up their cakes and pastries (this is a self-portrait, in case you didn’t guess).
10
great post – someone above mentioned Warwick Hughes blog; check it out under BOM; also check it out under his most recent post – I’ve posted a couple of comments about the NIWA review of its 7SS series after the NZCSC took it to Court and Warwick has a reply up with the links he’s been able to find; http://www.warwickhughes.com/blog/?p=728&cpage=1#comment-25424
and you can also check it out on Climate Conversation http://www.climateconversation.wordshine.co.nz/news/december-20-2010/
I’ll be interested to hear your comments and I know RichardC(NZ) visits here as well; he might have some comments for us
10
Great stuff there Jo (as usual). It sure helps to have the key to not show cold temperatures using warm colors.
Just pinging people here to wish everyone a very Merry Christmas. I wish you and your families all the best of luck for the new year.
For those of you in the northern hemisphere. Try to stay warm
For those of us down under – try to keep your feet dry.
To catastrafarians everywhere – get a real job, your good years are over. Time for the swing back.
To the poley bears. Keep going, you’re doing well
10
While I’m pleased to see nature taking a hand in the “debate” we still have many to convince that another ice age is not an outcome of global warming. It is exasperating I know but the warmers have staked their lives and their credibility on an erroneous assumption. They have made several fundamental mistakes; they have ignored history and they have succombed to their own egos. It is the humble observer of the past who usually can best predict the future.
Next year will see some sanity restored to the ruling class as the plebs revolt. Take heart in the increased questioning of the AGW religion.
It’s been a great year so have a merry Christmas and gird your loins for round 2011.
10
John Brookes:
December 21st, 2010 at 6:41 pm
Awww c’mon John, you and I know Gore speaks in political tongue. He is a master of insinuations.
The infamous giant graphic he presented where he showed CO2 and temperature in lock-step for thousands of years ending in future projections of CO2 levels in the atmosphere (you know the one where he got atop a hoist to reach the levels of CO2 going off the chart) was clearly an insinuation that temperatures were to follow the CO2 line.
You’ve got many other CAGW lies you could defend John, it beggars belief you’d even attempt to defend this one. Shoot yourself in the foot much?
p.s. Merry xmas and a happy new year to you and yours. Invest in some long Johns(boom boom)you’ll need ’em over the next few years
10
John @ 48
Then what’s the big deal about? It’s a pity that the people who write the sort of alarmist articles referenced in #42 don’t also mention that negative feedbacks (including, if it were to go that extent, the black body radiation you mention) dampen the impact of CO2 greenhouse warming. We know that these feedbacks (e.g. clouds) have a strongly stabilising effect on the climate – we’ve got a few BILLION years of evidence for that. Why don’t you write to the link at #42 and inform him of the error of his ways?
Do you honestly think we can legislate the climate? Tax it to make it cooler? And how much tax will it take to make it 1 degree colder? Assuming this is desirable, of course – ask our cousins in America and the UK what they’d prefer!
Cheers,
Speedy
10
Jo,
The PHYSICAL EVIDENCE shows we are in a pre-Ice Age period but the scientists are waiting for the water to rise as their evidence. Where this water is to come from I do not know.
Weather systems are slowing due to the pressure build-up in the atmosphere.
Ice Ages occur when life florishes and builds-up too much gases. Gases bleed off this planet at a certain rate. The long period of an Ice Age gives time for gases to bleed off and life to start the cycle again to a certain point. From Ice Age to Ice Age.
Scientists never did understand how this planet operates. Just followed the LAWS of science created by other men. These do not follow the plans of this planet.
10
Speedy, I think you’ll find that rather than runaway greenhouse, most alarmists are concerned about a rise of about 2+ degrees, back to a pre-ice-age earth. You don’t have to go back a billion years to have an ice-free earth.
10
Yes, Baa, Al Gore did not go into detail in that graph. Maybe he should have. But there is only so much detail you can take in at one sitting, so in making the movie he would have been acutely aware that not everything could be fitted in. Anyway, it seems that CO2 can be a feedback or a forcing. Water can only be a feedback (as it comes out of the atmosphere rather easily, as people in most of Australia are finding out at the moment). Solar radiation can only be a forcing, because nothing we do is changing solar output (but don’t even suggest to the radical greenies that something we are doing is affecting the sun – you’ll never hear the end of it). So although Al left the detail out, the thrust was correct.
My goal over the next few weeks is to get my head around some of the stuff I don’t understand about climate science. Stuff like why adding extra CO2 makes a difference even if what is already there is absorbing all the infrared radiation already.
Anyway, apart from that, lots of cycling and coffee shops.
Have a great Christmas Baa!
10
You might like this one.
Met office says we didn`t forcast a mild UK winter.
http://autonomousmind.wordpress.com/2010/12/21/that-met-office-global-long-range-probability-map/
10
Off topic but interesting.
We’re getting an infrequent but not unusual weather event in Southern California. Its been raining for the last 5 days due to an “Atmospheric River”. From what I can tell, the “River” is due to the location of the jet stream pulling a steady stream (pun intended) of moist tropical air up from Hawaii. High elevations have gotten 20 feet of fresh powder. Rainfall totals so far are just over 3 inches in Orange County with another 5-10″ due over the next two days. Assuming we don’t get mudslides, its all good — we need the water and snow pack.
An “Atmospheric River” is so moist it can “move about 50 million liters of water per second, equivalent to a 100-meter-wide pipe gushing water at 50 kilometers per hour”. Its possible that this one will dump snow on the East Coast.
In the 1800’s an “Atmospheric River” rained over California for 45days straight and bankrupted the state. Heavy rains in North Africa 2002-2003 were also caused by Atmospheric Rivers.
Lets see them include this cloud behavior in their climate models ; )
http://tenaya.ucsd.edu/~dettinge/atmos_rivers.science.pdf
10
It’s worse than we thought Jo!
What happened to globull warbling?
10
Nino4 (select “Full Series”)
shows the dramatic ENSO shift similar to 1988
http://ioc-goos-oopc.org/state_of_the_ocean/sur/pac/nino4.php
Australia 1988-1989 Circulation and Rainfall
http://www.bom.gov.au/amm/docs/1991/keith.pdf
SOI phase relationships with rainfall in eastern Australia
http://onlinelibrary.wiley.com/doi/10.1002/joc.3370120608/abstract
Government should have been able to judge the rainfall related to SOI if they are paying attention?
I guess the interesting question, what was the 1988-1989 season like — especially November to March?
10
“No, I’m not drawing too much meaning out of one day, one flood, or one season.”
I decided to check the Rainfall Percentages chart for September to November 2010 against the 106 year BOM record. LOL, its beyond the 100 percentile in all but one area. BOM is comparing this to 1975 but I’d be interested to see if the sun spot minimum and ENSO cycles align to 1988 and 1989.
Rainfall percentiles
http://www.bom.gov.au/jsp/ncc/climate_averages/rainfall-percentiles/index.jsp?maptype=3&period=September-November&product=hi#maps
“These maps show the monthly, seasonal, multi-seasonal and annual rainfall percentiles for Australia. These percentiles have been calculated over the 106-year period 1900 to 2005.”
“For example, consider a particular location on the 10th percentile map for January. The rainfall category (or rainfall value) at that location marks the threshold for the lowest 10% of records. In other words, 10% of the January rainfall totals recorded at this location over the period 1900 to 2005 have been less than the value shown on the map. Similarly, a particular location on the 90th percentile map marks the threshold of the highest 10% of records. This means that, at this location, 10% of the records are greater than the rainfall value shown on the map.”
10
OOPS — sorry about that
Jumped the gun on the last comment. Your chart is showing Percentage of Mean and the 106 year BOM record is showing Rainfall in Millimeters.
10
To get to a period 2 deg C warmer than today, you only need to go back 2000 years to the Roman Warm Period. In fact, it has been over 2 deg warmer than today at least 3 times in the last 10,000 years.
Looking at the Vostok ice core, we see that every interglacial period in the last 440,000 years was at least 2 deg warmer than today.
Yep, “unprecedented” all right — warmests can’t imagine what could be causing the current warming, so it must be AGW. This is known as “argument from ignorance”.
10
Percentage of Mean and Anomalies are based on 1900-present. This shows the anomalies in millimeters. Looks like a majority of Australia has received about 100mm (nearly 4″) of additional rain Sept-Nov 2010. Eyeballing the Mean chart, this looks like 200% (twice the normal rainfall) for a majority of Australia.
3 Monthly rainfall anomalies for Australia
http://www.bom.gov.au/jsp/awap/rain/index.jsp?colour=colour&time=latest&step=0&map=anomaly&period=3month&area=nat
10
It changes (slightly) the absorption depth, and slows down the radiative transfer. Without assuming strong positive feedbacks (which haven’t shown up) you get a trivial effect.
10
Bob C
At least now John B realises that CO2 cannot be both a cause and an effect of significant temperature increases. If we are to have a stable climate system (which our very existence tends to suggest) then the effect of CO2 must be very weak (for [CO2] > ~200 ppm) or it must be offset by negative feedbacks such as clouds.
Cheers,
Speedy
10
@ John Brookes:
I might add to my post #65, that adding CO2 slows down the radiative transfer of energy for a very small portion of the spectrum — CO2’s absorption lines.
A line of inquiry that might interest you, John, is the Hurst coefficient. This is a property of a time series that indicates whether the series has “memory” and what it does with it: Does it tend to revert to the mean (negative feedback), run from the mean (positive feedback) or have no memory at all (random walk). It can also be used to partially validate models; Or, in the case of climate models, to invalidate them. When you find that the model outputs have completely different values of the coefficient than the historical data you can be assured that the model is not “modeling” the real system.
Estimates of the Hurst Coefficient for historical and paleontological temperature series indicate that the climate system is dominated by negative feedback at most scales.
10
Piers Corbyn embarrasses the UK Met Office (again!) with his correct weather predictions.
http://www.smh.com.au/environment/weather/theres-a-mini-ice-age-coming-says-man-who-beats-weather-experts-20101221-1945a.html
So much for global warming eh?
10
[…] Aussie friends are in mid-summer right now, enjoying the hot weather they are known for. Oh wait, nevermind. No worries mate, the hardy antipodeans can thaw a tinny on the barbie, grab a snow sheila […]
10
“John Brookes” (47), unless YOU are a Climate Realist the wishes were NOT meant for you!
Is reading as well as logical thinking yet another skill which eludes YOU!!!!
PS THE GLOBAL WARMING FRAUD AND THE DESTRUCTION OF PEOPLE’S WAY OF LIFE IS DEADLY SERIOUS TO HUMAN BEINGS WHO CARE ABOUT THEIR FUTURE!
NOT WISHING YOU A MERRY CHRISTMAS, SINCE YOU ARE THE ENEMY IN THIS WAR!
MAKE NO MISTAKE IT IS A WAR…….
10
John Brookes @48.
I suppose you’ve worked it out for yourself – if the feedback loops back on itself (e.g. atmospheric CO2 being both a cause and a result of warming) then an unstable control system will exist in the absence of attenuating factors. Or if the feedback itself is so small as to be insignificant.
Secondly, reverting to a new stable temperature would be correct – but ONLY if the CO2 input was a pulse input. But, in your scenario, once the temperature reaches it’s “stable” level, then there is all this CO2 bubbling out of the oceans for the next 800 or so years to make sure that the temperatures keep rising. Which, of course, gives you more CO2…
I suppose your reference to
could well apply to Al Gore? After all, the Vostok ice core data were available some years before big Al’s “Inconvenient Truth”. I guess that makes Al Gore, by your definition – as a denier?
If you’re interested in CO2’s declining marginal effect, then perhaps have a look at David Archibald’s site.
http://www.davidarchibald.info/papers/SolarCycle24.pdf
See page 35. It’s also got a nice bit on the Vostok ice core data.
Cheers,
Speedy
Cheers,
Speedy
10
That’s not strictly true, do a search on “regenerative amplifiers”, when the loop gain is lower than 1 but close to 1 (e.g. positive 0.9 or something) then you get very high system gain without instability. People really build these and they have some amazing properties.
Having said that, just because regenerative amplifiers do exist, is not strong evidence that our Earth’s climate operates in this mode. Regenerative amplifiers are reasonably difficult to build, even when carefully designed. They can easily turn unstable by mistake if you don’t keep excellent control over the loop gain. I’ve not heard of such a thing turning up naturally anywhere else in physics.
http://en.wikipedia.org/wiki/Regenerative_circuit
Here’s an example from the old days when radio receivers went to great lengths to get high gain out of a single valve. These type of receivers were always notoriously difficult to adjust and eventually everyone gave up on the design once cheap transistors took over the market.
10
Cheers Tel – Happy New Year!
Speedy.
10