

...
Ken has been a very busy man. Another soul in the dedicated army of volunteer auditors. He’s been going through the entire Australian High Quality Data Set as supplied by the Bureau of Meteorology (BOM). He’s been assisted by two readers from this site — Lance and Janama — and we’ll be looking to increase the team (see below).
In the State of the Climate report, both the BOM and CSIRO told us that “since 1960 the mean temperature in Australia has increased by about 0.7 °C. The long term trend in temperature is clear… ” but as usual, what they didn’t say was that the raw data since 1910 (not just from 1960) increased only 0.6°C.
The BOM claim their adjustments are random and neutral. Yet when Ken looked at the raw data from Australia’s 100 high quality rural sites, the adjustments increased the trend in the raw data by 40% — from a 0.6°C rise over 100 years, to 0.85°C over 100 years.
In an email to Ken, Dr David Jones, Head of Climate Monitoring and Prediction, National Climate Centre, Bureau of Meteorology, made a clear claim that the adjustments had no real effect:
“On the issue of adjustments you find that these have a near zero impact on the all Australian temperature because these tend to be equally positive and negative across the network (as would be expected given they are adjustments for random station changes).”
Once again, the adjusted data shows a temperature change of 0.25°C.

Raw anomalies and high quality anomalies. Australian data 1910 - 2010. Blue line - raw data. Red line - adjusted data.
…
Perhaps there are good reasons for all these corrections. But if Ken’s analysis is right, the adjustments themselves account for a third of the reported warming trend in Australia.
Since the adjustments are so influential, BOM and CSIRO need to explain clearly why each adjustment is necessary, station by station. Ken graphed the full set. While some adjustments are cooling, the vast majority are warming, and some of the adjustments are as much as 1 whole degree.
…
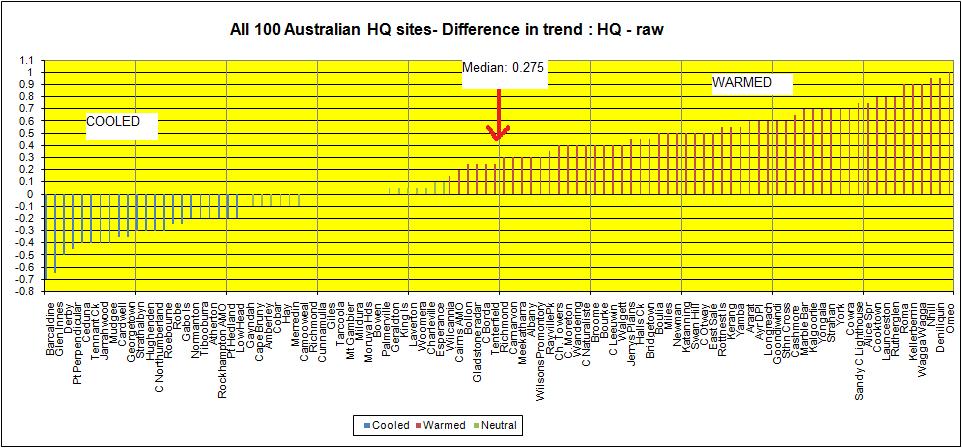
Adjustments to raw Australian temperature records station by station. Median adjustment is 0.275. More adjustments are warming (red) rather than cooling (blue).
Rural now, used to be urban?
BOM claim that the top 100 stations are all pure “rural” (and obviously less likely to be affected by the urban heat island effect):
“Please note: Stations classified as urban are excluded from the Australian annual temperature timeseries and trend map analyses. Urban stations have some urban influence during part or all of their record.” [Source]
But 15 sites that are included used to be classed as urban at some point in the past. But BOM implies that they only include stations that were never affected by urban influences.
The full list is: Cairns AMO, Rockhampton AMO, Gladstone MO, Port Hedland AMO, Roebourne, Geraldton AMO, Albany AMO, Alice Springs AMO, Strathalbyn, Mount Gambier AMO, Richmond AMO, Mildura AMO, East Sale AMO, Cashmore Airport, Launceston Airport.
Stations were originally supposed to have 80 years of data records, but the newer analysis of Della-Marta et al have included six stations with less, including three that started after 1950.
…
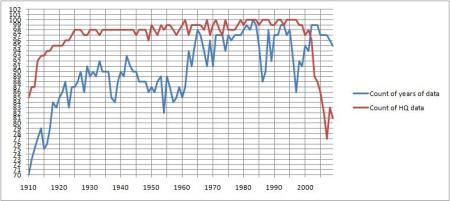
The number of stations with data available for each year
Note that only 70% of raw data is available for 1910; 90% by 1930; another drop from 1945 to 1960; and the huge drop off in HQ data this decade.
Ken concludes:
This study shows a number of problems with the Australian High Quality Temperature Sites network, on which the official temperature analyses are based. Problems with the High Quality data include:
- It has been subjectively and manually adjusted.
- The methodology used is not uniformly followed, or else is not as described.
- Urban sites, sites with poor comparative data, and sites with short records have been included.
- Large quantities of data are not available, and have been filled in with estimates.
- The adjustments are not equally positive and negative, and have produced a major impact on the Australian temperature record.
- The adjustments produce a trend in mean temperatures that is roughly a quarter of a degree Celsius greater than the raw data does.
- The warming bias in the temperature trend is 40%, and in the anomaly trend is 50%.
It is most urgent and important that we have a full scientific investigation, completely independent of BOM, CSIRO, or the Department of Climate Change, into the official climate record of Australia.
We are awaiting a reply from the BOM with much interest.
The full post at Kens Kingdom
Janama was involved in looking at the NSW data and commented at WUWT:
There is site called Bourke Airport in New South Wales – it’s listed as a Rural Site as it is out of town and is therefore included in the national temperature analysis.
Yet Bourke Airport was established in 1999 and has only 9 years of data! So where did the data from 1910 – 1999 come from? Well it matches perfectly with Brewarrina Hospital 80kms away in the heart of Brewarrina that has a record back to 1910 – well it’s not an exact match because the earlier years have been systematically adjusted downwards along with the typical rural town UHI influence yet it’s included as Rural!
The same technique has been used for Glenn Innes airport which was established in 1997 yet by using the Glenn Innes Post Office data with it’s typical UHI ( increasing min temp) they have a record going back to 1910 yet it’s also classified as Rural.
I only studied NSW but I’m pretty sure it is similar throughout the country.
There is so much more to do in Australia
If you feel you have talents in statistics, coordinating people, sorting data, or knowledge of meteorology, we’d like to hear from you. We are putting together a team to do a more wide ranging survey, including site surveys. All of you travelling souls with a camera, please let us know. Comment here or email joanne AT “this domain name”.