Guest post by Dr David Evans
PDF at sciencespeak.com
Now that ClimateGate has buried the fraudulent hockey stick for good, it is easy to prove that global warming is not man-made: just compare the timing of our carbon dioxide emissions with the timing of global warming.
Human Emissions of Carbon Dioxide
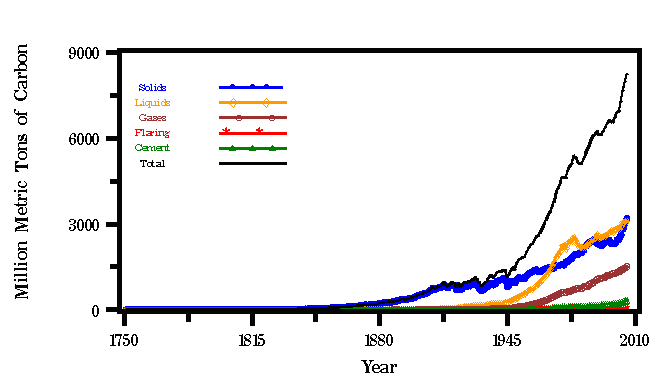
Emissions of carbon dioxide by humans are easy to estimate from our consumption of coal, oil, and natural gas, and production of cement:

Figure 1: Carbon emissions by humans. Source: Carbon Dioxide Information Analysis Center.
The vast bulk of human emissions occurred after 1945, during post-WWII industrialization. Half of all human consumption of fossil fuels and cement production has occurred since the mid 1970s.
Temperatures
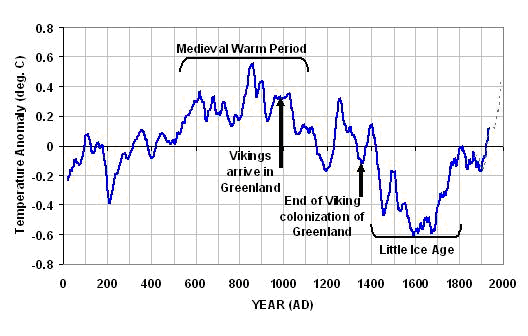
Global temperature proxies (sediments, boreholes, pollen, oxygen-18, stalagmites, magnesium to calcium ratios, algae, cave formation, etc. over a wide geographical range) show a warming trend starting around 1700, with warming and cooling periods about the trend:

Figure 2: Mean global temperature reconstruction based on 18 non-tree-ring proxies, to 1935. Only 11 proxies cover the period after 1935, dotted line. Sources 1, 2, 3, 4: Dr Craig Loehle, National Council for Air and Stream Improvement.
Global thermometer records are more reliable and precise, but only go back to 1880. They confirm that the warming trend extends back to at least 1880, and show warming and cooling periods of about thirty years in each direction:

Figure 3: The global instrumental temperature record to 2000, in the yellow box. Simply draw a trend line through the data. In 2009 we are where the green arrow points. . Source: Dr Syun Akasofu, International Arctic Research Center, University of Alaska Fairbanks.
Compare the Timing
The timing is all wrong for the theory of manmade global warming:
- Temperature increases started in 1700, and the underlying rate of increase has been roughly steady (though there have been warming and cooling fluctuations around the trend).
- Human emissions of carbon dioxide were negligible before 1850, and really only took off after 1945.
If human emissions of carbon dioxide caused global warming, then there would be massive and accelerating global warming after 1945 and almost no global warming before 1945. Obviously this is not the case.
Conclusions
- There is almost no relationship between human emissions and global temperature, so global warming is not mainly due to human emissions of carbon dioxide.
- Something other than human emissions caused the global warming prior to 1850.
- The steadiness of the underlying temperature trend since 1700 suggests that whatever caused the warming prior to 1850 is still causing warming, and that the effect of human emissions of carbon dioxide is relatively insignificant.
QED
Notes
- This only proves that the recent global warming was not mainly due to human emissions of carbon dioxide. It does not rule out all possible man-made influences, but since the popular debate is overwhelmingly about the role of our carbon dioxide emissions this simplification is justifiable in this context.
- Obviously the proxy global temperature in Figure 2 is deadly to the idea of man-made global warming. The alarmists tried to replace Figure 2 with their hockey stick graph, which shows global temperatures falling slightly since 1000 AD then suddenly increasing from 1910. The hockey stick graph does not show the little ice age or the medieval warm period—it reckons that the world was about 0.8°C cooler than present in the medieval period. The hockey stick graph is now firmly established as a fraud:
- Last week’s Climategate leaks (see here, here, here, and here) include computer code that shows blatant fudging to create the hockey stick shape (see here).(By the way, the leaked documents and emails were carefully selected, which would have taken a considerable time. Hackers quickly grab what they can before being detected, so it probably wasn’t a hack.)
- Steve McIntyre showed that the original hockey stick graph created by Michael Mann was invalid, based on cherry picked data and biased statistical processing (if you feed stock price data into the software used to create the graph, a hockey stick usually emerges). The US Congress appointed a committee led by Edward Wegman to investigate, and it concluded “Overall, our committee believes that Mann’s assessments that the decade of the 1990s was the hottest decade of the millennium and that 1998 was the hottest year of the millennium cannot be supported by his analysis.”
- Another hockey stick graph was constructed from tree ring data by Briffa in 1995. When his data was finally divulged in late 2009 after years of denied requests, it was found that his graph essentially relied on one freakish tree in the Yamal peninsula of northern Russia. See here, here, and here.
- The medieval warm period is real, according to 768 individual scientists from 454 separate research institutions in 42 different countries, and hundreds of peer-reviewed papers see here). Here (on page 9) is a map of the world showing how much hotter than today it was in many various parts of the world, according to these studies—there are many warmer results (and a very few cooler results), in every continent except Australia (which had no studies).
- It is easily verifiable that it was a lot colder in the 1700s. Example 1: During the 1700s the Thames River in London would regularly freeze over, and people would hold fairs on the ice—the last time the Thames froze over was 1804. Example 2: There are many reports of it being so cold in Europe in the 1700s that animals in barns would die of cold—which never happens any more. The little ice age is also real.
- The IPCC prominently displayed the hockey stick in six diagrams in their Third Assessment Report (2001), and the IPCC adopted the hockey stick graph into their logo. Then it was revealed as a fraud by McIntyre and Wegman. The Fourth Assessment Report (2007) omits any reference to the hockey stick graph, and the IPCC dropped the hockey stick graph from their logo.
- Now that ClimateGate has proven the hockey stick is a fraud beyond any credibility, perhaps the alarmists will finally have the decency to admit that Figure 2 is as good a picture of the past as we have. The conclusions of the proof above are then obvious and undeniable: human emissions of carbon dioxide are not the main cause of global warming.
- To quote the hockey stick graph—and thereby deny the temperature reconstruction in Figure 2, the medieval warm period, and the little ice age—is anti-science fraud. But that’s what the alarmists had to do to prevent the obvious truth of the proof above.
- Even without Figure 2, the global thermometer record in Figure 3 is sufficient to cast very considerable doubt on the idea that human emissions of carbon dioxide cause global warming: the temperature rise from 1880 to 1950 is roughly the same as that from 1950 to the present, but the human emissions were very different. In a similar vein, there have been a 29% increase in carbon dioxide emissions since 2000 but satellites show that the global temperature has fallen since then.
- Tree rings are easy to use as a temperature proxy, but are unreliable because tree growth varies strongly in response to many factors other than temperature (such as water, carbon dioxide, fertilizer, tree age), because the width of tree ring to temperature is not linear, and because trees adapt genetically to climate changes and change basic properties like size and root-to-shoot ratio. See here (p. 1050). The temperature reconstruction in Figure 2 simply combines all the best non-tree-ring data that is available.