Billions for “the climate” but nothing left for audits?
It’s the most “important crisis” on Earth today, and we must rely on the science, yet it’s not quite important enough for anyone to independently double check those results. And just in case you think that the peer review process does that double checking, think again. Most papers are reviewed by only two or three colleagues who may be hoping to prove the same “theory” as the authors (so not especially keen to find holes in it), and who are unpaid and anonymous. (The saying “you get what you pay for” comes to mind. We pay to find a crisis, and we don’t pay to check the results.)
The best examples of unpaid auditing are the work of independent scientists Steve McIntyre, and Anthony Watts. The irony is that skilled workers are providing a pro bono service, normally a service to help those who can’t afford it, but in this case, to assist the largest single financial entity on the planet.
Steve McIntyre and the misleading “Hockey Stick” graph
Steve McIntyre was trained in mathematics and worked in mineral exploration for 30 years (and despite claims to the contrary has never worked for the oil industry). Below is the Hockey Stick Graph from the 2001 IPCC Assessment Report.
McIntyre became suspicious of the Hockey Stick Graph because it was described in terms that reminded him of the Bre-X fraud. He is retired, and worked at considerable personal expense and without funding.
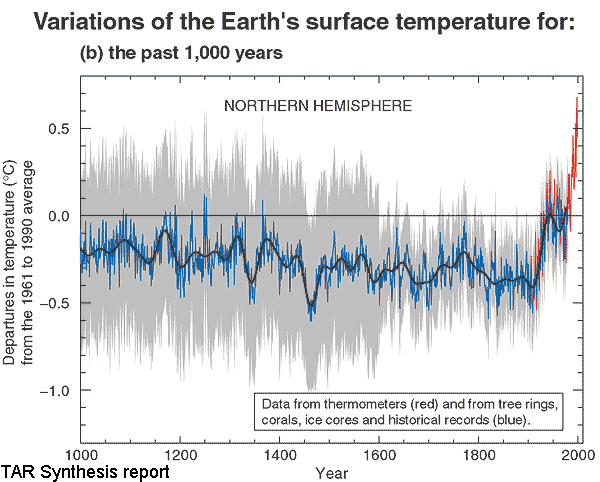
The infamous Hockey Stick Graph (Michael Mann et al 1998)
After dogged persistence to obtain the original data, McIntyre found embarrassing, crippling flaws in the Hockey Stick graph, a graph that wiped out centuries of recorded anecdotal history, archaeological finds, and data from almost every other source except unreliable “tree rings”. (Tree rings not only grow wider in warm years, but also grow wider in wet years, as well as being affected by soil nutrients, and by the level of CO2 in the air.) McIntyre found that the graph Michael Mann had produced, which was used repeatedly through the IPCC 2001 report, was so poorly constructed statistically that it was possible to feed in random “red noise” data and it still produced a hockey stick shape. A true peer review ought to have picked this up. Instead the graph occupied center stage for three or four years until a determined skeptical individual demanded the data (which was misplaced, then inaccurate, then inconsistent) and checked the statistics.
McIntyre and Ross McKitrick went on to publish peer-reviewed papers. 5, 6, 7 Wegman, and other independent statistical experts supported McIntyre and McKitrick.8 Craig Loehl assessed the same time period using proxies other than tree rings, and the reality of the Medieval Warming Period (800 – 1100 AD) and the Little Ice Age (1400 – 1800) stands out. 9
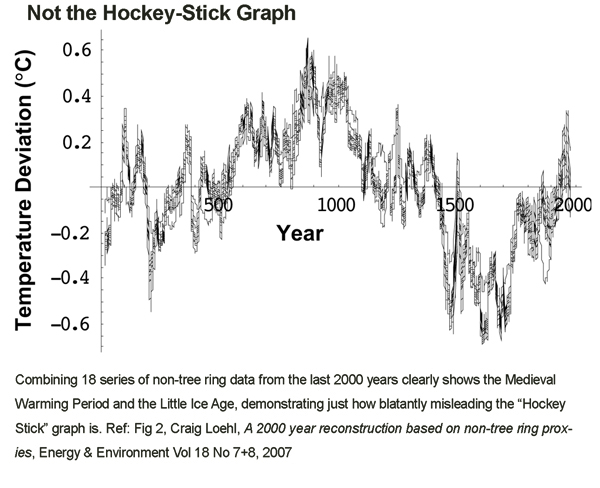
Combining 18 series of non-tree ring data from the last 2000 years clearly shows the Medieval Warming Period and the Little Ice Age, demonstrating just how blatantly misleading the “Hockey Stick” graph is.
Despite the agreement between many different data sets, and the resounding defeat of the statistics in the graph the debate about the Hockey Stick Graph goes on, with the most dubious tactics employed to revive the fraudulently inept graph.
Watts Up with That? Hundreds of volunteers do government work for free
Likewise Anthony Watts, a former television meteorologist, has amassed a group of 650 volunteers to photograph and record more than 800 temperature sensors used in the United States Historical Climatological Network (USHCN) —something NOAA itself ought to do. Despite receiving around $4 billion per annum in funding, NOAA doesn’t do large scale site checks to make sure its sensors meet required standards.
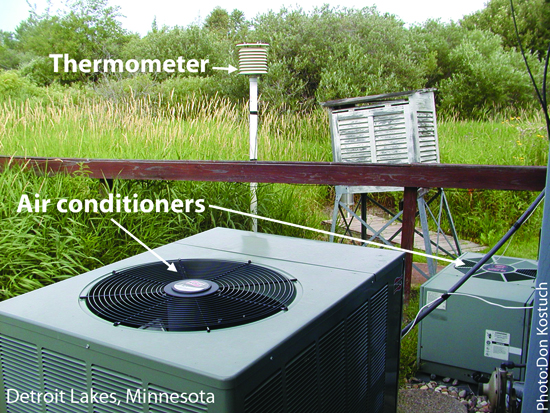
Figure 1: The majority of NOAA temperature sensors are sited near air conditioning outlets, car parks, buildings, and other artificial sources of heat.
These are not minor errors of placement that Anthony’s team of volunteers has photographed. Recording stations are placed next to outlets of air-conditioning units (see Fig 1), above asphalt in car-parks, on scorching hot concrete roof-tops, and near heated buildings. They found that 89% of all stations checked so far fail to meet the National Weather Service’s own siting requirements. 13
Again, the flaws are systematic. As sensors have been upgraded to electronically report the data, they have been installed by people equipped with only pickaxes and shovels. Where old sensors were once placed in the open over grass on the far side of a car-park, the new meters are electronic and need to be connected by cable to the building. Not surprisingly they have often ended up in less than ideal places much closer to buildings. Realistically, who would dig across an asphalt car-park by hand with a shovel to make a “trench” for the cable?
The team at NOAA prefers to use “mathematical adjustments” to compensate for the “urban heat island effect” and poor placement. If they were really interested in getting the data right, wouldn’t they just rule out all the stations that aren’t sited correctly until such time that they are fixed? Wouldn’t they pay to hire excavators to dig trenches?
Read the Full Report at the Science and Public Policy Institute.
References
- Climate Audit, Hockey Stick Studies page, http://www.climateaudit.org/?page_id=354.
- Steve McIntyre, Short Bio. http://www.uoguelph.ca/~rmckitri/research/stevebio.doc.
- Steve McIntyre, comment on Climate Audit. http://www.climateaudit.org/?p=592#comment-18195.
- Casper and The Jesus Paper, Bishop Hill, http://bishophill.squarespace.com/blog/2008/8/11/caspar-and-the-jesus-paper.html.
- Corrections To The Mann Et. Al. (1998) Proxy Data Base And Northern Hemispheric Average Temperature Series, Energy and Environment, Vol 14, No 6, 2003. http://www.climateaudit.org/pdf/mcintyre.mckitrick.2003.pdf.
- McIntyre McKitrick, Critique of MBH98. http://www.climateaudit.org/pdf/mcintyre.ee.2005.pdf.
- Hockey Sticks, principal components, and spurious significance. Geophys Res Letters, Vol 32, 2005 http://www.climateaudit.org/pdf/mcintyre.grl.2005.pdf.
- The Wegman Report. http://www.climateaudit.org/pdf/others/07142006_Wegman_Report.pdf.
- Craig Loehl, A 2000 year reconstruction based on non-treering proxies, Energy & Environment Vol 18 No 7+8, 2007 http://www.ncasi.org/publications/Detail.aspx?id=3025.
- About, Watts Up With That: http://wattsupwiththat.com/about/.
- Surface Stations Project, http://www.surfacestations.org/.
- FY Budget Highlights, NOAA. http://www.corporateservices.noaa.gov/nbo/FY09_Rollout_Materials/NOAA_One_Pager_FINAL.pdf.
- Is the US Surface Temperature Record Reliable? Anthony Watts. http://wattsupwiththat.files.wordpress.com/2009/05/surfacestationsreport_spring09.pdf.
Notes for commenters:
These men are hero’s and deserve our support, and there are many others too. This is a chance to recognize all the skeptics who work unpaid, or risk their paid career, or work above and beyond their duty to help. Who stands up against the bullying; who fights to get raw data; who double checks the results and who writes letters to politicians?
Climate Money: PARTS 1- 4.
1. Climate Money Massive Funding Exposed.
2. How auditing of the Climate Industry is mostly left to volunteers. (You are on this page).
3. How the monopolistic funding ratchet slows scientific progress.
4. Why blaming Exxon is a smoke screen to disguise the real vested interests.