Back in 2020 nothing was more important than climate change. Swept away by the crisis, Amazon Founder Jeff Bezos set up a $10,000 million dollar fund to ‘fight climate change and protect nature’. It was the largest piece of atmospheric philanthropy known to mankind. But it’s become a bit of a ghost account.
The money was supposed to be spent by 2030, but six years in, 72% of the funds still haven’t been allocated.
Officials at the Bezos Earth Fund said they remain committed to disbursing $10 billion by 2030. With four years left on the timeline, however, only 28% of the promised funds have been allocated so far.
In interviews and statements, Earth Fund executives reaffirmed their plan to spend $10 billion by the end of the decade. “Many of our strategies remain the same,” a spokesperson said…
Now that Trump sucked the government subsidies away from pet climate projects, you’d think the Bezos funding would be more “needed” than ever.
Breakthrough Energy, the Bill Gates-backed group that bankrolls climate tech, has stopped making new investments from one of its key funds to scale up nascent green technologies, just as the market for these startups is being squeezed by President Donald Trump’s assaults on climate policy.
After supporting 10 startups and spending “high hundreds of millions of dollars,” a Breakthrough Energy spokesperson said, it has now suspended new investment from the fund.
They all have their excuses for the turnaround
Jeff Bezos says AI will solve climate change. Even though AI is consuming vast quantities of gigawatts, pushing old coal plants back into action, it will undo the crisis about climate change (especially if it accidentally looks at the scientific data, eh?)
According to the Fund, it is ‘harnessing [AI’s] power to transform how the world addresses climate and nature’.
Dr Stephan Singer, a senior global energy policy adviser with Climate Action Network International, said in a report by the Guardian in 2024: ‘The projects of the Bezos fund do not address the key issues of the fundamental climate crisis we are facing – they are nice but unfortunately cosmetic.’
Dr Singer was discussing the Fund’s big bet on carbon offsetting schemes, widely understood to do little to mitigate global heating.
Bill Gates says technology has already saved us
Gates was thrilled at how well the decarbonization plan was going. If we pretend that giant unaccountable organizations like the IEA make useful predictions, rather than hyperbolic spam, then things are going much better than they might have been in the IEA doomer imaginary future.
In a LinkedIn post published yesterday, Microsoft co-founder and climate investor Bill Gates shared an optimistic update on global energy-related CO₂ emissions that challenges much of the prevailing doom-and-gloom narrative.
The key graphic Gates posted tells the story clearly:
In 2014, the International Energy Agency (IEA) projected that, under then-current policies, the world would be emitting roughly 50 billion tons (50 Gt) of energy-related CO₂ per year by 2040.
The IEA’s latest 2024 assessment, using the same “current policies” framework, now puts that 2040 figure at just 29 Gt — a stunning 42% reduction in the expected emissions trajectory in only one decade of forecasting updates.
The 2020s was the ‘decisive decade’, said Bezos. Indeed.
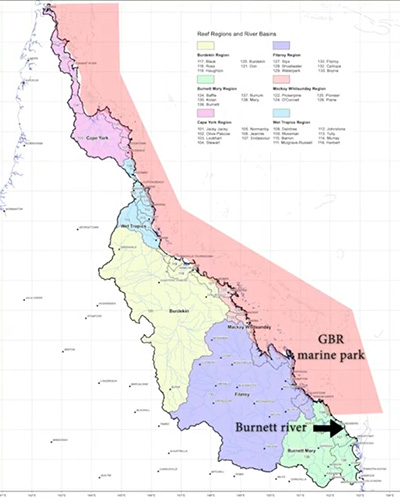
For some reason no one can explain, the catchments for the Burnett and Mary rivers are included in the Great Barrier Reef protection legislation. These rivers don’t even flow into the Great Barrier Reef Marine Park, they empty to the south of it, and get swept away by the giant East Australian Current which heads south away from the reef.
The amount of water moving there is so vast that the entire annual flow of the Burnett and Mary Rivers passes in just two minutes.
Any runoff the rivers add to that flow will have to do a full lap of the Pacific Ocean to Peru and back before they get to the Great Barrier Reef.
We’re being so precious about the reef, but there are also eddy currents and gyres in the area that stir up the ocean floor and add a rich nutrient mix to the water. One near Fraser Island is so rich it causes phytoplankton blooms all by itself. Farms also use pesticides, and bad land management could add sediment to water — but as Peter Ridd says “where is the data”?
So despite farms adding an insignificant amount of nutrients to a current flowing away from the reef, farmers spread over 53,000 square kilometers of land must comply with rules about runoff, watering, and fertilizer. And they and their advisors all need to keep records of their compliance.
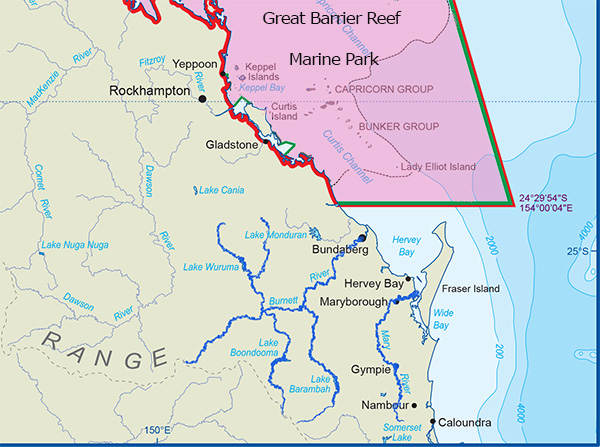
On this close up map below the distance from Bundaberg to Lady Elliot Island (the nearest reef) is 77 kilometers away.
The Burnett and Mary Rivers flow into an area south of the Great Barrier Reef.
Let’s check that science — Queensland readers — we need your help.
Peter Ridd has looked closely into this (see his video below from last year.) The Australian Environment Foundation (AEF) is starting up a campaign to get the Queensland Productivity Commission to run an independent inquiry into the scientific assumptions behind environmental laws. The initial case study would be the Great Barrier Reef Protection Measure in the catchment of the Burnett-Mary rivers because it is a star example of pointless Big Government legislation.
To get started we need 3000 signatures on the QLD Parliamentary Petition before it closes on June 12th. Only people living in Queensland can sign it. But if you know someone who lives there please send them an email.
Professor Peter Ridd is organizing this as Chairman of the Board at the AEF. I am also a Director of the AEF.
We’re facing the sixth mass extinction but carbon accounting games are a performance art and almost no one cares that the largest emitter on Earth has gaping holes in their numbers.
One reader in The Wall Street Journal, pointed out that The Onion saw this coming years ago:
The Paris Agreement allows everyone to set their own targets, and to define their own terms (and retrospectively as well). So China decided it would count “carbon intensity”, rather than carbon output. But it didn’t define carbon intensity. Normally it means the amount of CO2 emitted per unit GDP — which would work well for China with its rapidly growing economy. But something else is going on.
In the last five years China had promised to cut emissions by 18%, but all the official statistics suggested it was only getting 12% of the way there. Then a miracle happened and suddenly China leapt to a 17.7% reduction, just in the nick of time.
The Ecoworriers team at Carbon Brief are probably the only ones who do care and they drilled through all the detail. But being as generous as they can, even they can’t explain where 380 megatons went.
To put that in perspective, Australia’s entire annual emissions was 459 megatons. It’s like someone just said Oopsie to 80% of our national emissions.
So the rules are loose, and China is taking advantage of every loophole. The CCP knows that the UN isn’t going to turn up with guns to say “pay up”. But there is a price. The whole renewables project that China profits from looks just that much more dodgy, and so does the CCP. Who can trust anything they say?
Unlike the West’s green radicals, China isn’t willing to sacrifice its economy to meet its climate pledges. But Beijing isn’t above cooking its carbon books to gull Western activists into thinking it is.
At United Nations climate conferences in Copenhagen in 2009 and Paris in 2015, Beijing vowed sizeable reductions in the amount of carbon China emits per dollar of gross domestic product, or carbon intensity. Subsequent national planning documents reiterated this goal.
Old-style accounting implies China’s emission grew by a huge 1,430 megatonnes in the last five years. But the new carbon-intensity figures imply only 690 megatons of CO₂ growth, creating a 730 megatonnes from CO₂ gap.
A major change in the way that China measures its core climate goal has effectively halved the growth in the country’s carbon dioxide (CO2) emissions over the past five years.
Here’s one slight of hand — only coal burnt in pursuit of energy counts. Not coal converted to plastics, asphalt, rubber, chemicals or fertilizer.
A footnote in China’s latest statistical communique offers a brief description of carbon intensity as relating to the CO2 emissions from “energy activities and industrial production”.
This indicates that the carbon-intensity calculation now includes industrial process emissions and excludes non-energy uses of fossil fuels, shown by the “new scope” in the figure above.
Remember China’s huge coal-to-liquids program that I wrote about two months ago? Every year nearly 400 million tons of coal are converted to fertilizer, chemicals, plastics, jet fuel and diesel.
And some of these accounting tricks make sense. The Tupperware containers for example, are legitimately holding their CO2 (for now). But even that trick doesn’t account for the missing CO2.
So China treats us like mugs and we cheer it on. Why?
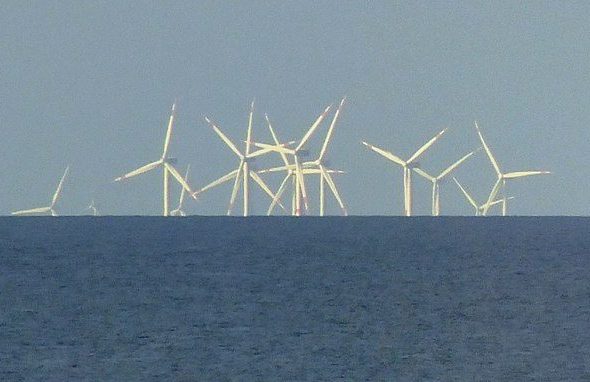
Wetzel describes this as a ‘wind power puzzle’ and discusses several possible causes:
Several years with weak wind conditions,
More frequent curtailments of wind turbines due to grid bottlenecks,
The expansion of wind farms at weaker inland locations,
So-called shading or ‘wind theft’ effects between wind turbines.
Australia has already done the same experiment. No matter how much wind power we add to the grid we can’t seem to get the bare minimum to increase, (the dark green columns at the bottom).
We’ve 1,000 years of coal left underground, but we’re returning to burning trees again to scare off the Climate-Yeti.
Environmentalists are aghast, of course, even though this is exactly what they wanted — a lower carbon form of concrete, and an end to coal.
But the 100 year old coal kiln needs $100m worth of transformation to be able to burn wood and tyres properly. So this is an expensive shift, and it won’t be easy to undo, and now the Greens and ABC (but I repeat myself) are concerned…
One of the largest cement manufacturing sites in Australia has temporarily shut operations as it upgrades its coal-fired kiln to accept alternative fuel sources such as used tyres and “sustainable” wood waste.
Cement Australia’s Railton plant, in north-west Tasmania, will stop production for an estimated 45 days to allow for the $108 million works as the company moves to reduce its reliance on fossil fuels.
The whole point of the ABC story is to gnash teeth over where will the woodchips come from? The concrete company says it will only use’ certified sustainable’ wood which should make the EcoWorriers crack the champers. But the greener types can see the temptation will be there to increase the harvest of native forest, to generate more ‘sustainable’ offcuts.
The Concrete company didn’t want to explain where the wood is coming from, possibly because they didn’t want anyone to chain themselves to any trees.
“To this day, they’ve not told people exactly where that wood was coming from, but we’re pretty sure it’s going to be native forests and Tasmanian timbers,” he said.
“If they need a very large amount of wood, and they will, isn’t that going to then drive logging and potentially increase the rate of logging in order to be able to sustain the flow of wood that they require?”
The, ABC, notably, did not interview any foresters, probably because they might be afraid the foresters would say the native forests could use some thinning so they don’t vaporize in a pyroclastic koala-killing blaze with one bolt of lightening.
Instead we get the bread and circuses statistics:
By switching to alternative fuels, Cement Australia expects to reduce coal use by 111,000 tonnes a year, and reduce carbon dioxide by 105,000 tonnes over the same period.
But not the statistic that matters — How many degrees with that cool the world? The ABC have no idea.
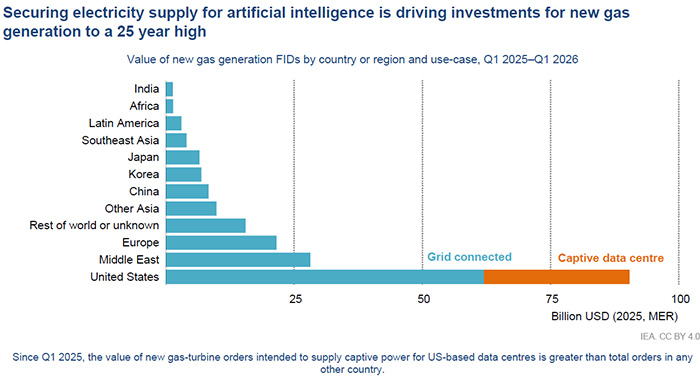
The ferocious demand for gas power to feed US Datacenters has triggered a global shortage
Such is the cashed up desire for gas turbines in the US, that all around the world other people are struggling to get gas turbines. Manufacturers have ramped up production, but waiting times have blown out to more than five years. In sheer desperation, companies are converting jet engines into small gas turbines.
The demand for gas power in “US captive data centers” is so large it is bigger than the investment in gas power in any other country except for the investment in grid connected datacentres, also in the USA.
Anyone who thinks they can just add a gas turbine here and there to patch up a gap in their renewable transition could be in for a nasty surprise.
“It only takes 30 -45 days to convert a Boeing 737 Jet Engine….”
Turbine makers like Siemens, GE Vernova, and Mitsubishi are ramping up production, but expansion projects could take up to 5 years.
Yet all these plans take time to materialize, and industrial electricity consumers need it now, so they are converting jet engines to gas turbines. The Wall Street Journal reported earlier this month that the conversion of jet engine turbines to power generation turbines was a growing business enjoying a lot of investor interest. One such converting company, FTAI Aviation, had seen its shares gain 42% since it announced this new business, which takes just 30-45 days to convert a Boeing 737 jet engine into a power generation gas turbine.
However aircraft jet engines are much smaller than the full capacity of a proper gas power turbine. A 737 engine is only about 25MW, compared to a proper gas power plant which might be 400MW or 600MW. They are really just large emergency generators. Still if Australians get poor enough from the renewable transition and crazy tax laws, soon we’ll have plenty of spare jets to convert to tiny power stations, right? The riff raff won’t be flying…
If only Australia had fully functional old coal plants they could restart like France, Germany and the US did, we could have sold the cheap power to desperate data center operators instead of being a technology backwater. Instead we blow them up, and throw a party to celebrate.
I’ll be speaking tomorrow at an event organized by Gerard Rennick’s team in WA. He will take part from Queensland by video link. It’s all things crazy about the energy crisis, and the pagan witchcraft masquerading as science, and finding a path out of the swamp.
The great thing about these events is meeting the people who come.
The worst global warming nightmares all came true 130,000 years ago, done by mother nature all by herself. Most of the time the media ignores all this inconvenient catastrophe that lasted an astonishing ten thousand years. New research suggests almost all the Ross Ice Shelf melted and large parts of the West Antarctic Ice Sheet disappeared too, yet somehow Emperor penguins survived. So did the seals and the whales, and there was no tipping point that broke the planet. But the Hunter-gatherer beach clubs of 131,000 years ago were all washed away.
A new study looked at dust in Antarctic ice cores and noticed there was an ominous shift 120,000 years ago. In other periods the ice core had a layer of fine dust that seems to have traveled all the way from South American volcanoes. But when the Earth last warmed out of the depths of the ice age 130,000 years ago, a different type of coarse grainy dust appeared in the ice core they dug out. Normally big grains don’t travel far on the wind, so this implied that it was coming from a close volcanic source. And while there are plenty of volcanoes on Antarctica, they are normally buried under ice and their dust doesn’t spread. This meant the icesheets must have melted so far that the volcanoes were exposed.
The isotopic fingerprint of the fine dust matched dust from volcanoes in South America. But the large grained dust matched rocks in McMurdo Sound in the West Antarctic Rift area.
We already knew things must have been dramatic in Antarctica at the time because sea levels were so much higher. There are remnants of corals up to 9 meters higher near Kalbarri in Western Australia, a stable part of very old crustal plate.
The map dramatically changed:
The Eemian period was hotter than our current Holocene.
Lest we forget, every hottest ever record today is nothing compared what has already happened.
Seas are rising at 1 to 3mm a year. Yet humanity saw the seas rise by 125 meters (twice) — children used to play on the continental shelf until all their beaches disappeared, their homes washed away, and their favourite reefs were destroyed. Humans saw ice caps a mile thick roll over Manhattan and humans saw the wall of ice melt away too.
Teach the children what real climate change is. The more they know about prehistoric times and geology, the less vulnerable they’ll be to the scaremongering.
But sometime, some day, the ice sheets will return. We do need to talk about that.
REFERENCE
Austin J. Carter et al, Diminished Ross Ice Shelf and West Antarctic Ice Sheet during Last Interglacial warming, Nature Geoscience (2026). DOI: 10.1038/s41561-026-01988-1
We use cookies to ensure that we give you the best experience on our website. If you continue to use this site we will assume that you are happy with it.


Recent Comments